Huge VolumesHuge Volumes indicator plots areas on the chart where trading volume spikes — showing where strong buying or selling pressure takes place.
It helps visualize how large players move in and out of positions, making it easier to spot potential turning points or confirm trends.
Volumedelta

PRO Scalper(EN)
## What it is
**PRO Scalper** is an intraday price–action and liquidity map that helps you see where the market is likely to move **now**, not just where it has been.
It combines five building blocks that professional scalpers often watch together:
1. **Session Volume-Weighted Average Price (VWAP)** — the intraday “fair value” anchor.
2. **Opening Range** — the first minutes of the session that set the day’s balance.
3. **Trend filter** — higher-timeframe bias using **Exponential Moving Averages (EMA)** and optional **Average Directional Index (ADX)** strength.
4. **Two independent Supply/Demand zone engines** — zones are drawn from confirmed swing pivots, with midlines and **touch counters**.
5. **Order-flow style visuals**:
* **Delta bubbles** (green/red circles) show where buying or selling pressure was unusually strong, using a safe **delta proxy** (no external feeds).
* **Liquidity densities** (subtle rectangular bands) highlight clusters of large activity that often act as magnets or barriers and disappear when “eaten” by strong moves.
This mix gives you a **complete intraday picture**: the mean (VWAP), the day’s initial balance (Opening Range), the higher-timeframe push (trend filter), the nearby fuel or brakes (zones), and the live pressure points (bubbles and densities).
---
## Why these components
* **VWAP** tracks where the bulk of traded value sits. Price tends to rotate around it or accelerate away from it — a perfect compass for scalps.
* **Opening Range** frames the early auction. Many intraday breaks, fades and retests start at its boundaries.
* **EMA bias + ADX strength** separates trending conditions from chop, so you can keep only the zones that agree with the bigger push.
* **Pivot-based zones (two pairs at once)** are simple, objective and fast. Midlines help with confirmations; touch counters quantify how many times the zone was tested.
* **Bubbles and densities** add the “effort” layer: where the push appeared and where liquidity is concentrated. You see **where** a move is likely to continue or fail.
Together they reduce ambiguity: **context + level + effort** — all on one screen.
---
## How it works (plain language)
* **VWAP** resets each day and is calculated as the cumulative sum of typical price multiplied by volume divided by total volume.
* **Opening Range** is either automatic (a multiple of your chart timeframe) or a manual number of minutes. While it is forming, the highest high and lowest low are captured and plotted as the range.
* **Trend filter**
* **EMA Fast** and **EMA Slow** define directional bias.
* **ADX (optional)** adds “trend strength”: only when the Average Directional Index is above the chosen threshold do we treat the move as strong. You can source this from a higher timeframe.
* **Zones**
* There are **two independent pairs** of pivots at the same time (for example 10-left 10-right and 5-left 5-right).
* Each detected pivot creates a **Supply** (from a swing high) or **Demand** (from a swing low) box. Box depth = **zone depth × Average True Range** for adaptive sizing; the boxes **extend forward**.
* Midline (optional dashed line inside the box) is the “balance” of the zone.
* **“Only in trend”** mode can hide boxes that go against the higher-timeframe bias.
* The **touch counter** increases when price revisits the box. Labels show the pair name and the number of touches.
* **Bubbles**
* A safe **delta proxy** measures bar pressure (for example, range-weighted close vs open).
* A **quantile filter** shows only unusually large pressure: choose lookback and percentile, and the script draws a circle sized by intensity (green = bullish pressure, red = bearish).
* **Densities**
* The script marks heavy activity clusters as **subtle bands** around price (depth = fraction of Average True Range).
* If price **breaks** a density with volume above its moving average, the band **disappears** (“eaten”), which often precedes continuation.
---
## How to use — practical playbooks
> Recommended chart: crypto or index futures, one to five minutes. Use **one hour** or **fifteen minutes** for the higher-timeframe bias.
### 1) Trend pullback scalp (continuation)
1. Enable **Only in trend** zones.
2. In an uptrend: wait for a pullback into a **Demand** zone that overlaps with VWAP or sits just below the Opening Range midpoint.
3. Look for **green bubbles** near the zone’s bottom or a fresh **density** under price.
4. Enter on a candle closing **back above the zone midline**.
5. Stop-loss: below the bottom of the zone or a small multiple of Average True Range.
6. Targets: previous swing high, Opening Range high, fixed risk multiples, or VWAP.
Mirror the logic for downtrends using Supply zones, red bubbles and densities above price.
### 2) Reversion with liquidity sweep (fade)
1. Bias neutral or countertrend allowed.
2. Price **wicks through** a zone boundary (or an Opening Range line) and **closes back inside** the zone.
3. The bubble color often flips (absorption).
4. Enter toward the **inside** of the zone; stop beyond the sweep wick; first target = zone midline, second = opposite side of the zone or VWAP.
### 3) Opening Range break and retest
1. Wait for the Opening Range to complete.
2. A break with a large bubble suggests intent.
3. Look for a **retest** into a nearby zone aligned with VWAP.
4. Trade continuation toward the next zone or the session extremes.
### 4) Density “eaten” continuation
1. When a density band **disappears** on high volume, it often means the resting liquidity was consumed.
2. Trade in the direction of the break, toward the nearest opposing zone.
---
## Settings — quick guide
**Core**
* *ATR Length* — used for zone and density depths.
* *Show VWAP / Show Opening Range*.
* *Opening Range*: Auto (multiple of timeframe minutes) or Manual minutes.
**Trend Filter**
* *Mode*: Off, EMA only, or EMA with ADX strength.
* *Use higher timeframe* and its value.
* *EMA Fast / EMA Slow*, *ADX Length*, *ADX threshold*.
* *Plot EMA filter* to display the moving averages.
**Zones (two pairs)**
* *Pivot A Left / Right* and *Pivot B Left / Right*.
* *Zone depth × ATR*, *Extend bars*.
* *Show zone midline*, *Only in trend zones*.
* Labels automatically show the touch counters.
**Bubbles**
* *Show Bubbles*.
* *Quantile lookback* and *Quantile percent* (higher percent = stricter filter, fewer bubbles).
**Densities**
* *Metric*: absolute delta proxy or raw volume.
* *Quantile lookback / percent*.
* *Depth × ATR*, *Extend bars*, *Merge distance* (in ATR),
* *Break condition*: volume moving average length and multiplier,
* *Midline for densities* (optional dashed line).
---
## Tips and risk management
* This script **does not use external order-flow feeds**. Delta is a **proxy** suitable for TradingView; tune quantiles per symbol and timeframe.
* Do not trade every bubble. Combine **context (trend + VWAP + Opening Range)** with **level (zone)** and **effort (bubble/density)**.
* Set stop-losses beyond the zone or at a fraction of Average True Range. Predefine risk per trade.
* Backtest your rules with a strategy script before using real funds.
* Markets differ. Parameters that work on Bitcoin may not transfer to low-liquidity altcoins or stocks.
* Nothing here is financial advice. Scalping is high-risk; slippage and over-trading can quickly damage your account.
---
## What makes PRO Scalper unique
* Two **independent** zone engines run in parallel, so you can see both **larger structure** and **fine intraday levels** at the same time.
* Clean **“only in trend” rendering** — zones and midlines against the bias can be hidden, reducing clutter and hesitation.
* **Touch counters** convert “feel” into numbers.
* **Self-contained order-flow visuals** (bubbles and densities) that require no extra data sources.
* Careful defaults: subtle colors for densities, clearer zones, and responsive auto Opening Range.
---
(RU)
## Что это такое
**PRO Scalper** — это индикатор для внутридневной торговли, который показывает **контекст и ликвидность прямо сейчас**.
Он объединяет пять модулей, которыми профессиональные скальперы пользуются вместе:
1. **VWAP** — средневзвешенная по объему цена за сессию, «справедливая стоимость» дня.
2. **Opening Range** — первая часть сессии, задающая баланс дня.
3. **Фильтр тренда** — направление старшего таймфрейма по **экспоненциальным средним** и при желании по силе тренда **Average Directional Index**.
4. **Две независимые системы зон спроса/предложения** — зоны строятся от подтвержденных экстремумов (пивотов), имеют **среднюю линию** и **счетчик касаний**.
5. **Визуализация «ордер-флоу»**:
* **Пузыри дельты** (зеленые/красные круги) — места повышенного покупательного/продажного давления, рассчитанные через безопасный **прокси-дельты**.
* **Плотности ликвидности** (ненавязчивые прямоугольные ленты) — скопления объема, которые нередко притягивают цену или удерживают ее и исчезают, когда «разъедаются» сильным движением.
Итог — **полная картинка момента**: среднее (VWAP), баланс дня (Opening Range), старшая сила (фильтр тренда), ближайшие уровни топлива/тормозов (зоны), текущие точки усилия (пузыри и плотности).
---
## Почему именно эти элементы
* **VWAP** показывает, где сосредоточена стоимость; цена либо вращается вокруг него, либо быстро уходит — идеальный ориентир скальпера.
* **Opening Range** фиксирует ранний аукцион — от его границ часто начинаются пробои, возвраты и ретесты.
* **EMA + ADX** отделяют тренд от «пилы», позволяя оставлять на графике только зоны по направлению старшего таймфрейма.
* **Зоны от пивотов** просты, объективны и быстры; средняя линия помогает подтверждать разворот, счетчик касаний переводит субъективность в цифры.
* **Пузыри и плотности** добавляют слой «усилия»: где именно возник толчок и где сконцентрирована ликвидность.
Комбинация **контекста + уровня + усилия** уменьшает двусмысленность и ускоряет принятие решения.
---
## Как это работает (простыми словами)
* **VWAP** каждый день стартует заново: сумма «типичной цены × объем» делится на суммарный объем.
* **Opening Range** — автоматический (кратный минутам вашего таймфрейма) или вручную заданный период; пока он формируется, фиксируются максимум и минимум.
* **Фильтр тренда**
* Две экспоненциальные средние задают направление.
* **ADX** (по желанию) добавляет «силу». Источник можно взять со старшего таймфрейма.
* **Зоны**
* Одновременно работает **две пары** пивотов (например 10-лево 10-право и 5-лево 5-право).
* От пивота строится зона **предложения** (от максимума) или **спроса** (от минимума). Глубина зоны = **коэффициент × Average True Range**; зона тянется вперед.
* Внутри рисуется **средняя линия** (по желанию).
* Режим **«только по тренду»** скрывает зоны против старшего направления.
* **Счетчик касаний** увеличивается, когда цена снова входит в зону; подпись показывает пару и количество касаний.
* **Пузыри**
* Используется безопасный **прокси-дельты** — измерение «напряжения» внутри свечи.
* Через **квантильный фильтр** выводятся только необычно сильные места: настраиваются окно и процент квантиля; размер кружка — сила, цвет: зеленый покупатели, красный продавцы.
* **Плотности**
* Крупные активности отмечаются **ненавязчивыми прямоугольниками** (глубина — доля Average True Range).
* Если плотность **пробивается** объемом выше среднего, она **исчезает** — часто это предвещает продолжение.
---
## Как пользоваться — практические схемы
> Рекомендация: крипто или фьючерсы, таймфрейм 1–5 минут. Для старшего фильтра удобно взять **1 час** или **15 минут**.
### 1) Скальп на откат по тренду
1. Включите **«только по тренду»**.
2. В восходящем тренде дождитесь отката в **зону спроса**, желательно рядом с **VWAP** или серединой **Opening Range**.
3. Подтверждение — **зеленые пузыри** у нижней границы зоны или свежая **плотность** под ценой.
4. Вход после закрытия свечи **выше средней линии** зоны.
5. Стоп-лосс: за нижнюю границу зоны или небольшой множитель Average True Range.
6. Цели: предыдущий максимум, верх Opening Range, фиксированные R-множители, либо VWAP.
Для нисходящего тренда зеркально: зоны предложения, красные пузыри и плотности над ценой.
### 2) Контрдвижение с «выбиванием ликвидности»
1. Нейтральный или контртрендовый режим.
2. Цена **выносит хвостом** границу зоны (или линию Opening Range) и **закрывается обратно внутри**.
3. Цвет пузыря часто меняется (поглощение).
4. Вход внутрь зоны; стоп — за хвост выбивания; цели: средняя линия, противоположная граница зоны или VWAP.
### 3) Пробой Opening Range + ретест
1. Дождитесь завершения диапазона.
2. Сильный пробой с крупным пузырем — признак намерения.
3. Ищите **ретест** в зоне по тренду рядом с линией диапазона и VWAP.
4. Торгуйте продолжение к следующей зоне.
### 4) Продолжение после «съеденной» плотности
1. Когда прямоугольник плотности **исчезает** на повышенном объеме, это значит, что ликвидность поглощена.
2. Торгуйте в сторону пробоя к ближайшей противоположной зоне.
---
## Настройки — краткая шпаргалка
**Core**
— Длина Average True Range (для размеров зон и плотностей).
— Включение VWAP и Opening Range.
— Длина Opening Range: автоматическая (кратная минутам ТФ) или ручная.
**Trend Filter**
— Режим: выкл., только средние, либо средние + ADX.
— Источник со старшего таймфрейма и его значение.
— Длины средних, длина ADX и порог силы.
— Показать/скрыть линий средних.
**Zones (две пары одновременно)**
— Пара A: лев/прав; Пара B: лев/прав.
— Глубина зоны × Average True Range, продление по барам.
— Средняя линия, режим **«только по тренду»**.
— Подписи со счетчиком касаний.
**Bubbles**
— Вкл./выкл., окно поиска и процент квантиля (чем выше процент — тем реже пузыри).
**Densities**
— Метрика: абсолютная прокси-дельты или чистый объем.
— Окно/квантиль, глубина × Average True Range, продление,
— Порог объединения (в Average True Range),
— Условие «разъедания» по объему,
— Средняя линия плотности (по желанию).
---
## Советы и риски
* Индикатор **не использует внешние потоки ордер-флоу**. Дельта — **прокси**, подходящая для TradingView; подбирайте квантили под инструмент и таймфрейм.
* Не торгуйте каждый пузырь. Склейте **контекст (тренд + VWAP + Opening Range)** с **уровнем (зона)** и **усилием (пузырь/плотность)**.
* Стоп-лосс — за границей зоны или по Average True Range. Риск на сделку задавайте заранее.
* Перед реальными деньгами протестируйте правила в стратегии.
* Разные рынки ведут себя по-разному; настройки из Биткоина могут не подойти малоликвидным альткоинам или акциям.
* Это не инвестиционная рекомендация. Скальпинг — высокий риск; проскальзывание и переизбыток сделок быстро наносят ущерб капиталу.
---
## Чем уникален PRO Scalper
* Две **одновременные** системы зон показывают и **крупную структуру**, и **точные локальные уровни**.
* Режим **«только по тренду»** чистит экран от лишних уровней и ускоряет решение.
* **Счетчики касаний** дают количественную опору.
* **Самодостаточные визуализации усилия** (пузыри и плотности) — без сторонних источников данных.
* Аккуратная цветовая схема: плотности — мягко, зоны — ясно; Opening Range — адаптивный.
Пусть он станет вашей «картой местности» для быстрых и дисциплинированных решений внутри дня.

Tick-Based Delta Volume BubblesTICK-BASED DELTA VOLUME BUBBLES
OVERVIEW
A real-time order flow indicator that displays volume delta at the tick level, helping traders identify buying and selling pressure as it develops during live market hours. Unlike traditional volume delta indicators that rely on bar close data, this indicator captures actual tick-by-tick volume changes and directional bias, providing granular insight into market dynamics.
HOW IT WORKS
The indicator monitors live tick data during real-time trading by tracking volume increases between consecutive price updates. Each time volume increments, the script calculates the volume delta, determines price direction, assigns directional bias to the volume, and accumulates net delta for each bar.
This methodology is identical to the tick detection mechanism used in professional cumulative volume delta tools, ensuring accuracy and reliability.
FEATURES
Real-Time Tick Detection
- Captures genuine tick-by-tick volume flow using varip persistence
- Not estimated from OHLC data
- Processes actual market ticks as they occur
Adaptive Bubble Sizing
- Bubbles scale based on delta strength relative to a customizable moving average (default 20 bars)
- Highlights significant order flow imbalances
- Five size levels from tiny to huge
Dual Display Modes
- Normal Mode: Sized bubbles with optional volume labels positioned at bar midpoint
- Minimal Mode: Clean dots above/below bars for unobtrusive delta visualization
Flow Classification
- Aggressive Buy (bright green): Strong positive delta with greater than 1.2x strength
- Aggressive Sell (bright red): Strong negative delta with greater than 1.2x strength
- Passive Buy (light green): Moderate positive delta
- Passive Sell (light red): Moderate negative delta
Intensity Mode (Optional)
- Gray: Low intensity (less than 0.5x average)
- Blue: Medium intensity (0.5-1.0x average)
- Orange: High intensity (1.0-2.0x average)
- Red: Extreme intensity (greater than 2.0x average)
Smart Filtering
- Percentile-based filters (customizable) ensure only significant delta events are displayed
- Reduces chart clutter while highlighting important order flow
- Separate thresholds for bubble display and numeric labels
Data Collection Status
- Optional progress box in top-right corner
- Shows real-time bar collection progress
- Displays percentage completion and bars remaining
- Automatically hides when sufficient data is collected
Hide Until Ready Option
- Suppresses bubble display until the averaging period is complete
- Prevents misleading signals from incomplete data
- Default requires 20 bars before displaying bubbles
SETTINGS
Delta Average Length (1-200, default 20)
- Lookback period for calculating delta strength baseline
- Higher values = longer-term delta comparison
- Lower values = more sensitive to recent changes
Hide Bubbles Until Enough Data
- Prevents display until averaging period completes
- Ensures reliable delta strength calculations
Show Data Collection Status Box
- Displays progress indicator during initialization
- Can be disabled if you understand the warmup period
Minimal Mode
- Switches to simple dot display above/below bars
- Green dots above bars = positive delta
- Red dots below bars = negative delta
- Maintains color intensity or flow type classification
Show Bubbles
- Master toggle for bubble display
Bubble Volume Percentile (0-100, default 60)
- Minimum percentile rank required to display bubble
- Higher values = fewer, more significant bubbles
- Lower values = more bubbles displayed
Show Numbers in Bubbles
- Toggle delta value labels
- Only appears in normal mode
- Disabled automatically in minimal mode
Label Volume Percentile (0-100, default 90)
- Higher threshold for displaying numeric labels
- Typically set higher than bubble percentile
- Reduces label clutter on chart
Intensity Mode
- Switch from flow-type coloring to magnitude-based coloring
- Useful for identifying volume spikes regardless of direction
IMPORTANT NOTES
Real-Time Only: This indicator processes live tick data and does not provide historical analysis. It begins collecting data when added to a live chart.
Volume Required: Symbol must have volume data available. Will not function on symbols without volume (most forex pairs from retail brokers).
Initialization Period: Requires the specified number of bars (default 20) to calculate accurate delta strength. Use the "Hide Until Ready" option to prevent premature signals.
Market Hours: Only collects data during live market hours. Does not backfill historical data.
CREDITS
Tick detection methodology inspired by the Kioseff Trading Tick CVD indicator. This implementation adapts the same core tick-level volume delta calculation for bubble-style visualization and per-bar delta analysis.

Dobrusky Volume PulseWhat it does & who it’s for
Volume Pulse is a lightweight, customizable volume profile overlay that shows traders how volume is distributed across price levels over a chosen lookback window. Unlike standard profiles, it also maps cumulative buy/sell pressure at each level, so you see not just where volume clustered, but which side dominated.
Core ideas
Cumulative volume by price: Builds a horizontal profile of traded volume at each level, based on user-defined depth and resolution.
Directional pressure mapping: At every price level, the script accumulates bullish vs. bearish volume based on candle closes vs. opens, providing a directional read on whether buyers or sellers had the upper hand.
POC: Automatically highlights the Point of Control (POC) — the level with the most activity.
Customizable presentation: Adjustable profile resolution, bar width, offset, colors, and whether to show cumulative, directional, or both.
How the components work together
The profile provides the “where,” while the buy/sell mapping adds the “who.” By combining these, traders can see whether a high-volume node was buyer-driven absorption or seller-driven distribution — a distinction classic profiles don’t reveal. This directional overlay reduces the guesswork of interpreting raw volume clusters.
How to use
Apply the overlay to your chart.
Watch the POC and areas of significant increase or decrease in volume (and pressure) as natural magnets or rejection areas.
When trading intraday, I've found that higher timeframe volume levels act as strong magnets. In the chart, you can see the volume levels I've drawn on the SPY daily chart. These levels are targets I use when trading the 5-minute chart.
Pay attention to color dominance at those zones — green-heavy nodes suggest buyer control; red-heavy nodes suggest seller control.
Combine with time-based volume tools and price-action for a more comprehensive trade plan.
Settings overview
Lookback depth: Number of bars used for profile calculation.
Profile resolution: Number of horizontal bars to split volume across price.
Bar style: Width, offset, and multiplier for scaling.
Toggle layers: Choose cumulative, directional, or both.
POC display: Optional highlight of the most traded level.
Limitations & best practices
This is a contextual overlay, not a trade-signal system.
Works best on liquid instruments (indices, futures, major stocks, liquid crypto) where volume distribution is meaningful.
Directional mapping uses candle body bias (close vs. open), not raw order flow. For full tape analysis, pair with actual order flow data.
Originality justification
Dual profile: combines cumulative volume-by-price and buyer/seller pressure per bin (close vs. open) — not a standard VP clone.
From-scratch binning + POC in a single pass for speed; no reused libraries.
Flexible display (cumulative / directional / both) with independent resolution, width, and offset for intraday or HTF use.
Clear visuals (optional POC, balanced node coloring) and open-source code so traders can audit and extend.

Order Flow RSI - Price / CVD / OIOrder Flow RSI blends three powerful market perspectives — Price , Cumulative Volume Delta (CVD) , and Open Interest (OI) — into one unified RSI-style oscillator.
It reveals momentum and imbalance across these data streams and highlights situations where participation, liquidity, and positioning disagree — moments that often precede reversals.
What it does
The indicator converts:
Price → RSI (classic momentum),
CVD → RSI (buy/sell pressure balance),
OI → RSI (position expansion/contraction)
…then plots all three RSIs together on the same 0–100 scale.
A fourth Consensus RSI (average of any two or all three) can optionally be shown to simplify the view.
Core logic
CVD engine – based on TradingView’s native volume-delta request.
Modes: Continuous (default, smooth line), Anchored (resets each session), Rolling window.
Open Interest – pulled automatically from the symbol’s “_OI” feed; aligns to chart timeframe for real-time flow.
RSI calculation – standard RSI applied to each data stream, optionally smoothed (SMA / EMA / RMA / WMA / VWMA).
Signals – optional background highlights when:
All three RSIs are overbought (red) or oversold (green), or
Any pair show opposite extremes (e.g., price overbought + OI oversold).
Consensus RSI – arithmetic mean of the selected RSIs, summarizing overall market tone.
Inputs overview
CVD settings: anchor period, lower-TF delta, mode, rolling length
RSI lengths: separate for price, CVD, OI
Smoothing: type + period applied to all RSIs at once
Consensus: choose which RSIs to average
Signals: enable/disable each combination; optional alerts
Levels: adjustable OB/MID/OS (default 70 / 50 / 30)
Visuals: fill between active RSIs, background highlights, level lines, colors in Style tab
How to read it
All 3 overbought (red): broad exhaustion → possible correction
All 3 oversold (green): broad depletion → possible bounce
Opposite pairs: divergence between price and participation
Price↑ but OI↓ (red) → weak rally, fading participation
Price↓ but CVD↑ (green) → hidden accumulation
Combine with structure and volume profile for confirmation.
Notes
Works best on assets with full CVD + OI data (futures, BTC, etc.).
Use Continuous CVD for smooth RSI, Anchored for session analysis.
Smoothing 2–5 EMA is a good starting point to reduce noise.
All styling (colors, line types, thickness) is adjustable in the Style tab.
Limitations & caveats
CVD requires accurate tick/volume/delta data from your data feed. Performance may differ across instruments.
OI availability varies by exchange / symbol. Where OI is absent, pairwise OI signals are not evaluated.
This indicator is a tool — it generates signals of interest, not guaranteed profitable trades. Backtest and combine with your risk rules.
Smoothing introduces lag; longer smoothing reduces noise but delays signals.
Order Flow RSI bridges traditional momentum analysis and order-flow context — giving a multi-dimensional view of when markets are truly stretched or quietly reloading.
Sometimes it works, sometimes it doesn't.

Cumulative Volume Delta Z Score [BackQuant]Cumulative Volume Delta Z Score
The Cumulative Volume Delta Z Score indicator is a sophisticated tool that combines the cumulative volume delta (CVD) with Z-Score normalization to provide traders with a clearer view of market dynamics. By analyzing volume imbalances and standardizing them through a Z-Score, this tool helps identify significant price movements and market trends while filtering out noise.
Core Concept of Cumulative Volume Delta (CVD)
Cumulative Volume Delta (CVD) is a popular indicator that tracks the net difference between buying and selling volume over time. CVD helps traders understand whether buying or selling pressure is dominating the market. Positive CVD signals buying pressure, while negative CVD indicates selling pressure.
The addition of Z-Score normalization to CVD makes it easier to evaluate whether current volume imbalances are unusual compared to past behavior. Z-Score helps in detecting extreme conditions by showing how far the current CVD is from its historical mean in terms of standard deviations.
Key Features
Cumulative Volume Delta (CVD): Tracks the net buying vs. selling volume, allowing traders to gauge the overall market sentiment.
Z-Score Normalization: Converts CVD into a standardized value to highlight extreme movements in volume that are statistically significant.
Divergence Detection: The indicator can spot bullish and bearish divergences between price and CVD, which can signal potential trend reversals.
Pivot-Based Divergence: Identifies price and CVD pivots, highlighting divergence patterns that are crucial for predicting price changes.
Trend Analysis: Colors bars according to trend direction, providing a visual indication of bullish or bearish conditions based on Z-Score.
How It Works
Cumulative Volume Delta (CVD): The CVD is calculated by summing the difference between buying and selling volume for each bar. It represents the net buying or selling pressure, giving insights into market sentiment.
Z-Score Normalization: The Z-Score is applied to the CVD to normalize its values, making it easier to compare current conditions with historical averages. A Z-Score greater than 0 indicates a bullish market, while a Z-Score less than 0 signals a bearish market.
Divergence Detection: The indicator detects regular and hidden bullish and bearish divergences between price and CVD. These divergences often precede trend reversals, offering traders a potential entry point.
Pivot-Based Analysis: The indicator uses pivot highs and lows in both price and CVD to identify divergence patterns. A bullish divergence occurs when price makes a lower low, but CVD fails to follow, suggesting weakening selling pressure. Conversely, a bearish divergence happens when price makes a higher high, but CVD doesn't confirm the move, indicating potential selling pressure.
Trend Coloring: The bars are colored based on the trend direction. Green bars indicate an uptrend (CVD is positive), and red bars indicate a downtrend (CVD is negative). This provides an easy-to-read visualization of market conditions.
Standard Deviation Levels: The indicator plots ±1σ, ±2σ, and ±3σ levels to indicate the degree of deviation from the average CVD. These levels act as thresholds for identifying extreme buying or selling pressure.
Customization Options
Anchor Timeframe: The user can define an anchor timeframe to aggregate the CVD, which can be customized based on the trader’s needs (e.g., daily, weekly, custom lower timeframes).
Z-Score Period: The period for calculating the Z-Score can be adjusted, allowing traders to fine-tune the indicator's sensitivity.
Divergence Detection: The tool offers controls to enable or disable divergence detection, with the ability to adjust the lookback periods for pivot detection.
Trend Coloring and Visuals: Traders can choose whether to color bars based on trend direction, display standard deviation levels, or visualize the data as a histogram or line plot.
Display Options: The indicator also allows for various display options, including showing the Z-Score values and divergence signals, with customizable colors and line widths.
Alerts and Signals
The Cumulative Volume Delta Z Score comes with pre-configured alert conditions for:
Z-Score Crossovers: Alerts are triggered when the Z-Score crosses the 0 line, indicating a potential trend reversal.
Shifting Trend: Alerts for when the Z-Score shifts direction, signaling a change in market sentiment.
Divergence Detection: Alerts for both regular and hidden bullish and bearish divergences, offering potential reversal signals.
Extreme Imbalances: Alerts when the Z-Score reaches extreme positive or negative levels, indicating overbought or oversold market conditions.
Applications in Trading
Trend Identification: Use the Z-Score to confirm bullish or bearish trends based on cumulative volume data, filtering out noise and false signals.
Reversal Signals: Divergences between price and CVD can help identify potential trend reversals, making it a powerful tool for swing traders.
Volume-Based Confirmation: The Z-Score allows traders to confirm price movements with volume data, providing more reliable signals compared to price action alone.
Divergence Strategy: Use the divergence signals to identify potential points of entry, particularly when regular or hidden divergences appear.
Volatility and Market Sentiment: The Z-Score provides insights into market volatility by measuring the deviation of CVD from its historical mean, helping to predict price movement strength.
The Cumulative Volume Delta Z Score is a powerful tool that combines volume analysis with statistical normalization. By focusing on volume imbalances and applying Z-Score normalization, this indicator provides clear, reliable signals for trend identification and potential reversals. It is especially useful for filtering out market noise and ensuring that trades are based on significant price movements driven by substantial volume changes.
This indicator is perfect for traders looking to add volume-based analysis to their strategy, offering a more robust and accurate way to gauge market sentiment and trend strength.

Ghost BookGhost Book is an indicator that visualizes the distribution of bid and ask amount — the activity of buyers and sellers — in the form of a synthetic order book.
While a real order book shows active limit orders, Ghost Book displays the most recent n ticks (controlled by the input Max rows count in book).
For each tick, the indicator shows:
Price
Amount
Total trade value
Trade side (buyer or seller)
Relative weight of the tick by its amount
The center row displays the current closing price as a reference point between buyers and sellers.
Note: This indicator uses tick-level data. If your TradingView subscription level does not include tick data, the indicator will not function correctly.

Volume Delta [BigBeluga]🔵 OVERVIEW
The Volume Delta indicator visualizes the dominance between buying and selling volume within a given period. It calculates the percentage of bullish (buy) versus bearish (sell) volume, then color-codes the candles and provides a real-time dashboard comparing delta values across multiple currency pairs. This makes it a powerful tool for monitoring order-flow strength and intermarket relationships in real time.
🔵 CONCEPTS
Each bar’s buy volume is counted when the close is higher than the open.
Each bar’s sell volume is counted when the close is lower than the open.
volumeBuy = 0.
volumeSell = 0.
for i = 0 to period
if close > open
volumeBuy += volume
else
volumeSell += volume
The indicator sums both over a chosen period to calculate the ratio of buy-to-sell pressure.
Delta (%) = (Buy Volume ÷ (Buy Volume + Sell Volume)) × 100.
Gradient colors highlight whether buying or selling pressure dominates.
🔵 FEATURES
Calculates real-time Volume Delta for the selected chart or for multiple assets.
Colors candles dynamically based on the delta intensity (green = buy pressure, red = sell pressure).
Displays a dashboard table showing volume delta % for up to five instruments.
The dashboard features visual progress bars for quick intermarket comparison.
An optional Delta Bar Panel shows the ratio of Buy/Sell volumes near the latest bar.
A floating label shows the exact Buy/Sell percentages.
Works across all symbols and timeframes for multi-asset delta tracking.
🔵 HOW TO USE
When Buy % > Sell % , it often signals bullish momentum or strong accumulation—but can also indicate over-excitement and a possible market top.
Market Tops
When Sell % > Buy % , it typically reflects bearish pressure or distribution—but may also occur near a market bottom where selling exhaustion forms.
Market Bottom
Use the Dashboard to compare volume flow across correlated assets (e.g., major Forex pairs or sector groups).
Combine readings with trend or volatility filters to confirm whether the imbalance aligns with broader directional conviction.
Treat the Delta Bar visualization as a real-time sentiment gauge—showing which side (buyers or sellers) dominates the current session.
🔵 CONCLUSION
Volume Delta transforms volume analysis into an intuitive directional signal.
By quantifying buy/sell pressure and displaying it as a percentage or color gradient, it provides traders with a clearer picture of real-time volume imbalance — whether within one market or across multiple correlated instruments.

Cumulative Volume Delta Profile and Heatmap [BackQuant]Cumulative Volume Delta Profile and Heatmap
A multi-view CVD workstation that measures buying vs selling pressure, renders a price-aligned CVD profile with Point of Control, paints an optional heatmap of delta intensity, and detects classical CVD divergences using pivot logic. Built for reading who is in control, where participation clustered, and when effort is failing to produce result.
What is CVD
Cumulative Volume Delta accumulates the difference between aggressive buys and aggressive sells over time. When CVD rises, buyers are lifting the offer more than sellers are hitting the bid. When CVD falls, the opposite is true. Plotting CVD alongside price helps you judge whether price moves are supported by real participation or are running on fumes.
Core Features
Visual Analysis Components
CVD Columns - Plot of cumulative delta, colored by side, for quick read of participation bias.
CVD Profile - Price-aligned histogram of CVD accumulation using user-set bins. Shows where net initiative clustered.
Split Buy and Sell CVD - Optional two-sided profile that separates positive and negative CVD into distinct wings.
POC - Point of Control - The price level with the highest absolute CVD accumulation, labeled and line-marked.
Heatmap - Semi-transparent blocks behind price that encode CVD intensity across the last N bars.
Divergence Engine - Pivot-based detection of Bearish and Bullish CVD divergences with optional lines and labels.
Stats Panel - Top level metrics: Total CVD, Buy and Sell totals with percentages, Delta Ratio, and current POC price.
How it works
Delta source and sampling
You select an Anchor Timeframe that defines the higher time aggregation for reading the trend of CVD.
The script pulls lower timeframe volume delta and aggregates it to the anchor window. You can let it auto-select the lower timeframe or force a custom one.
CVD is then accumulated bar by bar to form a running total. This plot shows the direction and persistence of initiative.
Profile construction
The recent price range is split into Profile Granularity bins.
As price traverses a bin, the current delta contribution is added to that bin.
If Split Buy and Sell CVD is enabled, positive CVD goes to the right wing and negative CVD to the left wing.
Widths are scaled by each side’s maximum so you can compare distribution shape at a glance.
The Point of Control is the bin with the highest absolute CVD. This marks where initiative concentrated the most.
Heatmap
For each bin, the script computes intensity as absolute CVD relative to the maximum bin value.
Color is derived from the side in control in that bin and shaded by intensity.
Heatmap Length sets how far back the panels extend, highlighting recurring participation zones.
Divergence model
You define pivot sensitivity with Pivot Left and Right .
Bearish divergence triggers when price confirms a higher high while CVD fails to make a higher high within a configurable Delta Tolerance .
Bullish divergence triggers when price confirms a lower low while CVD fails to make a lower low.
On trigger, optional link lines and labels are drawn at the pivots for immediate context.
Key Settings
Delta Source
Anchor Timeframe - Higher TF for the CVD narrative.
Custom Lower TF and Lower Timeframe - Force the sampling TF if desired.
Pivot Logic
Pivot Left and Right - Bars to each side for swing confirmation.
Delta Tolerance - Small allowance to avoid near-miss false positives.
CVD Profile
Show CVD Profile - Toggle profile rendering.
Split Buy and Sell CVD - Two-sided profile for clearer side attribution.
Show Heatmap - Project intensity panels behind price.
Show POC and POC Color - Mark the dominant CVD node.
Profile Granularity - Number of bins across the visible price range.
Profile Offset and Profile Width - Position and scale the profile.
Profile Position - Right, Left, or Current bar alignment.
Visuals
Bullish Div Color and Bearish Div Color - Colors for divergence artifacts.
Show Divergence Lines and Labels - Visualize pivots and annotations.
Plot CVD - Column plot of total CVD.
Show Statistics and Position - Toggle and place the summary table.
Reading the display
CVD columns
Rising CVD confirms buyers are in control. Falling CVD confirms sellers.
Flat or choppy CVD during wide price moves hints at passive or exhausted participation.
CVD profile wings
Thick right wing near a price zone implies heavy buy initiative accumulated there.
Thick left wing implies heavy sell initiative.
POC marks the strongest initiative node. Expect reactions on first touch and rotations around this level when the tape is balanced.
Heatmap
Brighter blocks indicate stronger historical net initiative at that price.
Stacked bright bands form CVD high volume nodes. These often behave like magnets or shelves for future trade.
Divergences
Bearish - Price prints a higher high while CVD fails to do so. Effort is not producing result. Potential fade or pause.
Bullish - Price prints a lower low while CVD fails to do so. Capitulation lacks initiative. Potential bounce or reversal.
Stats panel
Total CVD - Net initiative over the window.
Buy and Sell volume with percentages - Side composition.
Delta Ratio - Buy over Sell. Values above 1 favor buyers, below 1 favor sellers.
POC Price - Current control node for plan and risk.
Workflows
Trend following
Choose an Anchor Timeframe that matches your holding period.
Trade in the direction of CVD slope while price holds above a bullish POC or below a bearish POC.
Use pullbacks to CVD nodes on your profile as entry locations.
Trend weakens when price makes new highs but CVD stalls, or new lows while CVD recovers.
Mean reversion
Look for divergences at or near prior CVD nodes, especially the POC.
Fade tests into thick wings when the side that dominated there now fails to push CVD further.
Target rotations back toward the POC or the opposite wing edge.
Liquidity and execution map
Treat strong wings and heatmap bands as probable passive interest zones.
Expect pauses, partial fills, or flips at these shelves.
Stops make sense beyond the far edge of the active wing supporting your idea.
Alerts included
CVD Bearish Divergence and CVD Bullish Divergence.
Price Cross Above POC and Price Cross Below POC.
Extreme Buy Imbalance and Extreme Sell Imbalance from Delta Ratio.
CVD Turn Bullish and CVD Turn Bearish when net CVD crosses zero.
Price Near POC proximity alert.
Best practices
Use a higher Anchor Timeframe to stabilize the CVD story and a sensible Profile Granularity so wings are readable without clutter.
Keep Split mode on when you want to separate initiative attribution. Turn it off when you prefer a single net profile.
Tune Pivot Left and Right by instrument to avoid overfitting. Larger values find swing divergences. Smaller values find micro fades.
If volume is thin or synthetic for the symbol, CVD will be less reliable. The script will warn if volume is zero.
Trading applications
Context - Confirm or question breakouts with CVD slope.
Location - Build entries at CVD nodes and POC.
Timing - Use divergence and POC crosses for triggers.
Risk - Place stops beyond the opposite wing or outside the POC shelf.
Important notes and limits
This is a price and volume based study. It does not access off-book or venue-level order flow.
CVD profiles are built from the data available on your chart and the chosen lower timeframe sampling.
Like all volume tools, readings can distort during roll periods, holidays, or feed anomalies. Validate on your instrument.
Technical notes
Delta is aggregated from a lower timeframe into an Anchor Timeframe narrative.
Profile bins update in real time. Splitting by side scales each wing independently so both are readable in the same panel.
Divergences are confirmed using standard pivot definitions with user-set tolerances.
All profile drawing uses fixed X offsets so panels and POC do not swim when you scroll.
Quick start
Anchor Timeframe = Daily for intraday context.
Split Buy and Sell CVD = On.
Profile Granularity = 100 to 200, Profile Position = Right, Width to taste.
Pivot Left and Right around 8 to 12 to start, then adapt.
Turn on Heatmap for a fast map of interest bands.
Bottom line
CVD tells you who is doing the lifting. The profile shows where they did it. Divergences tell you when effort stops paying. Put them together and you get a clear read on control, location, and timing for both trend and mean reversion.

Cumulative Volume DeltaCumulative Volume Delta (CVD) Indicator
This indicator is a modification of the Trading View CVD indicator. Cumulative Volume Delta (CVD), which represents the net difference between up volume (volume traded as the price increases) and down volume (volume traded as the price decreases) over a chosen Anchor Period.
The data for the CVD calculation is requested using the built-in ta.requestVolumeDelta function from a lower timeframe to approximate the directional volume with greater precision. This lower timeframe is either automatically selected based on the chart's timeframe or can be customized by the user.
Key Features and Inputs
Anchor Period: Defines the period over which the volume delta is accumulated and plotted. The default is "1D" (Daily), but it can be changed to any higher timeframe (e.g., "1W" for Weekly) to analyze CVD across different cycles.
CVD Candle Plot: The calculated volume delta values are plotted as a custom candle, where:
The open and close of the CVD candle represent the volume delta at the start and end of the anchor period, respectively.
The high and low represent the maximum and minimum volume delta reached during that period.
Up/Down Coloring Logic: The color of the CVD candle is determined by the directional movement of the price during the anchor period, allowing traders to quickly correlate volume delta with price action. Users can select between two methods via the "Strong Up/Down Coloring" input:
Strong Up/Down (Default): The candle is colored bullish (Teal) if the current price closes above the previous bar's high or bearish (Red) if it closes below the previous bar's low. This logic highlights significant momentum.
Regular Up/Down: The candle is colored bullish (Teal) if the close is greater than the open (price moved up) or bearish (Red) if the close is less than the open (price moved down).
Lower Timeframe Selection: This determines the resolution of the up and down volume components.
By default, the script automatically selects an appropriate lower timeframe (e.g., "1" minute for intraday charts, "5" minutes for daily charts) to balance historical data availability with calculation precision.
An option is provided to customize this "Lower Timeframe" for advanced users seeking higher or lower resolution.
The CVD indicator is a powerful tool for analyzing order flow dynamics and assessing the genuine strength of price movements by comparing the aggregate buying pressure (up volume) against the selling pressure (down volume).
Technical Notes (Code Details)
Language: Pine Script® //@version=6.
Function: Utilizes the ta.requestVolumeDelta() function with a user-defined anchorInput (default "1D") and a determined lowerTimeframe to retrieve the relevant delta data: .
Error Handling: Includes a check to confirm the symbol provides volume data, preventing runtime errors.

Adaptive Volume Delta Map---
📊 Adaptive Volume Delta Map (AVDM)
What is Adaptive Volume Delta Map (AVDM)?
The Adaptive Volume Delta Map (AVDM) is a smart, multi-timeframe indicator that visualizes buy and sell volume imbalances directly on the chart.
It adapts automatically to the best available data resolution (tick, second, minute, or daily), allowing traders to analyze market activity with micro-level precision .
In addition to calculating volume delta (the difference between buying and selling pressure), AVDM can display a Volume Distribution Map — a per-price-level visualization showing how volume is split between buyers and sellers.
Key Features
✅ Adaptive Resolution Selection — Automatically chooses the highest possible data granularity — from tick to daily timeframe.
✅ Volume Delta Visualization — Displays delta candles reflecting the dominance of buyers (green), sellers (red), and delta (orange).
✅ Per-Level Volume Map (optional) — Shows detailed buy/sell volume distribution per price level, grouped by `Ticks Per Row`.
✅ Bid/Ask Classification — When enabled, AVDM uses bid/ask logic to classify trade direction with greater accuracy.
✅ Smart Auto-Disable Protection — Automatically disables volume map if too many price levels (>50) are detected — preventing performance degradation.
Inputs Overview
Use Seconds Resolution — Enables use of second-level data (if your TradingView subscription allows it).
Use Tick Resolution — Enables tick-based analysis for the most detailed view. If available, enable both tick and seconds resolution.
Use Bid/Ask Calculated — Uses bid/ask midpoint logic to classify trades.
Show Volume Distribution — Toggles per-price-level buy/sell volume visualization.
Ticks Per Row — Controls how many ticks are grouped per volume level. Reduce this value for finer detail, or increase it to reduce visual load.
Calculated Bars — Sets how many historical bars the indicator should process. Higher value increases accuracy but may impact performance.
How to Use
1. Add the indicator to your chart.
2. Ensure that your symbol provides volume data (and preferably tick or second-level data).
3. The indicator will automatically select the optimal timeframe for detailed calculation.
4. If your TradingView subscription allows second-level data , enable “Use Seconds Resolution.”
5. If your subscription allows tick-level data , enable both “Use Tick Resolution” and “Use Seconds Resolution.”
6. Adjust the “Calculated Bars” input to set how many historical bars the indicator should process.
7. Observe the Volume Delta Candles :
* Green = Buy pressure dominates
* Red = Sell pressure dominates
8. To see buy/sell clustering by price, enable “Show Volume Distribution.”
9. If the indicator disables the map and shows:
" Volume Distribution disabled: Too many price levels detected (>50). Try decreasing 'Ticks Per Row' or using a lower chart resolution. If you don’t care about the map, just turn off 'Show Volume Distribution'. "
— follow the instructions to reduce chart load.
Notes
* Automatically adapts to your chart’s resolution and data availability.
* If your symbol doesn’t provide volume data, a runtime warning will appear.
* Works best on futures , FX , and crypto instruments with high-frequency volume streams.
Why Traders Love It
AVDM combines adaptive resolution , volume delta analysis , and visual distribution mapping into one clean, efficient tool.
Perfect for traders studying:
* Market microstructure
* Aggressive vs. passive participation
* Volume absorption
* Order flow imbalance zones
* Delta-based divergence signals
Technical Highlights
* Built with Pine Script v6
* Adaptive resolution logic (`security_lower_tf`)
* Smart memory-safe map rendering
* Dynamic bid/ask classification
* Automatic overload protection
---

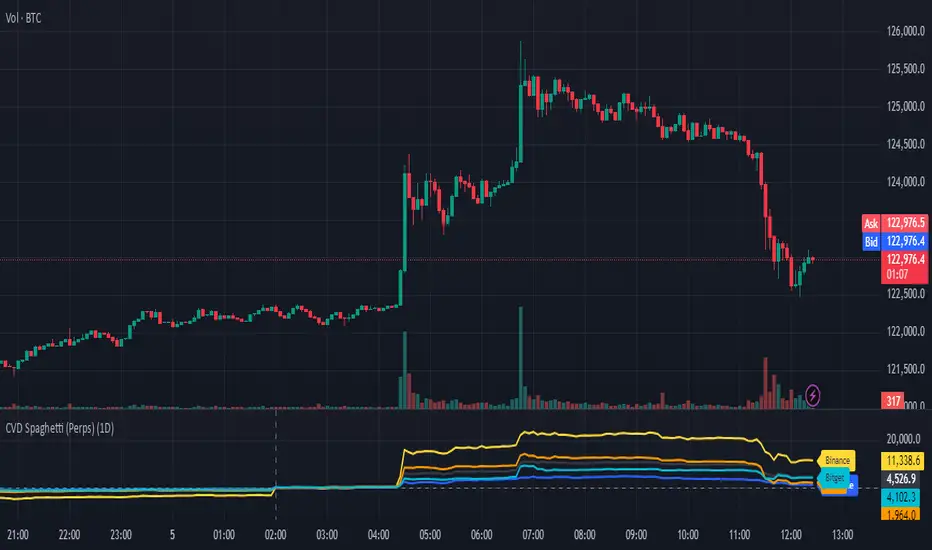
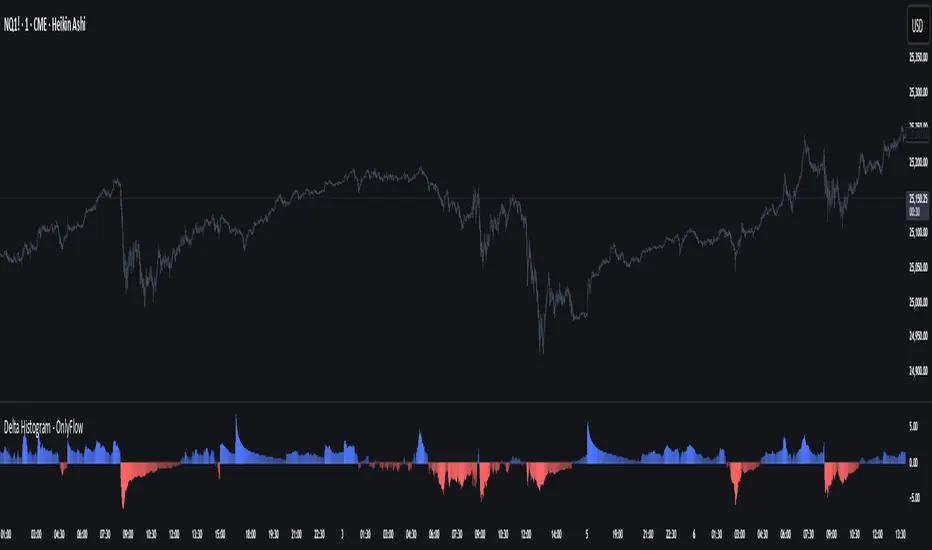
Delta Histogram - OnlyFlowThis script plots a histogram of delta proxies (approximations of buying vs. selling pressure) using available chart data. Because TradingView does not provide bid/ask tape data, delta is estimated with several selectable methods:
Uptick/Down-tick (proxy): volume signed by close direction.
Body-weighted Volume: weights volume by candle body relative to its range.
VWAP-slope Volume: signs volume by changes in the typical price (HLC3).
Features
Cumulative or per-bar mode: reset daily or by custom session hours.
Normalization options: Z-score, percentile scaling, or raw values; with percentile clipping for stable colors and axis scaling.
Visualization: color-coded positive/negative bars, optional zero line and ± bands, adjustable opacity scaling.
Readout Panel: shows the latest delta values and their normalized equivalents on the chart edge.
Alerts: triggers when normalized delta exceeds positive or negative thresholds, highlighting potential spikes in pressure.
Usage
Switch between delta modes to explore different perspectives on order-flow imbalance. Cumulative mode shows whether pressure builds over a session, while per-bar mode highlights bar-to-bar shifts. Normalization helps identify relative extremes in context rather than raw values.
CCI PKTELUGUTRADERThe Commodity Channel Index (CCI) is a momentum oscillator that helps traders identify potential buy and sell opportunities by measuring how far the price of a security deviates from its average price over a specific period. It’s widely used for spotting new trends, overbought and oversold conditions, and possible price reversals in various financial markets.
Description of CCI
The CCI calculates the difference between the current price and its historical average price, normalized by mean deviation. Unlike indicators such as RSI, the CCI is an unbounded oscillator, meaning its values can go above +100 or below -100, providing broader insights into momentum shifts in prices.
The formula for CCI is:
CCI
=
Typical Price
−
SMA of Typical Price
0.015
×
Mean Deviation
CCI=
0.015×Mean Deviation
Typical Price−SMA of Typical Price
where:
Typical Price = (High + Low + Close) / 3
SMA is the Simple Moving Average of the Typical Price over the chosen period
Mean Deviation is the average deviation from the SMA.
Buy and Sell Signals
A buy signal is typically generated when the CCI moves above +100, indicating the start of a strong uptrend.
A sell signal occurs when the CCI drops below -100, signaling a strong downtrend.
Many traders close their buy positions when the CCI falls back below +100 and close their sell positions when it rises above -100, or use price action confirmation to validate signals.
Values above +100 suggest overbought conditions, while below -100 indicate oversold; extreme values (like +200 or -200) suggest even stronger momentum.
CCI divergences (price moves not confirmed by the indicator) may indicate potential reversals.
Summary Table: CCI Signals
CCI Level Market Condition Potential Action
Above +100 Overbought/Uptrend Consider Buying
Below -100 Oversold/Downtrend Consider Selling
Back between -100 and +100 Neutral/Indecision Exit or Wait
The CCI is best used alongside other technical indicators for confirmation, as it can generate false signals during sideways markets.
References:
Guide to Commodity Channel Index
What Is CCI?
CCI Trading Strategies
CCI: Technical Indicator
Commodity channel index

Delta Volume Signals by Claudio [hapharmonic]Modifications:
Percentages without decimals.
I replaced the 'Current Volume' row with two boxes: "Δ Vol" and its value, which changes color depending on the direction of the bearish/bullish candle.
Signals can change color in the settings.
Box spacing so the table doesn't constantly change size.
To be modified:
The Net Volume sign shouldn't change to negative when the candle is red.
If anyone does this, let me know...
claudio.ventola@hotmail.com
Best regards!

Heatmap (Delta/Change) - ORDEROFTWOORDER OF TWO Premium Indicator
This Indicator helps to build an better edge for your overall BIAS.

Ober Trend Oscillator [by Oberlunar]The Ober Trend Oscillator by Oberlunar unifies a volume-weighted view of price with order-flow information in a single, disciplined signal. At its core is a Triple Hull Moving Average applied to the session VWAP. This pairing is intentional: the Hull family is widely used because its quadratic weighting and internal differencing reduce phase lag versus SMA/EMA while preserving a smooth, readable contour; running it on top of VWAP anchors the calculation to a price already “risk-weighted” by volume, which behaves in practice like a microstructural equilibrium level. Around VWAP, the indicator computes standard-deviation envelopes that provide statistical context; excursions to the far band against the prevailing direction often mark probabilistic excess and become the first checkpoint for signal qualification.
The order-flow module is built on a tick-rule Cumulative Volume Delta, the most robust choice when native bid/ask deltas are unavailable. Volumes are signed by up- or down-moves, cumulatively integrated, then smoothed by a configurable EMA. To make the series comparable across instruments and timeframes, the CVD is standardised via an adjustable z-score window. This normalisation matters because it reframes “push” and “exhaustion” as deviations from recent behaviour rather than absolute thresholds tied to each market’s idiosyncratic liquidity. When enabled, a pivot-based divergence engine searches for fresh local highs or lows in price that the CVD refuses to confirm and annotates the symbol Δ with the percentage size of the divergence on price, on CVD, or both. Quantifying divergence avoids binary, eye-ball readings and lets you compare the relative strength of signals over time.
Signal generation follows a two-stage logic. Stage one is regime detection by the THMA on VWAP. The slope of the long THMA defines the primary trend, while the instantaneous difference between the THMA and its own lag sets the “serpentine” colour that conveys the local direction of pressure. Using slope on the longer window is deliberate: trend-following practice shows that slope filters materially reduce false positives in choppy regimes. Stage two enforces contextual alignment between price and higher-timeframe VWAP bands. For a long, the THMA computed on the higher-timeframe VWAP must sit below the current curve and below the second lower deviation, consistent with either a mean-reverting excess or early re-accumulation; shorts are defined symmetrically. Volume-flow confirmation is then required through either a rising CVD, a supportive z-score, or a detected pivot divergence in the same direction. To discourage over-trading, signals alternate by design and a strict colour gate is applied: a green diamond is never printed on a red line and bullish divergences are not drawn when the serpentine indicates bearish pressure. This visual consistency is not cosmetic; it reduces cognitive dissonance between filters and execution signal and improves reading discipline.
Parameters are organised to make these choices explicit. The main THMA length controls the oscillator’s sensitivity to VWAP, while the “trend” and “long-term” lengths drive the slope filter, with the latter acting as the regime anchor. The higher timeframe used to compute THMA on VWAP is the context-alignment knob and enables true multi-period operation, which is essential in fractal markets such as crypto, FX and equity indices. The VWAP deviation multiplier sets the breadth of the statistical bands; values modestly below one are a deliberate default to keep excess detection sensitive without turning the envelopes into a very wide channel. The ATR window that drives the line’s thickness is not a visual gimmick: thickness adapts to volatility and communicates the movement’s energy at a glance, much like an adaptive envelope.
The CVD package offers full control. A dedicated timeframe lets you decouple order-flow estimation from the chart’s timeframe when a slower, more reliable read of pressure is preferred. The calculation mode can reference Close-to-Close for responsiveness or HL2 for slightly greater robustness to closing noise, depending on the instrument’s microstructure. EMA smoothing governs granularity, the slope lookback sets how many observations are required to validate an inflection, and the z-score length defines the statistical horizon for normalisation—longer windows make the signal steadier, shorter windows make it more tactical. The pivot divergence option with percentage sizing grades relevance rather than merely flagging presence. Measuring both the price change between pivots and the CVD change is intentional: the most actionable divergences exhibit not only directionally opposing shapes but also a quantitative mismatch between price and flow; putting the two numbers side by side clarifies whether price is outrunning flow or flow is reversing ahead of price.
On the attached weekly Bitcoin example, the turquoise serpentine highlights impulsive phases while red denotes retracement or distribution. Δ labels with “P:%” and “C:%” mark points where price sets a new extreme without a matching CVD extreme; the percentage annotation helps distinguish a trivial imbalance from a credible exhaustion. Diamonds appear only when their colour agrees with the serpentine, and their location relative to the higher-TF VWAP bands clarifies when the market stops pushing “with volume” and starts pushing “against volume”—often the operational cue that precedes mean reversion or a consolidation before the next impulse.
Three methodological choices deserve emphasis. The THMA-on-VWAP architecture addresses the classic lag-versus-noise trade-off by combining a low-lag smoother with a volume-anchored base series that reflects institutional execution practice. Z-scoring the CVD is consistent with a statistical reading of flow that reasons in deviations from expected behaviour rather than fixed thresholds, which is particularly relevant on assets with shifting liquidity regimes. Finally, the colour gate plus signal alternation mitigates the well-known clustering of false positives in sideways markets: you do not print green on red or red on green, and you do not fire the same direction twice in a row without an opposite transition, which avoids hammering into the same move.
Practical usage is straightforward. Select your trading timeframe and align context with a higher timeframe in the VWAP-THMA; tune the VWAP deviation multiplier to match the instrument’s excess profile; choose an equal or slower CVD timeframe to extract structural pressure; enable divergence sizing when you want to measure, not only see, the gap between price and flow. Signals can also be drawn on the main chart, so next to candles, you will see both the execution diamonds and Δ labels with their percentage sizes. If you work with higher-timeframe inputs via `request.security`, be aware that those series confirm only at their own close; you can require confirmation for both the higher-TF VWAP and CVD timeframes to eliminate any practical repaint. Integrated alerts tied to THMA+VWAP+CVD validation convert discretionary reading into a monitorable workflow consistent with systematic routines.
Known limitations are stated explicitly. Tick-rule CVD is an approximation and, while standard in the absence of native bid/ask deltas, it may diverge from “true” delta on venues with unusual execution dynamics; normalisation helps but does not eliminate this. Pivot divergences depend on swing definition and require sensitivity calibration to avoid over-signalling on erratic markets. By construction, the oscillator favours trending contexts with statistically motivated pullbacks; during prolonged congestion, signals will naturally thin out, and the standardised CVD becomes the primary discriminator.
In sum, the Ober Trend Oscillator is a dual-channel reader: the THMA-on-VWAP line tells you about regime and movement quality, and the normalised CVD tells you about the pressure sustaining that movement. When the two stories align, continuation probability improves; when they diverge, the Δ annotation quantifies the gap and offers an objective basis for judging whether you are seeing a healthy pause or an impending reversal. The integration of volume-weighted price, simple statistics, and order-flow makes the indicator genuinely multi-period, capable of scaling from intraday to swing without changing its visual language or its decision criteria.
Oberlunar 👁️⭐

Volume Bubbles & Liquidity Heatmap [LuxAlgo]The Volume Bubbles & Liquidity Heatmap indicator highlights volume and liquidity clearly and precisely with its volume bubbles and liquidity heat map, allowing to identify key price areas.
Customize the bubbles with different time frames and different display modes: total volume, buy and sell volume, or delta volume.
🔶 USAGE
The primary objective of this tool is to offer traders a straightforward method for analyzing volume on any selected timeframe.
By default, the tool displays buy and sell volume bubbles for the daily timeframe over the last 2,000 bars. Traders should be aware of the difference between the timeframe of the chart and that of the bubbles.
The tool also displays a liquidity heat map to help traders identify price areas where liquidity accumulates or is lacking.
🔹 Volume Bubbles
The bubbles have three possible display modes:
Total Volume: Displays the total volume of trades per bubble.
Buy & Sell Volume: Each bubble is divided into buy and sell volume.
Delta Volume: Displays the difference between buy and sell volume.
Each bubble represents the trading volume for a given period. By default, the timeframe for each bubble is set to daily, meaning each bubble represents the trading volume for each day.
The size of each bubble is proportional to the volume traded; a larger bubble indicates greater volume, while a smaller bubble indicates lower volume.
The color of each bubble indicates the dominant volume: green for buy volume and red for sell volume.
One of the tool's main goals is to facilitate simple, clear, multi-timeframe volume analysis.
The previous chart shows Delta Volume bubbles with various chart and bubble timeframe configurations.
To correctly visualize the bubbles, traders must ensure there is a sufficient number of bars per bubble. This is achieved by using a lower chart timeframe and a higher bubble timeframe.
As can be seen in the image above, the greater the difference between the chart and bubble timeframes, the better the visualization.
🔹 Liquidity Heatmap
The other main element of the tool is the liquidity heatmap. By default, it divides the chart into 25 different price areas and displays the accumulated trading volume on each.
The image above shows a 4-hour BTC chart displaying only the liquidity heatmap. Traders should be aware of these key price areas and observe how the price behaves in them, looking for possible opportunities to engage with the market.
The main parameters for controlling the heatmap on the settings panel are Rows and Cell Minimum Size. Rows modifies the number of horizontal price areas displayed, while Cell Minimum Size modifies the minimum size of each liquidity cell in each row.
As can be seen in the above BTC hourly chart, the cell size is 24 at the top and 168 at the bottom. The cells are smaller on top and bigger on the bottom.
The color of each cell reflects the liquidity size with a gradient; this reflects the total volume traded within each cell. The default colors are:
Red: larger liquidity
Yellow: medium liquidity
Blue: lower liquidity
🔹 Using Both Tools Together
This indicator provides the means to identify directional bias and market timing.
The main idea is that if buyers are strong, prices are likely to increase, and if sellers are strong, prices are likely to decrease. This gives us a directional bias for opening long or short positions. Then, we combine our directional bias with price rejection or acceptance of key liquidity levels to determine the timing of opening or closing our positions.
Now, let's review some charts.
This first chart is BTC 1H with Delta Weekly Bubbles. Delta Bubbles measure the difference between buy and sell volume, so we can easily see which group is dominant (buyers or sellers) and how strong they are in any given week. This, along with the key price areas displayed by the Liquidity Heatmap, can help us navigate the markets.
We divided market behavior into seven groups, and each group has several bubbles, numbered from 1 to 17.
Bubbles 1, 2, and 3: After strong buyers market consolidates with positive delta, prices move up next week.
Bubbles 3, 4, and 5: Strength changes from buyers to sellers. Next week, prices go down.
Bubbles 6 and 7: The market trades at higher prices, but with negative delta. Next week, prices go down.
Bubbles 7, 8, and 9: Strength changes from sellers to buyers. Next weeks (9 and 10), prices go up.
Bubbles 10, 11, and 12: After strong buyers prices trade higher with a negative delta. Next weeks (12 and 13) prices go down.
Bubbles 12, 14, and 15: Strength changes from sellers to buyers; next week, prices increase.
Bubbles 15 and 16: The market trades higher with a very small positive delta; next week, prices go down.
Current bubble/week 17 is not yet finished. Right now, it is trading lower, but with a smaller negative delta than last week. This may signal that sellers are losing strength and that a potential reversal will follow, with prices trading higher.
This is the same BTC 1H chart, but with price rejections from key liquidity areas acting as strong price barriers.
When prices reach a key area with strong liquidity and are rejected, it signals a good time to take action.
By observing price behavior at certain key price levels, we can improve our timing for entering or exiting the markets.
🔶 DETAILS
🔹 Bubbles Display
From the settings panel, traders can configure the bubbles with four main parameters: Mode, Timeframe, Size%, and Shape.
The image above shows five-minute BTC charts with execution over the last 3,500 bars, different display modes, a daily timeframe, 100% size, and shape one.
The Size % parameter controls the overall size of the bubbles, while the Shape parameter controls their vertical growth.
Since the chart has two scales, one for time and one for price, traders can use the Shape parameter to make the bubbles round.
The chart above shows the same bubbles with different size and shape parameters.
You can also customize data labels and timeframe separators from the settings panel.
🔶 SETTINGS
Execute on last X bars: Number of bars for indicator execution
🔹 Bubbles
Display Bubbles: Enable/Disable volume bubbles.
Bubble Mode: Select from the following options: total volume, buy and sell volume, or the delta between buy and sell volume.
Bubble Timeframe: Select the timeframe for which the bubbles will be displayed.
Bubble Size %: Select the size of the bubbles as a percentage.
Bubble Shape: Select the shape of the bubbles. The larger the number, the more vertical the bubbles will be stretched.
🔹 Labels
Display Labels: Enable/Disable data labels, select size and location.
🔹 Separators
Display Separators: Enable/Disable timeframe separators and select color.
🔹 Liquidity Heatmap
Display Heatmap: Enable/Disable liquidity heatmap.
Heatmap Rows: select number of rows to be displayed.
Cell Minimum Size: Select the minimum size for each cell in each row.
Colors.
🔹 Style
Buy & Sell Volume Colors.

Volume Pressure Arrows[Blk0ut]Volume Pressure Arrows are an innovative (I think) market pressure tool designed to cut through noise and provide traders with a realistic, but quick insight into buying vs selling pressure and which has real control. Rather than relying on any single classic indicator, this script blends five complementary measures of price–volume dynamics—Cumulative Volume Delta (CVD), VWAP distance, OBV slope, ATR expansion, and the DMI ratio—into a unified “pressure score.”
Each component is normalized, weighted, and combined into a single metric that can be read at a glance through intuitive up and down arrows plotted directly on the chart. By transforming multiple complex data streams into a single aggregated signal, Volume Pressure Arrows help traders answer some of the hardest questions we can face: is the current move backed by conviction? is there true momentum? Is price action about to reverse?
Why It’s Different
Traditional oscillators often create conflicting signals, forcing traders to guess which one to trust. This indicator integrates five perspectives on volume and momentum pressure into a single framework, balancing raw flow (CVD), relative positioning (VWAP), trend conviction (OBV slope), volatility expansion (ATR), and directional bias (DMI). The result is a weighted, probability-minded score capped between -100 and +100 for consistency and clarity.
Important note : Inspiration for the use of directly plotted arrows came from dgtrd "https://www.tradingview.com/u/dgtrd/" and their brilliant work on LazyBear's Squeeze Indicator "https://www.tradingview.com/script/Dsr7B2xE-Squeeze-Momentum-Indicator-LazyBear-vX-by-DGT/"
How to Read It
Bullish Arrows appear below the candles when the pressure score pushes above the neutral threshold, signaling meaningful buyer dominance.
Bearish Arrows appear above the candles when pressure drops below the negative threshold, indicating strong selling pressure.
Neutral Arrows (smaller, faded) mark conditions where pressure exists but is not decisive—useful for spotting early rotations or fading momentum.
Color Gradients dynamically adjust with score intensity, making stronger signals visually brighter and weaker ones softer.
How to Use It Effectively
This tool is best applied as a confirmation and timing layer. It is not meant to replace your core strategy, but to validate whether momentum pressure supports your trade thesis.
Combine with trendlines, chart patterns, or breakouts to gauge conviction.
Use bullish or bearish arrows as filters, only take trades when price action aligns with strong directional pressure.
Watch neutral arrows near key levels; they often foreshadow balance breaking into directional moves.
Adjust the weightings to emphasize the components that matter most to your style (e.g., more weight on CVD for scalpers, or ATR expansion for volatility traders).
As with any indicator, this is not a magic ball and does not guarantee success. But it does allow you to increase the probability odds to your favor if you align it with your edge. Happy trading!

DeltaFlow Volume Profile [BigBeluga]🔵 OVERVIEW
The DeltaFlow Volume Profile builds a compact volume profile next to price and enriches every bin with flow context : bullish vs. bearish participation (%), a per-bin Delta % , an optional Delta Heat Map , and a PoC band with the bin’s absolute volume. This lets you see not just where volume clustered, but who (buyers or sellers) dominated inside each price slice.
🔵 CONCEPTS
Binned Volume Profile : Price range over a user-defined LookBack is split into Bins ; each bin aggregates traded volume.
Bull/Bear Split : Within every bin, volume is separated by candle direction into Bull Volume and Bear Volume , then normalized to % of the bin’s displayed size.
Delta % : The difference between Bull % and Bear % for the bin. Positive = buyer dominance; negative = seller dominance.
Delta Heat Map : Bin background shading that scales with both total volume strength and delta bias.
PoC (Point of Control) : The most significant bin gets a PoC band and a label with its absolute volume.
🔵 FEATURES
Profile with Flow : A clean horizontal volume bar per bin plus stacked Bull % and Bear % .
Per-Bin Delta Label : A readable “Δ xx%” tag at the start of each bin shows dominance at a glance.
Delta Heat Map : Optional gradient that intensifies with higher volume and stronger delta.
PoC Highlight : Optional PoC band colored separately, labeled with absolute volume (e.g., “1.23M”).
Configurable Inputs : LookBack, number of Bins (10–100), toggles for Delta, Heat Map, Volume Bars, and PoC color.
Readable Colors : Separate inputs for bullish (volume +) and bearish (volume –) hues.
🔵 HOW TO USE
Set the window : Choose LookBack and Bins to balance detail vs. performance (more bins = finer resolution).
Enable “Volume Bars” to display the bull/bear split as two stacked percent bars inside each bin.
High Bull % near support → constructive demand.
High Bear % near resistance → active supply.
Use Δ labels (toggle “Delta”) to quickly spot bins with clear buyer/seller control; combine with price position for confluence.
Turn on Delta Heat Map to prioritize areas with both large volume and strong imbalance.
Watch the PoC : The PoC band marks the most traded (and often magnet) level; its label shows absolute size for context.
Trade ideas :
Breakout continuation when Δ stays positive across consecutive upper bins.
Reversion risk when price enters a large bearish-Δ cluster below.
Manage risk around the PoC; reactions there can be sharp.
🔵 CONCLUSION
DeltaFlow Volume Profile upgrades a classic profile with flow intelligence. The bull/bear split, explicit Δ %, heat-weighted backdrop, and PoC volume label make dominant participation and key price shelves obvious. Use it to filter levels, time entries with imbalance, and validate breakouts or fades with objective volume-flow evidence.

CVD ema filtered 3.0This indicator is based on CVD Cumulative Volume Delta.
In this version the lines stop after a certain number of touches.
You can also choose the color for the bullish and bearish lines.

Net Positions (Net Longs & Net Shorts) - Volume AdjustedNet Positions (Net Longs & Net Shorts) - Volume Adjusted
Based on the legendary LeviathanCapital - Net Positions Indicator
Adjusted to use volume calculation for more percise data
Few important caveats:
- EVERY BUYER NEED A SELLER AND EVERY SELLER NEED A BUYER
- This indicator is meant to give you a sense of direction for the market orders ("who is the aggresive side") and should be used as confluence not as true values
In reality, in market movement each candle will contain both buying and selling, contracts closing and opening but due to some limitations that is hard to make properly.
Even with these limitations this indicator can provide a better picture than some other even external tools out there.
The main benefit of using volume delta and open interest instead of just open interest and candle closes G/R that it solves the problem with extreme cases where there might be an absorption of market orders.
Example of the Volume Edge in Action:
Bullish Absorption (The "Trap" for Sellers)
Candle Close + OI: A large Red Candle forms with Rising OI. The interpretation is simply: "New shorts are opening"
Volume Delta + OI: The same Red Candle with Rising OI has a Positive Volume Delta.
The True Story: Aggressive buyers tried to push the price up, but they were completely absorbed by large passive sell orders.
The "Volume Delta" logic:
If OI ↑ → new positions opened
• Delta ↑ → net longs added
• Delta ↓ → net shorts added
If OI ↓ → positions closed
• Delta ↑ → shorts closing
• Delta ↓ → longs closing
The "Price" logic:
If OI ↑ → new positions opened
• Price ↑ → net longs added
• Price ↓ → net shorts added
If OI ↓ → positions closed
• Price ↑ → shorts closing
• Price ↓ → longs closing

OBV Delta SimpleDelta OBV is a variant of the classic On Balance Volume (OBV).
While OBV accumulates volume flow over time, Delta OBV measures the bar-to-bar variation of OBV, showing the net momentum of buying or selling volume pressure in each period.
🔹 Interpretation:
Positive values → volume flow associated with buying pressure
Negative values → volume flow associated with selling pressure
Magnitude reflects the intensity of volume imbalance
🔹 Common uses:
Confirm trends when price advances with Delta OBV moving in the same direction
Detect divergences between price and volume (alert for potential reversals)
Identify accumulation or distribution peaks
In summary: Delta OBV converts OBV into a dynamic oscillator, more sensitive and direct for visualizing volume pressure in the short term.
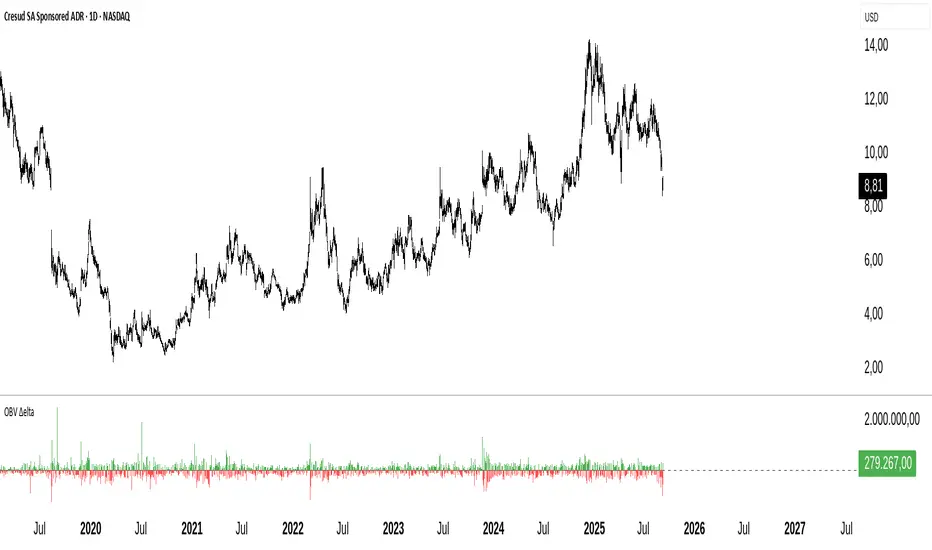
CVD Spaghetti - Multi-Exchange (Perpetuals)CVD Spaghetti – Multi-Exchange (Perpetuals) is designed to track and visualize Cumulative Volume Delta (CVD) across multiple cryptocurrency perpetual futures exchanges in one consolidated view. This indicator provides traders with a clearer perspective on buying and selling pressure by monitoring how order flow develops on different venues simultaneously.
What it does
The script calculates the CVD for each enabled exchange and plots them as separate lines on a single chart, creating a “spaghetti” style visualization. This allows traders to identify relative strength or weakness between major exchanges, which can often hint at institutional positioning, liquidity shifts, and potential market imbalances.
Why it’s useful
Order flow and liquidity dynamics can differ significantly between exchanges. By aggregating and comparing these flows, traders can:
Detect which venue is leading during trend development.
Spot divergences between exchanges, which may indicate inefficiencies or arbitrage-driven movements.
Gauge overall sentiment strength by comparing multiple sources instead of relying on a single dataset.
Technical details
Anchor Period Reset: The cumulative calculation resets based on the user-defined Anchor Period (default: daily), keeping data relevant for the chosen trading horizon.
Dynamic Resolution: The script automatically selects an appropriate lower timeframe for data requests based on the chart timeframe to maintain responsiveness and accuracy.
Normalization: Not all exchanges report volume in the same way—some use quote currency (USD), others in contracts or ticks. To ensure comparability, this indicator normalizes volumes where necessary:
Bybit USD and OKX contracts are divided by price to approximate base-coin terms.
Single-contract venues (e.g., Deribit) are normalized similarly.
Exchanges already reporting in the base currency remain unchanged.
Multi-Exchange Coverage: Supports major venues including Binance, Bybit, OKX, Bitget, Coinbase, and optional secondary exchanges like Blofin, Whitebit, and Deribit.
Visual Aids:
Zero baseline for directional reference.
Vertical session markers at each reset point.
Optional exchange labels positioned dynamically on the last bar for quick identification.
How traders might use it
Trend confirmation: Strong synchronized CVD across all major exchanges supports continuation; fragmentation may suggest weakening conviction.
Cross-exchange divergence: When one exchange’s CVD diverges from others, it can signal localized liquidity shocks or large player activity.
High-frequency strategies: On lower timeframes, the spaghetti view can highlight which venue is absorbing or providing liquidity fastest, aiding short-term decision-making.