GardFx.com - Fusion - Free Version
## 🚀 GardFx.com - Fusion (Free Version)
This is the free version of the GardFx Fusion indicator, designed to be a powerful, all-in-one dashboard for your trading.
It provides three key tools in one: an **Opening Range Box (ORB)**, a **Multi-Timeframe (MTF) Trend Bias**, and an **Exchange Clock with Session display**.
---
## ⚙️ How to Use
1. **Recommended Setup:** This script works best on **GOLD (XAUUSD)** and **NAS100 (US100)** using the 1-minute to 5-minute charts.
2. **Add the indicator** to your chart.
3. **Go to Settings (Session Time):**
* **Automate Session Times (Checked):** This is the recommended setting. The script will automatically find the 8:00 AM (London) and 9:30 AM (New York) opens for you.
* **Automate Session Times (Unchecked):** Feel free to untick "Auto" and manually enter the "Start Hour" and "Start Minute" based on your broker's exchange time (shown in the clock).
4. **Go to Settings (Dashboard & Visuals):**
* Toggle the **MTF Bias**, **Clock**, and **ORB Mid Line** on or off.
* Change the colors and width of the ORB lines to match your chart.
---
## 🔥 Get the Pro Version! 🔥
This free version is great, but the **Pro Version** is a MUST and unlocks the full trading system. Honestly, the Pro version is like a **cheat sheet** and is one of my main strategies for trading.
The Pro version has a **70-80% win rate** thanks to all the extra confluences built-in.
* **Why Go Pro?**
* **Never Miss a Signal:** Get real-time Buy & Sell signals.
* **Know When to Enter & Exit:** The script tells you exactly when to get in and out of a trade.
* **Automatic TP & SL Points:** Suggested Take Profit and Stop Loss levels are drawn on your chart for every trade.
* **Full Alert System:** Create alerts for FVG, breakouts, and final signals.
* **Extra Confluences:** Includes FVG (Fair Value Gap) detection and many other features that act as powerful confirmation.
---
## 📈 Get More from GardFx
* **Visit our Website:** www.gardfx.com
* **Join our Telegram:** Get info on EAs, more great products, and future product drops.
Volume

War Room – Futures / Flow HUD v2.0War Room — Futures / Flow HUD v2.0
Purpose:
Designed as the lower-pane companion to the War Room Combined HUD, this dashboard provides a 15-minute cadence flow log that captures the heartbeat of each session in real time. It helps visualize how intraday structure, delta flow, and bias evolve block-by-block.
Core Columns:
Time: Start of each cadence block (non-military format).
Px / VWAP: Block close price and VWAP reference for context.
Vol: Total traded volume (auto-scaled in K).
Range: Candle range in points.
Δ (Delta): Buying vs. selling volume balance.
CVD: Cumulative Volume Delta trend across blocks (M).
ΔVWAP: Distance from VWAP at block close.
Score (–3 → +3): Flow intensity and alignment measure.
Bias: Simplified trend label (SBull, Bull, Neutral, Bear, SBear).
Trap: Detects short/long traps and squeezes (“STrap” / “LTrap”).
Usage Notes:
Ideal cadence: 15-minute blocks for session-level flow rhythm.
Works best in the bottom panel (overlay = false).
Color-coded bias and trap rows for fast at-a-glance confirmation.
Integrates seamlessly with the Combined HUD (top panel) — use both together for full market context.
Visual Key:
🟩 Green → Bullish or trapped shorts
🟥 Red → Bearish or trapped longs
🟧 Orange → Neutral / early conflict zones
⚫ Gray → Low-signal or balanced conditions
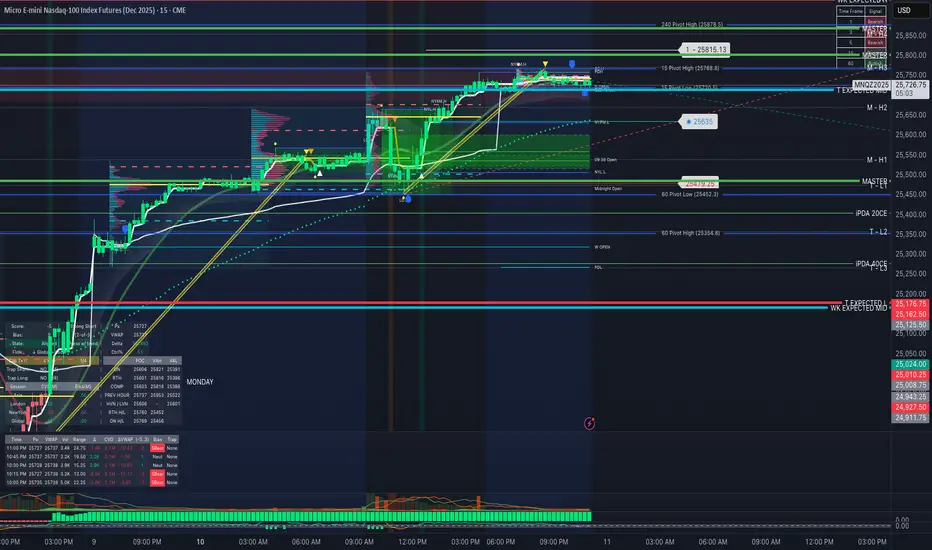
War Room – Combined HUD v3.4 (Cap T+1, RTH+ON H/L)War Room Combined HUD — Futures / Flow Command Panel
Purpose:
A high-performance multi-layer heads-up display (HUD) designed for intraday futures trading (optimized for NQ/ES). It merges market flow, volume delta, session structure, and directional bias models into a single at-a-glance command panel.
Core Features:
Score / Bias Engine: Aggregates VWAP positioning, delta slope, and CVD structure to produce a live bias score (–5 → +5 scale) and simplified bias label (SBear → SBull).
State Monitor: Detects alignment or conflict between intraday bias and real-time flow. Highlights counter-trend conditions (“Use magnets / half size”) vs. aligned continuation.
Trap Detection (Dual):
Trap Short (shorts trapped, squeeze-up risk)
Trap Long (longs trapped, flush-down risk)
Color-coded strength meter indicates WATCH / TRAPPED / SQUEEZE.
Session CVD Table: Displays cumulative volume delta (CVD) and block delta by region — Asia / London / New York / Global — with auto-classified modes: Initiative Buy, Initiative Sell, Absorption, Distribution, or Neutral.
Flow Dominance Gauge: Tracks Global vs. Local momentum; signals when session flow diverges from the global CVD vector.
Price Anchors: Displays ON (overnight) high/low, RTH (regular trading hours) high/low, and prior session reference points (POC, VAH, VAL, HVN, LVN).
Capitulation T+1 Forecast: Computes early warning probability for next-day capitulation or squeeze events using volatility stretch, CVD intensity, control %, and score extremes. Direction marked with ↑ / ↓ arrow.
Futures / Flow Lower HUD (Optional): A cadence-based flow log showing Time, Px, VWAP, Δ, CVD, Bias, and Trap for the most recent 15-minute blocks — a micro-tape of intraday flow behavior.
Usage:
Primary HUD (top panel) → Real-time decision layer (bias, traps, state, cap-forecast).
Lower HUD (optional) → Historical flow context and confirmation.
Designed for use on 1m–15m charts, tuned for New York RTH bias detection.
Visual Key:
🟩 Green → Bullish continuation or trapped shorts
🟥 Red → Bearish continuation or trapped longs
🟧 Orange → Countertrend / Watch zone
⚫ Gray/Black → Neutral or no signal

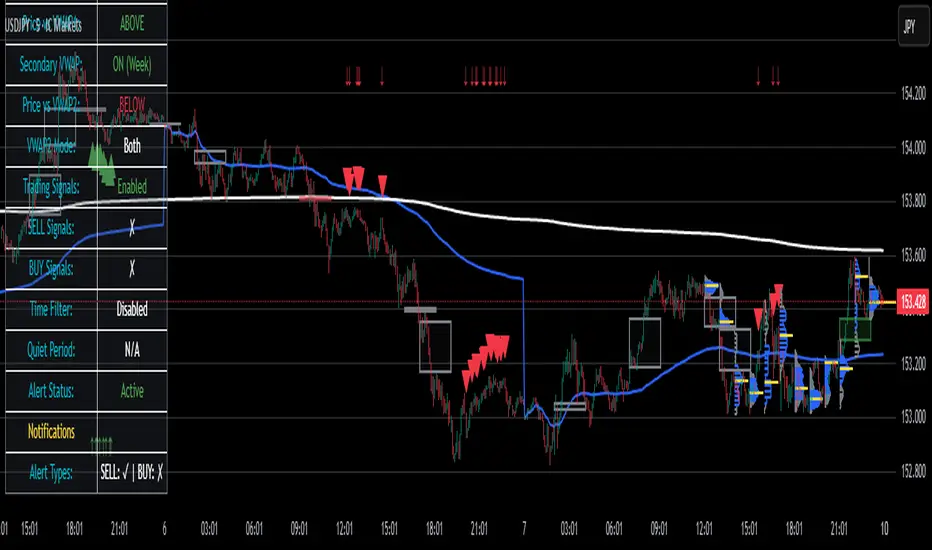
Smart VWAP FVG SystemSmart VWAP FVG System - Professional Multi-Filter Trading Indicator
📊 OVERVIEW
The Smart VWAP FVG System is an advanced multi-layered trading indicator that combines institutional volume analysis, multi-timeframe VWAP trend confirmation, and Fair Value Gap detection to identify high-probability trade entries. This indicator uses a sophisticated filtering mechanism where signals appear only when multiple independent confirmation criteria align simultaneously.
Recommended Timeframe: 5-minute (M5) or higher. The indicator works best on M5, M15, and M30 charts for intraday trading.
🎯 ORIGINALITY & PURPOSE
This indicator is original because it combines three distinct analytical methods into a unified decision-making system:
Market Profile Volume Analysis - Identifies institutional accumulation/distribution zones
Dual VWAP Filtering - Confirms trend direction using two independent VWAP calculations
Fair Value Gap Detection - Validates institutional interest through price inefficiency zones
The key innovation is the directional filter system: the primary Market Profile generates BUY-ONLY or SELL-ONLY states based on higher timeframe value area reversals, which then controls which signals from the main system are displayed. This creates a multi-timeframe confluence that significantly reduces false signals.
Unlike simple indicator mashups, each component serves a specific purpose:
Market Profile → Direction bias (trend filter)
Primary VWAP (Session) → Short-term trend confirmation
Secondary VWAP (Week) → Medium-term trend confirmation
FVG Detection → Institutional activity validation
🔧 HOW IT WORKS
1. Primary Market Profile Filter (Higher Timeframe)
The indicator calculates Market Profile on a higher timeframe (default: 1 hour) to determine the overall market structure:
Value Area High (VAH): Top 70% of volume distribution
Value Area Low (VAL): Bottom 70% of volume distribution
Point of Control (POC): Price level with highest volume
When price reaches VAH and reverses down → SELL-ONLY mode activated
When price reaches VAL and reverses up → BUY-ONLY mode activated
This higher timeframe filter ensures you're trading in the direction of institutional flow.
2. Dual VWAP System
Two independent VWAP calculations provide multi-timeframe trend confirmation:
Primary VWAP (Session-based): Resets daily, tracks intraday momentum
Secondary VWAP (Week-based): Resets weekly, confirms longer-term trend
Filter Logic:
BUY signals require: Price > Primary VWAP AND Price > Secondary VWAP
SELL signals require: Price < Primary VWAP AND Price < Secondary VWAP
This dual confirmation prevents counter-trend trades during ranging conditions.
3. Fair Value Gap (FVG) Detection
FVG zones identify price inefficiencies where institutional orders were executed rapidly:
Bullish FVG: Gap between candle .high and candle .low (upward imbalance)
Bearish FVG: Gap between candle .high and candle .low (downward imbalance)
The indicator monitors recent FVG formation (lookback: 50 bars) and requires:
Bullish FVG present for BUY signals
Bearish FVG present for SELL signals
FVG zones are displayed as colored boxes and automatically marked as "mitigated" when price fills the gap.
4. Main Trading Signal Logic
The secondary Market Profile (default: 1 hour) generates the actual trading signals:
BUY Signal Conditions:
Price reaches Value Area Low
Reversal pattern confirmed (minimum 1 bar)
Price > Primary VWAP
Price > Secondary VWAP (if filter enabled)
Recent Bullish FVG detected (if filter enabled)
Primary MP Filter = BUY-ONLY or NEUTRAL
SELL Signal Conditions:
Price reaches Value Area High
Reversal pattern confirmed (minimum 1 bar)
Price < Primary VWAP
Price < Secondary VWAP (if filter enabled)
Recent Bearish FVG detected (if filter enabled)
Primary MP Filter = SELL-ONLY or NEUTRAL
All conditions must be TRUE simultaneously for a signal to appear.
📈 VISUAL ELEMENTS
On Chart:
🟢 Green Triangle (▲) = BUY Signal
🔴 Red Triangle (▼) = SELL Signal
🟦 Blue horizontal lines = Value Area zones
🟡 Yellow line = Point of Control (POC)
🟩 Green boxes = Bullish FVG zones
🟥 Red boxes = Bearish FVG zones
🔵 Blue line = Primary VWAP (Session)
⚪ White line = Secondary VWAP (Week)
Info Panel (Top Right):
Real-time status display showing:
Filter Direction (BUY ONLY / SELL ONLY / NEUTRAL)
Active timeframes for both MP filters
FVG filter status and count
VWAP positions (ABOVE/BELOW)
Signal enablement status
Alert status
⚙️ KEY SETTINGS
MP/TPO Filter Settings (Primary Indicator)
MP Filter Time Frame: 60 minutes (controls directional bias)
Filter Value Area %: 70% (standard Market Profile calculation)
Filter Alert Distance: 1 bar
Filter Min Bars for Reversal: 1 bar
Filter Alert Zone Margin: 0.01 (1%)
FVG Filter Settings
Use FVG Filter: Enabled (toggle on/off)
FVG Timeframe: 60 minutes (1 hour)
FVG Filter Mode: Both (require bullish FVG for BUY, bearish for SELL)
FVG Lookback Period: 50 bars (how far back to search)
Show FVG Formation Signals: Optional visual markers
Max FVG on Chart: 50 zones
Show Mitigated FVG: Display filled gaps
Market Profile Settings
Higher Time Frame: 60 minutes (for main signals)
Percent for Value Area: 70%
Show POC Line: Enabled
Keep Old MPs: Enabled (maintain historical profiles)
Primary VWAP Filter
Use Primary VWAP Filter: Enabled
Primary VWAP Anchor Period: Session (resets daily)
Primary VWAP Source: HLC3 (typical price)
Secondary VWAP Filter
Use Secondary VWAP Filter: Enabled
Secondary VWAP Anchor Period: Week (resets weekly)
Secondary VWAP Filter Mode: Both
Secondary VWAP Line Color: White
Trading Signals
Show Trading Signals on Chart: Enabled
Show SELL Signals: Enabled
Show BUY Signals: Enabled
Alert Distance: 1 bar
Min Bars for Reversal: 1 bar
Alert Zone Margin: 0.01 (1%)
Retest Search Period: 20 bars
Min Bars Between Retests: 5 bars
Show Only Retests: Disabled
Alert Settings
Enable Trading Notifications: Enabled
VAH Reversal Alert: Enabled (SELL signals)
VAL Reversal Alert: Enabled (BUY signals)
Time Filter Settings
Filter Alerts By Time: Optional (exclude specific hours)
⚠️ IMPORTANT WARNINGS & LIMITATIONS
1. Repainting Behavior
CRITICAL: This indicator uses lookahead=barmerge.lookahead_on to access higher timeframe data immediately for FVG detection. This is necessary to provide real-time FVG zone visualization but has the following implications:
FVG zones may shift slightly until the higher timeframe candle closes
FVG detection signals are preliminary until HTF bar confirmation
The main trading signals (triangles) appear on confirmed bars and do not repaint
Best Practice: Always wait for the current timeframe bar to close before acting on signals. The filter status and FVG zones are informational but may adjust as new data arrives.
2. Minimum Timeframe
Do NOT use on timeframes below 5 minutes (M5)
Recommended: M5, M15, M30 for intraday trading
Higher timeframes (H1, H4) can also be used but will generate fewer signals
3. Multiple Filters Can Block Signals
By design, this indicator is conservative. When all filters are enabled:
Signals appear ONLY when all conditions align
You may see extended periods with no signals
This is intentional to reduce false positives
If you see no signals:
Check the Info Panel to see which filters are failing
Consider adjusting FVG lookback period
Temporarily disable FVG filter to test
Verify VWAP filters match current market trend
4. Market Profile Limitations
Market Profile requires sufficient volume data
Low-volume instruments may produce unreliable profiles
Value Areas update only on higher timeframe bar close
Works best on liquid markets (major forex pairs, indices, crypto)
📖 HOW TO USE
Step 1: Add to Chart
Apply indicator to M5 or higher timeframe chart
Ensure chart shows volume data
Use standard candles (NOT Heikin Ashi, Renko, etc.)
Step 2: Configure Settings
Primary MP Filter TF: Set to 60 (1 hour) minimum, or 240 (4 hour) for swing trading
Main MP TF: Set to 60 (1 hour) for intraday signals
FVG Timeframe: Match or exceed main MP timeframe
Leave other settings at default initially
Step 3: Understand the Info Panel
Monitor the top-right panel:
FILTER STATUS: Shows current directional bias
NEUTRAL = Both signals allowed
BUY ONLY = Only green triangles will appear
SELL ONLY = Only red triangles will appear
FVG Filter: Shows if bullish/bearish gaps detected recently
VWAP positions: Confirms trend alignment
Step 4: Take Signals
For BUY Signal (Green Triangle ▲):
Wait for green triangle to appear
Check Info Panel shows ✓ for BUY signals
Confirm current bar has closed
Enter long position
Stop loss: Below recent VAL or swing low
Target: Previous Value Area High or 1.5-2× risk
For SELL Signal (Red Triangle ▼):
Wait for red triangle to appear
Check Info Panel shows ✓ for SELL signals
Confirm current bar has closed
Enter short position
Stop loss: Above recent VAH or swing high
Target: Previous Value Area Low or 1.5-2× risk
Step 5: Risk Management
Risk per trade: Maximum 1-2% of account equity
Position sizing: Adjust based on stop loss distance
Avoid trading: During major news events or time filter periods
Multiple confirmations: Look for confluence with price action (support/resistance, trendlines)
🎓 UNDERLYING CONCEPTS
Market Profile Theory
Developed by J. Peter Steidlmayer in the 1980s, Market Profile organizes price and volume data to identify:
Value Areas: Where 70% of trading activity occurred
POC: Price level with highest acceptance (most volume)
Imbalances: When price moves away from value quickly
This indicator uses TPO (Time Price Opportunity) calculation method to build the volume profile distribution.
VWAP (Volume Weighted Average Price)
VWAP represents the average price weighted by volume, showing where institutional traders are positioned:
Price above VWAP = Bullish (institutions accumulated lower)
Price below VWAP = Bearish (institutions distributed higher)
Using dual VWAP (Session + Week) creates multi-timeframe trend alignment.
Fair Value Gaps (FVG)
Also known as "imbalance" or "inefficiency," FVG occurs when:
Price moves so rapidly that a gap forms in the candlestick structure
Indicates institutional order flow (large market orders)
Price often returns to "fill" these gaps (rebalance)
The 3-candle FVG pattern (gap between candle and candle ) is widely used in ICT (Inner Circle Trader) methodology and Smart Money Concepts.
🔍 CREDITS & CODE ATTRIBUTION
This indicator builds upon established technical analysis concepts and combines multiple methodologies:
1. Market Profile / TPO Calculation
Concept Origin: J. Peter Steidlmayer (Chicago Board of Trade, 1980s)
Code Inspiration: TradingView's public domain Market Profile examples
Modifications: Custom filtering logic for directional bias, dual timeframe implementation
2. VWAP Calculation
Concept Origin: Standard financial instrument (widely used since 1980s)
Code Base: TradingView built-in ta.vwap() function (public domain)
Modifications: Dual VWAP system with independent anchor periods, custom filtering modes
3. Fair Value Gap Detection
Concept Origin: Inner Circle Trader (ICT) / Smart Money Concepts methodology
Code Implementation: Original implementation based on 3-candle gap pattern
Features: Multi-timeframe detection, automatic mitigation tracking, visual zone display
4. Pine Script Framework
Language: Pine Script v6 (TradingView)
Built-in Functions Used:
ta.vwap() - Volume weighted average price
request.security() - Higher timeframe data access
ta.change() - Period detection
ta.cum() - Cumulative volume
time() - Timestamp functions
Note: All code is original implementation. While concepts are based on established trading methodologies, the combination, filtering logic, and execution are unique to this indicator.
📊 RECOMMENDED INSTRUMENTS
Best Performance:
Major Forex Pairs (EURUSD, GBPUSD, USDJPY)
Stock Indices (ES, NQ, SPX, DAX)
Major Cryptocurrencies (BTCUSD, ETHUSD)
Liquid Stocks (high daily volume)
Avoid:
Low-volume altcoins
Illiquid stocks
Exotic forex pairs with wide spreads
⚡ PERFORMANCE TIPS
Start Conservative: Enable all filters initially
Reduce Filters Gradually: If too few signals, disable Secondary VWAP filter first
Match Timeframes: Keep MP Filter TF and FVG TF at same value
Backtest First: Review historical performance on your preferred instrument/timeframe
Combine with Price Action: Look for support/resistance confluence
Use Time Filter: Avoid low-liquidity hours (optional setting)
🚫 WHAT THIS INDICATOR DOES NOT DO
Does not guarantee profits - No trading system is 100% accurate
Does not predict the future - Based on historical patterns
Does not replace risk management - Always use stop losses
Does not work on all instruments - Requires volume data and liquidity
Does not provide exact entry/exit prices - Signals are zones, not precise levels
Does not account for fundamentals - Purely technical analysis
📜 DISCLAIMER
This indicator is provided for educational and informational purposes only. It is not financial advice, and past performance does not guarantee future results.
Trading Risk Warning:
All trading involves risk of loss
You can lose more than your initial investment (leverage products)
Only trade with capital you can afford to lose
Always use appropriate position sizing and risk management
Consider seeking advice from a licensed financial advisor
Technical Limitations:
Indicator may repaint FVG zones until HTF bar closes
Signals are based on historical patterns that may not repeat
Market conditions change and no system works in all environments
Volume data quality varies by exchange/broker
By using this indicator, you acknowledge these risks and agree that the author bears no responsibility for trading losses.
📞 SUPPORT & UPDATES
Questions? Comment on this publication
Issues? Describe the problem with chart screenshot
Feature Requests? Suggest improvements in comments
Updates: Will be published as new versions using TradingView's update feature
📝 VERSION HISTORY
Version 1.0 (Current)
Initial public release
Multi-filter system: MP + Dual VWAP + FVG
Directional bias filter
Real-time info panel
Comprehensive alert system
Time-based filtering
Thank you for using Smart VWAP FVG System!
Happy Trading! 📈
Twiggs Go Money Flow Enhanced [KingThies]█ OVERVIEW
The Twiggs Money Flow (TMF) is a volume-weighted momentum oscillator that
measures buying and sellistng pressure by analyzing where price closes within
each bar's true range. It's an enhanced version of Chaikin Money Flow that
uses Wilder's smoothing method, providing better trend persistence and
smoother signals.
The indicator oscillates around a zero listne:
Values above zero indicate accumulation (buying pressure)
Values below zero indicate distribution (sellistng pressure)
TMF was developed by Colistn Twiggs as an improvement over traditional money
flow indicators by incorporating true range calculations and Wilder's
exponential moving average.
█ CONCEPTS
True Range Boundaries
TMF calculates a modified true range for each bar by comparing the current
bar's high and low with the previous close:
True Range High = maximum of (previous close, current high)
True Range Low = minimum of (previous close, current low)
This accounts for overnight gaps and ensures price continuity between bars.
Average Daily Value (ADV)
The ADV represents the portion of volume attributable to buying versus sellistng:
ADV = Volume × ((Close - TR Low) - (TR High - Close)) / True Range
When price closes near the high of the true range, ADV is positive and large.
When price closes near the low, ADV is negative and large.
A close in the middle produces values near zero.
Wilder's Moving Average
Unlistke simple moving averages, Wilder's smoothing method gives more weight
to recent values while maintaining memory of historical data:
WMA = (Previous WMA × (Period - 1) + Current Value) / Period
This creates smoother trends that are less prone to whipsaws than standard
moving averages.
Final Calculation
TMF = Wilder's MA(ADV, Period) / Wilder's MA(Volume, Period)
By dividing smoothed ADV by smoothed volume, TMF normalistzes the reading and
makes it comparable across different securities and timeframes.
█ HOW TO USE
Zero listne Crossovers
The most straightforward trading signals:
A cross above zero suggests buyers are gaining control.
Consider this a bullistsh signal, especially when confirmed by price action.
A cross below zero suggests sellers are gaining control.
Consider this a bearish signal.
The longer TMF remains above or below zero, the stronger the trend.
Extreme Values
Strong positive or negative readings indicate intense buying or sellistng pressure:
Sustained high positive values (above +0.4) suggest strong accumulation
but may also indicate overbought conditions.
Sustained low negative values (below -0.4) suggest strong distribution
but may also indicate oversold conditions.
These extremes work best when used in conjunction with price levels and
support/resistance zones.
Divergences
Divergences between price and TMF often signal potential reversals:
Bearish divergence: Price makes a higher high but TMF makes a
lower high — suggests buying pressure is weakening despite rising prices.
Bullistsh divergence: Price makes a lower low but TMF makes a
higher low — suggests sellistng pressure is weakening despite fallistng prices.
Trend Confirmation
Use TMF to confirm the strength of existing trends:
In an uptrend, TMF should remain mostly positive with occasional dips below zero.
In a downtrend, TMF should remain mostly negative with occasional rises above zero.
If TMF contradicts the price trend, consider the trend weak or potentially ending.
█ FEATURES
Period (default: 21)
The lookback length for Wilder's moving average calculation:
Shorter periods (10–15) make TMF more responsive to recent changes but
increase noise and false signals.
Longer periods (30–50) create smoother readings but lag price action more
significantly.
The default 21-period setting balances responsiveness with relistabilistty.
Consider adjusting the period based on your trading timeframe and the
volatilistty of the security you're analyzing.
█ LIMITATIONS
TMF is a lagging indicator due to its smoothing method. Signals may occur
after optimal entry or exit points.
In low-volume or illistquid markets, TMF can produce erratic readings that
may not reflect true buying or sellistng pressure.
Ranging or choppy markets often generate frequent zero-listne crosses that
can lead to whipsaws.
listke all volume-based indicators, TMF's relistabilistty depends on accurate
volume data.
For securities with unrelistable volume reporting, consider using
price-based momentum indicators instead.
█ NOTES
This indicator uses area-style plotting in the original version to visualistze
the magnitude of buying and sellistng pressure. The filled area makes it easy
to see at a glance whether the market is in accumulation or distribution mode.
TMF works on any timeframe but tends to be most relistable on daily charts
where volume data is most accurate and meaningful.
█ CREDITS
Original indicator developed by
LazyBear .
Based on the Twiggs Money Flow concept from Incredible Charts:
Incredible Charts – Twiggs Money Flow .

BVC - Optimized Trend StrengthOverview
BVC-Optimized Trend Strength is a next-generation trend evaluation system designed specifically for the Casablanca Stock Exchange (BVC).
It measures the true strength of bullish and bearish pressure using a combination of advanced technical filters:
• Trend structure via MM20 & MM50
• Market momentum via RSI
• Breakout confirmation using Donchian levels
• Volume validation based on BVC liquidity characteristics
• Slope strength of the fast moving average
• Weighted scoring engine (0 → 100)
• Non-repainting BUY/SELL signals
• Background regime detection (Bull / Bear / Neutral)
It is engineered to be highly configurable, lightweight, and fully adapted to BVC market behavior, where liquidity, breakout reliability, and trend confirmation behave differently from US or European markets.
⸻
How It Works
At every bar, the script evaluates 6 categories of trend evidence.
Each category contributes a configurable weight to a final Bull Score and Bear Score, each ranging from 0 to 100.
Bull Score Components
• Price above MM20
• MM20 above MM50
• Positive MA slope
• RSI above bullish threshold
• Donchian bullish breakout (non-repainting)
• Volume confirmation
Bear Score Components
Exact mirror of the bullish setup.
The result is a quantitative trend strength meter that reflects the true pressure behind the market.
⸻
Non-Repainting BUY & SELL Signals
Signals only trigger when the calculated score crosses your minimum threshold (default: 60).
Labels fire once, at the close of the candle, using:
MM crossovers
RSI regime shifts
Donchian breakouts
Trend structure & volume validation
All signals are non-repainting, meaning what you see historically is exactly what was printed live.
Labels include:
BUY • Very Strong (85/100)
SELL • Strong (65/100)
⸻
Background Regime Detection
The chart background automatically adapts to market conditions:
• Green → confirmed bullish regime
• Red → confirmed bearish regime
• Gray → mixed or transition phase
You may customize transparency and behavior.
⸻
Top-Right Dashboard
A clean summary panel displays:
• Price
• MM20
• MM50
• RSI
• Bull/Bear scores
• Recommended Action: BUY / HOLD, SELL / AVOID or WAIT
This gives traders an instant, objective view of market conditions.
⸻
Alerts
Built-in TradingView alerts:
• BUY Signal
• SELL Signal
Customize them directly through the TradingView alerts panel.
⸻
Ideal For
Swing traders
Position traders
Portfolio managers
Trend-followers
BVC investors wanting objective confirmation
Traders who hate repainting signals
⸻
Why It Works on the BVC
The BVC behaves differently from high-frequency markets.
Breakouts often require confirmation, low volume distorts momentum, and many assets move in structured waves.
This script integrates all these insights into a single, powerful and unified indicator—built for Morocco, by someone who trades Morocco.
⸻
Disclaimer
This indicator does not guarantee profits and should be combined with market structure, liquidity evaluation, and proper risk management. Past performance does not guarantee future results.

ICT Complete Multi-Setup StrategyThe ICT (Inner Circle Trader) trading strategies include multiple setups such as Silver Bullet, Cameron's Model, Inversion Fair Value Gap, Turtle Soup, Candle Range Theory (CRT), Optimal Trade Entry (OTE), Change in the State of Delivery (CISD), and Power of Three (PO3). These strategies revolve around concepts like liquidity sweeps, fair value gaps (FVG), order blocks, market structure shifts, and smart money footprints.
For a comprehensive Pine Script indicator that incorporates all ICT trading strategies with buy/sell toggles and detailed setups, it involves detecting and marking key ICT concepts like liquidity zones, fair value gaps, order blocks, market structure breaks, and then combining these signals into actionable buy/sell alerts.
Based on the available resources, a Pine Script indicator for all ICT setups would feature:
Marking and trading liquidity sweeps and stops (Silver Bullet, Cameron's Model)
Identifying fair value gaps and their inversions (Inversion FVG, Turtle Soup)
Highlighting Candle Range Theory zones with entries and stops
Fibonacci retracement-based Optimal Trade Entry (OTE) zones for entry timing
Detecting momentum shifts and Change in State of Delivery (CISD)
Recognizing accumulation, manipulation, and distribution phases for Power of Three (PO3)
Toggles for each strategy to enable/disable buy and sell signals
An indicator script needs well-commented code for readability and must visually display buy/sell signals, FVG zones, and key price levels on the chart.

Swing Distance Analyse + TableVisualize swing distances, cumulative supply/demand volume, and Ease of Movement in a structured table for precise market analysis.
Long Description:
This indicator detects pivot highs and lows to analyze market swings, calculating:
Swing distance between consecutive pivots
Cumulative volume for demand (highs) and supply (lows)
Ease of Movement (EMV-style) for each swing
Trend and extension flags for actionable insights
All swing data is displayed in a customizable table panel on your chart. Ideal for traders who want a clear, structured overview of recent swings, volume pressure, and market dynamics.
Features:
Configurable swing length and number of swings displayed
Table shows swing type, supply/demand trends, EMV, extension, duration, and result
Color-coded labels and table cells for quick interpretation
Works on all chart timeframes

SuperTrend Dual RMAOverview
The SuperTrend Dual RMA is a hybrid volatility-based trend-following system that merges two Relative Moving Averages (RMAs) with an Average True Range (ATR)–anchored SuperTrend framework. The primary purpose of this indicator is to offer a smoother and more reliable depiction of directional bias while maintaining sensitivity to price volatility and market volume.
Traditional SuperTrend implementations typically rely on a single moving average and a fixed volatility envelope. This dual RMA structure introduces an adaptive central tendency line that reacts proportionally to both price and volume, allowing for more nuanced identification of trend reversals and continuation patterns.
**Core Concept**
The indicator is built around two key principles — smoothing and volatility adaptation.
1. **Smoothing:** The use of two separate RMAs with configurable lengths creates a dynamic equilibrium between short-term responsiveness and long-term stability. The first RMA captures near-term directional shifts, while the second provides broader market context. The average of both becomes the foundation of the SuperTrend bands.
2. **Volatility Adaptation:** The ATR multiplier and period define the distance between upper and lower bands relative to recent volatility. This ensures that the SuperTrend line remains flexible across varying market conditions — expanding during high volatility and contracting during calm phases.
**Calculation Steps**
* The indicator first computes two volume-weighted RMAs based on the typical price (`hlc3`) multiplied by trading volume.
* Each RMA is normalized by the smoothed volume to maintain proportional weighting.
* These two RMAs are averaged to produce a “basis line” that reflects the current market consensus price.
* The ATR is calculated over a user-defined period, then multiplied by a volatility factor (ATR multiplier).
* The resulting ATR value defines dynamic upper and lower thresholds around the basis line.
* Trend direction is determined by price closing behavior relative to these thresholds:
* When the closing price exceeds the upper band, the trend is considered bullish.
* When it drops below the lower band, the trend turns bearish.
* If price remains within the bands, the prior trend direction is maintained for consistency.
**Visual Structure**
The SuperTrend Dual RMA provides multiple layers of visual feedback for enhanced interpretation:
* Two distinct RMA lines (short and long) are plotted with complementary colors for contrast and clarity.
* A soft fill between the RMA lines highlights the interaction between short- and medium-term momentum.
* The ATR-based SuperTrend bands are drawn above and below the basis, with adaptive coloring that corresponds to the prevailing trend direction.
* Bar colors automatically adjust to reflect bullish or bearish bias, making it easy to identify trend shifts without relying solely on crossovers.
* Optional triangle markers appear below or above bars to signal potential buy or sell opportunities based on crossover logic.
**Signals and Alerts**
The indicator provides real-time crossover detection:
* **Buy Signal:** Triggered when the closing price moves above the SuperTrend line, confirming potential bullish continuation or reversal.
* **Sell Signal:** Triggered when the closing price drops below the SuperTrend line, indicating possible bearish momentum or reversal.
Both conditions have built-in `alertcondition()` functions, allowing users to set automated alerts for trading or monitoring purposes. This enables integration with TradingView’s alert system for push notifications, emails, or webhook connections.
**Usage Guidelines**
* **Trend Identification:** Use the color-coded trend line and bar color as a visual guide to the current directional bias.
* **Entry and Exit Timing:** Consider entering trades when a new crossover alert appears, preferably in the direction of the overall higher-timeframe trend.
* **Parameter Tuning:** Adjust the RMA lengths and ATR parameters based on asset volatility. Shorter RMA and ATR settings provide faster reactions, suitable for intraday or high-frequency trading, while longer configurations better fit swing or position strategies.
* **Risk Management:** Because the SuperTrend inherently acts as a dynamic stop level, traders can use the opposite band or SuperTrend line as a trailing stop or exit signal.
**Practical Applications**
* Trend confirmation in multi-timeframe strategies.
* Adaptive trailing stop placement using the lower or upper band.
* Visual comparison of volume-weighted price movement against volatility envelopes.
* Integration into algorithmic trading systems as a signal filter or trend bias component.
* Identification of overextended conditions when price significantly diverges from the SuperTrend basis.
**Originality and Advantages**
The SuperTrend Dual RMA differentiates itself from conventional SuperTrend scripts through three innovative design choices:
1. **Dual Volume-Weighted RMAs:** By incorporating two RMAs weighted by trading volume, the indicator accounts for liquidity dynamics, producing smoother and more reliable averages compared to price-only calculations.
2. **Anchored SuperTrend Framework:** The SuperTrend bands are not derived from a fixed source (such as a single close or median price) but from a blended RMA basis, making them more adaptable to varying market behaviors.
3. **Integrated Multi-Layer Visualization:** The inclusion of filled regions between RMAs, dynamic band coloring, and bar tinting enhances readability and analytical depth without overwhelming the chart.
These improvements collectively create a more balanced and data-rich representation of market structure, offering a higher degree of analytical precision. It’s suitable for traders seeking both discretionary and systematic use, as the indicator’s logic is transparent and compatible with alert-based or automated workflows.
**Summary**
The SuperTrend Dual RMA is a refined evolution of the classic SuperTrend, optimized for traders who value smoother directional tracking and more intelligent volatility adaptation. It blends two time-sensitive, volume-aware moving averages with an ATR-derived volatility system to deliver reliable, actionable trend information. Its visual design, adaptive responsiveness, and integrated alert functionality make it a complete solution for identifying and managing trends across multiple asset classes and timeframes.

VWAP Trend
**Overview**
The VWAP Trend indicator is a volume-weighted price analysis tool that visualizes the relationship between price and the anchored Volume Weighted Average Price (VWAP) over different timeframes. This script is designed to reveal when the market is trending above or below its volume-weighted equilibrium point, providing a clear framework for identifying directional bias, trend strength, and potential reversals.
By combining an anchored VWAP with exponential smoothing and a secondary trend EMA, the indicator helps traders distinguish between short-term price fluctuations and genuine volume-supported directional moves.
**Core Concept**
VWAP (Volume Weighted Average Price) represents the average price of an asset weighted by traded volume. It reflects where the majority of trading activity has taken place within a chosen period, serving as a critical reference level for institutions and professional traders.
This indicator extends the traditional VWAP concept by:
1. Allowing users to **anchor VWAP to different timeframes** (Daily, Weekly, or Monthly).
2. Applying **smoothing** to create a stable reference curve less prone to noise.
3. Overlaying a **trend EMA** to identify whether current price momentum aligns with or diverges from VWAP equilibrium.
The combination of these elements produces a visual representation of price’s relationship to its fair value across time, helping to identify accumulation and distribution phases.
**Calculation Methodology**
1. **Anchored VWAP Calculation:**
The script resets cumulative volume and cumulative volume–price data at the start of each new VWAP session (based on the selected anchor timeframe). It continuously accumulates the product of price and volume, dividing this by total volume to compute the current VWAP value.
2. **Smoothing Process:**
The raw VWAP line is smoothed using an Exponential Moving Average (EMA) of user-defined length, producing a cleaner, more stable trend curve that minimizes intraperiod noise.
3. **Trend Determination:**
An additional EMA is calculated on the closing price. By comparing the position of this EMA to the smoothed VWAP, the indicator determines the prevailing market bias:
* When the trend EMA is above the smoothed VWAP, the market is considered to be in an **uptrend**.
* When the trend EMA is below the smoothed VWAP, the market is classified as a **downtrend**.
**Visual Structure**
The indicator uses color dynamics and chart overlays to make interpretation intuitive:
* **Smoothed VWAP Line:** The main trend reference, colored blue during bullish conditions and orange during bearish conditions.
* **Price Fill Region:** The area between the smoothed VWAP and price is filled with a translucent color matching the current trend, visually representing whether price is trading above or below equilibrium.
* **Trend EMA (implicit):** Although not separately plotted, it drives the color state of the VWAP, ensuring seamless visual transitions between bullish and bearish conditions.
**Inputs and Parameters**
* **VWAP Timeframe:** Choose between Daily, Weekly, or Monthly anchoring. This determines the reset frequency for cumulative volume and price data.
* **VWAP Smoothing Length:** Defines how many periods are used to smooth the VWAP line. Shorter values produce a more reactive line; longer values create smoother, steadier signals.
* **Trend EMA Length:** Sets the period for the trend detection EMA applied to price. Adjust this to calibrate how quickly the indicator reacts to directional changes.
**Interpretation and Use Cases**
* **Trend Confirmation:** When price and the trend EMA both remain above the smoothed VWAP, the market is showing strong bullish control. Conversely, consistent price action below the VWAP suggests sustained bearish sentiment.
* **Fair Value Assessment:** VWAP serves as a dynamic equilibrium level. Price repeatedly reverting to this line indicates consolidation or fair value zones, while strong directional moves away from VWAP highlight momentum phases.
* **Institutional Benchmarking:** Because large market participants often benchmark entries and exits relative to VWAP, this indicator helps align retail analysis with institutional logic.
* **Reversal Detection:** Sudden crossovers of the trend EMA relative to the VWAP can signal potential reversals or shifts in momentum strength.
**Trading Applications**
* **Trend Following:** Use VWAP’s direction and color state to determine trade bias. Long entries are favored when the VWAP turns blue, while short entries align with orange phases.
* **Mean Reversion:** In ranging conditions, traders may look for price deviations far above or below VWAP as potential reversion opportunities.
* **Multi-Timeframe Confluence:** Combine the Daily VWAP Trend with higher anchor periods (e.g., Weekly or Monthly) to confirm larger trend structure.
* **Support and Resistance Mapping:** VWAP often acts as a strong intraday or session-level support/resistance zone. The smoothed version refines this behavior into a cleaner, more reliable reference.
**Originality and Innovation**
The VWAP Trend indicator stands apart from conventional VWAP scripts through several original features:
1. **Anchor Flexibility:** Most VWAP indicators fix the anchor to a specific session (like daily). This version allows switching between Daily, Weekly, and Monthly anchors dynamically, adapting to various trading styles and time horizons.
2. **Volume-Weighted Smoothing:** The use of an EMA smoothing layer over the raw VWAP provides enhanced stability without compromising responsiveness, delivering a more analytically consistent signal.
3. **EMA-Based Trend Comparison:** By introducing a second trend EMA, the indicator creates a comparative framework that merges volume-weighted price analysis with classical momentum tracking — a rare and powerful combination.
4. **Adaptive Visual System:** The color-shifting and shaded fill between VWAP and price are integrated into a single, lightweight structure, giving traders immediate insight into market bias without the clutter of multiple overlapping indicators.
**Advantages**
* Adaptable to any market, timeframe, or trading style.
* Provides both equilibrium (VWAP) and momentum (EMA) perspectives.
* Smooths out noise while retaining the integrity of volume-based price dynamics.
* Enhances situational awareness through intuitive color-coded visualization.
* Ideal for professional, swing, and intraday traders seeking context-driven market direction.
**Summary**
The VWAP Trend indicator is a modern enhancement of the classical VWAP methodology. By merging anchored volume-weighted analysis with smoothed trend detection and visual state feedback, it provides a comprehensive perspective on market equilibrium and directional strength. It is built for traders who seek more than static price references — offering an adaptive, volume-aware framework for identifying market trends, reversals, and fair-value zones with precision and clarity.

Absorption PRO🧠 Absorption PRO
Identify smart money absorption and hidden reversals with precision.
The Absorption PRO indicator detects abnormal trading activity and potential absorption zones — moments when large orders absorb market pressure before a reversal or continuation. It uses dynamic volume deviation and candle structure filters to highlight strong absorption areas visually.
⚙️ Parameters
Base period (mean & deviation): 200
Defines the lookback length used to calculate the average and standard deviation of volume.
A higher value (like 200) makes the indicator smoother and better for higher timeframes.
Minimum Z-score (abnormal volume): 2
Sets the threshold for detecting abnormal volume spikes.
The higher this value, the rarer (but stronger) the detected absorption signals.
Small body limit: 0.25
Filters candles with small real bodies compared to their total range — ideal for spotting absorption with high volume and low price movement (classic absorption signature).
Background color intensity (0–100): 85
Adjusts the opacity of the visual background highlight.
Higher values make absorption zones more visible on the chart.
📊 Usage
Look for highlighted bars or zones when volume is abnormally high, but the candle body remains small — indicating possible absorption.
Combine it with price structure and delta/volume profile tools for confirmation.

Buy/Sell Volume - TradingriotThis indicator estimates buy-side and sell-side volume using a RangeSplit model. Since TradingView does not provide true bid/ask aggressor data, the script allocates each bar’s volume based on where the close sits within the bar’s high–low range. The closer the close is to the high, the more of that bar’s volume is attributed to buying pressure. The closer it is to the low, the more is attributed to selling pressure.
How it works
Compute the bar’s total range
range = high − low
Locate the close inside that range
fraction = (close − low) / range
Allocate volume
Buy Volume = volume × fraction
Sell Volume = volume × (1 − fraction)
Apply an optional EMA smooth to stabilize the signals.
Plots
Buy Volume (green columns) – estimated buy-side participation
Sell Volume (red columns) – estimated sell-side participation
Delta Line (gray) – smoothed difference between buy and sell volume
Zero line – helps identify positive or negative volume imbalance
Use-case
This gives a quick visual read of dominant pressure inside each bar without relying on unreliable raw volume bars. It can help highlight shifts in control, volume imbalances, and momentum transitions on higher timeframes.
Limitations
This is a proxy, not true buy/sell volume. It does not access bid/ask or time-and-sales data. It simply distributes total volume by candle geometry.
If you want a clean and simple way to visualize who likely controlled the bar, this is as far as TradingView can go using OHLCV data.

jinhanborasaeg bori indicator ENHello, I'm jinhanborasaeg.
This indicator was created by modifying the free indicator "Vumanchu Free Swing."
It was developed with Claude's assistance and includes
additions such as no-repaint functionality, TP/SL, and more.
For settings, you should use High instead of Close for better results.
Below is the link to an indicator I created by combining 20 different indicators,
which showed good backtesting results. If you're interested,
I'd appreciate it if you could take a look.
jinhanborasaeg.gumroad.com

Advanced Volume indicator This indicator shows 4H volume on the 1H chart.
I am using this one for my swing trade system on the 1H chart, which I will also publish later.
My entry signal is a extraordinary volume candle, a red threshold line can mark “very high volume” zones (SMA × multiplier).

Top Finder & Dip Hunter [BackQuant]Top Finder & Dip Hunter
A practical tool to map where price is statistically most likely to exhaust or mean-revert. It builds objective support for dips and resistance for tops from multiple methodologies, then filters raw touches with volume, momentum, trend, and price-action context to surface higher-quality reversal opportunities.
What this does
Draws a Dip Support line and a Top Resistance line using the method you select, or a blended hybrid.
Evaluates each touch/penetration against Quality Filters and assigns a 0–100 composite score.
Prints clean DIP and TOP signals only when depth/extension and quality pass your thresholds.
Optionally annotates the chart with the computed quality score at signal time.
Why it’s useful
Objectivity: Converts vague “looks extended” into rules, reduces discretion creep.
Signal hygiene: Filters raw touches using trend, volume, momentum, and candle structure to avoid obvious traps.
Adaptable regimes: Switch methods, sensitivity, and lookbacks to match choppy vs trending conditions.
How support and resistance are built
Pick one per side, or use “Hybrid.”
Dynamic: Anchors to the extreme of a lookback window, padded by recent ATR, so buffers expand in volatile periods and contract when calm.
Fibonacci: Uses the 0.618/0.786 retracement pair inside the current swing window to target common reaction zones.
Volatility: Uses a moving-average basis with standard-deviation bands to capture statistically stretched moves.
Volume-Weighted: Centers off VWAP and penalizes deviations using dispersion of price around VWAP, helpful on intraday instruments.
Hybrid: A weighted average of the above to smooth out single-method biases.
When a touch becomes a signal
Depth/extension test:
Dips must penetrate their support by at least Min Dip Depth % .
Tops must extend above resistance by at least Min Top Rise % .
Quality Score gate: The composite must clear Min Quality Score . Components:
Trend alignment: Favor dips in bullish regimes and tops in bearish regimes using EMAs and RSI.
Volume confirmation: Reward expansion or spikes versus a 20-period baseline.
RSI context: Prefer oversold for dips, overbought for tops.
Momentum shift: Look for short-term momentum turning in the expected direction.
Candle structure: Reward hammer/shooting-star style responses at the level.
How to use it
Pick your regime:
Range/chop, small caps, mean-revert intraday → Volatility or Volume Weighted .
Cleaner swings/trends → Dynamic or Fibonacci .
Unsure or mixed conditions → Hybrid .
Set windows: Start with Lookback = 50 for both sides. Increase in higher timeframes or slow assets, decrease for fast scalps.
Tune sensitivity: Raise Dip/Top Sensitivity to widen buffers and reduce noise. Lower to be more aggressive.
Gate with quality: Begin with Min Quality Score = 60 . Push to 70–80 for cleaner swing entries, relax to 50–60 for scalps.
Act on first prints: The script only fires on new qualified events. Use the score label to prioritize A-setups.
Typical workflows
Intraday futures/crypto: Volume-Weighted or Volatility methods for both sides, higher Sensitivity , require Volume Filter and Momentum Filter on. Look for DIP during opening drive exhaustion and TOP near late-session fatigue.
Swing equities/FX: Dynamic or Fibonacci with moderate sensitivity. Keep Trend Filter on to only take dips above the 200-EMA and tops below it.
Countertrend scouts: Lower Min Dip Depth % / Min Top Rise % slightly, but raise Min Quality Score to compensate.
Reading the chart
Lines: “Dip Support” and “Top Resistance” are the current actionable rails, lightly smoothed to reduce flicker.
Signals: “DIP” prints below bars when a qualified dip appears, “TOP” prints above for qualified tops.
Scores: Optional labels show the composite at signal time. Favor higher numbers, especially when aligned with higher-timeframe trend.
Background hints: Light highlights mark raw touches meeting depth/extension, even if they fail quality. Treat these as early warnings.
Tuning tips
If you get too many false DIP signals in downtrends, raise Min Dip Depth % and keep Trend Filter on.
If tops appear late in squeezes, lower Top Sensitivity slightly or switch top side to Fibonacci .
On assets with erratic volume, prefer Volatility or Dynamic methods and down-weight the Volume Filter .
For strict systems, increase Min Quality Score and require both Volume and Momentum filters.
What this is not
It is not a blind reversal signal. It’s a structured context tool. Combine with your risk plan and higher-timeframe map.
It is not a guarantee of mean reversion. In strong trends, expect fewer, higher-score opportunities and respect invalidation quickly.
Suggested presets
Scalp preset: Lookback 30–40, Sensitivity 1.2–1.5, Quality ≥ 55, Volume & Momentum filters ON.
Swing preset: Lookback 75–100, Sensitivity 1.0–1.2, Quality ≥ 70, Trend & Volume filters ON.
Chop preset: Volatility/Volume-Weighted methods, Quality ≥ 60, Momentum filter ON, RSI emphasis.
Input quick reference
Dip/Top Method: Choose the model for each side or “Hybrid” to blend.
Lookback: Swing window the levels are built from.
Sensitivity: Scales volatility padding around levels.
Min Dip Depth % / Min Top Rise %: Minimum breach/extension to qualify.
Quality Filters: Trend, Volume, Momentum toggles, plus Min Quality Score gate.
Visuals: Colors and whether to print score labels.
Best practices
Map higher-timeframe trend first, then act on lower-timeframe DIP/TOP in the trend’s favor.
Use the score as triage. Skip mediocre prints into news or at session open unless score is exceptional.
Pre-define stop placement relative to the level you used. If a DIP fails, exit on loss of structure rather than waiting for the next print.
Bottom line: Top Finder & Dip Hunter codifies where reversals are most defensible and only flags the ones with supportive context. Tune the method and filters to your market, then let the score keep your playbook disciplined.

RSI-Multi-Timeframe This is an upgraded version of RSI upgraded to V6 with Multil TimeFame display for signals of exhausted or strong buying or selling force to help transactions have a more stable RR ratio.

Pulse RSI | Lyro RSPulse RSI | Lyro RS
The Pulse RSI is a momentum oscillator that enhances the traditional RSI by incorporating volume-weighted price and linear regression. It generates multiple trading signals, including trend shifts, overbought/oversold conditions, and custom threshold levels.
By integrating both price and volume into its calculation, Pulse RSI is more robust and responsive than the standard RSI. This helps you identify trends faster, spot potential reversals sooner, and set up custom alerts based on your own strategy.
Key Features
Four Signal Types:
Type 1 (Trend): Triggers when the indicator's current value crosses its previous value, highlighting short-term momentum shifts.
Type 2 (Midline Trend): The classic midline cross. A bullish bias is indicated above 50, while a bearish bias is indicated below 50.
Type 3 (Overbought/Oversold): Flags potential reversal zones, suggesting where buying or selling opportunities may emerge.
Type 4 (Custom Thresholds): This type lets you define your own threshold levels. Instead of following a trend, use it to mark your specific conditions for a reversal. For example, set a long reversal at a low level (e.g., 5) for an early buy signal, or a short reversal at a high level (e.g., 80) for an early sell signal.
Calculation Method:
The indicator uses a volume-weighted price (Close * High * Low) and applies linear regression to smooth the data. This creates a unique and more stable oscillator, avoiding the chaotic movement seen in others.
Color System:
Choose from multiple color themes like Classic, Mystic, Accented, and Royal, or create your own custom colors for bullish and bearish signals.
Visual Plotting:
Features a clear plot with a glow effect, a midline, adjustable threshold lines, and shapes/labels to mark long/short and overbought/oversold signals.
Alerts:
Instant alerts are available for every signal type, which you can quickly enable based on your trading conditions.
How It Works:
Core Calculation
The indicator calculates a volume-weighted price using (Close * High * Low) multiplied by the absolute volume. This value is then smoothed with linear regression and converted into an oscillator, normalized to a 0-100 scale.
Trading Logic:
Bullish Signals: Trigger when the main plot line crosses above a key level—be it the previous value, the 50 midline, or a custom threshold.
Bearish Signals: Trigger when the main plot line crosses below a key level.
Visual Logic:
The system displays a main plot line, colors candles, and plots signal shapes, all customizable through a variety of color schemes.
Practical Use
Trend Confirmation (Types 1 & 2): Use Type 1 for early momentum shifts and Type 2 to confirm the overall trend direction.
Reversals (Type 3): Consider long entries when oversold signals fire, suggesting an asset is undervalued. Look for exits at overbought signals, which suggest a potential downward reversal.
Custom Thresholds (Type 4): Set tight thresholds to catch early trends and reversals. Be aware that more sensitive settings may also increase false positives.
Customization:
Adjust the Length: A higher setting makes the indicator more suited for long-term trends, while a lower setting makes it more sensitive for short-term moves.
Enable/Disable Signals: Turn the four signal types on or off to match your trading style.
Set Your Levels: Fully adjustable thresholds for Type 4 long/short conditions.
Choose Your Colors: Select from a variety of color schemes for all bullish and bearish elements.
⚠️ Disclaimer
This indicator is a tool for technical analysis and does not guarantee results. It should be used alongside other analysis methods and solid risk management practices. The creators are not responsible for any financial decisions made based on its signals.

Cumulative Delta_Effort vs Result_immy**Cumulative Delta Oscillator\_effort**
This script creates a “Cumulative Delta Effort vs Result” oscillator, a custom indicator designed to measure the balance between buying and selling pressure (Effort) versus actual price movement (Result).
**How It Works**
Delta Volume: Measures aggressive buying vs selling per candle.
Cumulative Delta: Tracks net buying/selling pressure over time.
Effort vs Result: Compares volume delta (effort) to price movement (result).
Oscillator: Highlights divergence between effort and result, useful for spotting absorption (high effort, low result) and exhaustion (low effort, high result).
Histogram: Visual cue for accumulation/distribution zones.
----------------------------
This indicator combines volume delta (effort) and price movement (result), so it tells you how efficiently volume is moving price — a concept sometimes called effort vs. result analysis in Wyckoff or volume–spread analysis (VSA).
🔍 Concept Summary
Effort (delta volume) = how much buying/selling pressure is there (volume side).
Result (price change) = how much that effort moves price (price side).
Oscillator (Effort − Result) = how much “extra” effort is not producing movement — often showing absorption or exhaustion.
📈 How to Interpret the Signals
1\. Oscillator above Signal line → Bullish Momentum
When osc > signal, histogram turns green.
Means buying effort is stronger than price reaction — often early sign of accumulation or rising demand.
This can signal:
Possible bullish continuation if confirmed by rising prices.
Or early absorption if prices aren’t yet breaking out (smart money absorbing supply).
✅ Bullish Entry Signal:
When the oscillator crosses above the signal line (green cross) and price is near support or consolidating → potential long setup.
2\. Oscillator below Signal line → Bearish Momentum
When osc < signal, histogram turns red.
Selling effort dominates; can mean increasing supply or price exhaustion.
This often appears before:
Bearish continuation (trend strengthening)
Or upthrust/exhaustion (price rising on weak volume)
❌ Bearish Entry Signal:
When the oscillator crosses below the signal line (red cross), especially if near resistance → potential short setup.
3\. Crossovers
The alert is triggered when: ta.cross(osc, signal)
That means:
Bullish crossover: oscillator line crosses above signal → potential buy momentum shift.
Bearish crossover: oscillator line crosses below signal → potential sell momentum shift.
These work like MACD crossovers, but volume-adjusted.
4\. Zero Line
The zero line is the neutral point.
When osc crosses above zero, overall buying effort exceeds price change — market gaining strength.
When osc crosses below zero, selling pressure increases — market weakening.
→ Combining signal line crosses with zero-line crosses gives stronger confirmation.
5\. Histogram Analysis (Absorption \& Exhaustion)**
Tall green bars: rising momentum (buyers dominate)
Tall red bars: falling momentum (sellers dominate)
Shrinking bars: momentum fading — possible reversal zone.
If volume increases but price stalls, oscillator may spike while price stays flat — absorption (big players taking the opposite side).
If price surges but oscillator weakens, exhaustion — move running out of volume support.
------------------------------------------------------------------------
🧠 Practical Strategy Example
Situation What It Might Mean Possible Action
Oscillator crosses above signal near support Buyer effort increasing, price may rise Go long / close shorts
Oscillator crosses below signal near resistance Seller effort rising, price may drop Go short / take profits
Oscillator high but price flat Absorption (big players absorbing supply) Wait for breakout confirmation
Oscillator low but price flat Absorption (demand absorbing supply) Look for bullish reversal
Oscillator diverges from price Volume–price divergence Early warning of reversal
⚙️ Best Practice
Works best on volume-sensitive assets (futures, crypto, forex tick data).
**Combine with:**
Price structure (support/resistance)
Volume profile / delta footprint
Candle confirmation
We’ll go through both bullish and bearish examples so you can see how to trade with it in real market context.
---------------------------------------------------------------------------------
🟩 Example 1 — Bullish Setup (Long Trade)
Step 1. Context: Identify Potential Support Zone
Before relying on any indicator, find support using:
Previous swing low
Demand zone
VWAP / volume profile node
Trendline or moving average
👉 You’re looking for a place where buyers might step in.
Step 2. Wait for Oscillator Signal
Watch the oscillator panel:
The oscillator (green line) has been below the signal line (orange) → bearish phase.
Then it crosses above the signal line and the histogram turns green.
This means:
➡️ Buying “effort” is increasing faster than price reaction — momentum shift upward.
Step 3. Confirm with Price
On your chart:
Candle closes above short-term resistance or above previous candle high
Ideally volume confirms (green candle with increasing volume)
✅ Bullish Entry Condition
osc crosses above signal
price closes above local resistance
Step 4. Entry \& Stop
Entry: Next candle open after confirmation cross
Stop-loss: Below recent swing low or support zone
Take profit:
2R or 3R target
or near next resistance level
🧠 Optional filter: Only take the trade if oscillator is rising from below zero (coming out of weakness).
Step 5. Manage Trade
If oscillator flattens or starts curling down → tighten stop
If it crosses below the signal again → consider exit
Example Interpretation:
Oscillator crosses above signal from -200 to +100, histogram turns green, price breaks a resistance line → strong bullish reversal → enter long.
🟥 Example 2 — Bearish Setup (Short Trade)
Step 1. Context: Find Resistance
Look for: Prior swing high
Supply zone
Major moving average
Trendline top
Step 2. Wait for Oscillator Cross Down
The oscillator (green) crosses below the signal line (orange).
Histogram turns red.
This means:
➡️ Selling effort is rising relative to price movement — bearish pressure.
Step 3. Confirm with Price
Price fails to make higher highs, or
Forms a bearish engulfing candle near resistance.
✅ Bearish Entry Condition
osc crosses below signal
price confirms with bearish candle
Step 4. Entry \& Stop
Entry: On next candle open
Stop-loss: Above resistance or recent swing high
Take profit: 2R or more or at next major support
Step 5. Exit on Opposite Signal
If oscillator crosses back above signal → momentum shift → exit short.
⚙️ Pro Tips
Tip Why It Matters
Use on 15m–4H+ charts More reliable delta signal
Combine with volume or OBV Confirms “effort” strength
Watch divergences Early reversals
Align with higher timeframe trend Avoid countertrend traps
-------------------------------------------------------------------------------------------------
🧩 Quick Checklist
Step Condition Action
1 Identify zone (support/resistance) Mark area
2 Oscillator crossover Prepare order
3 Candle confirmation Enter
4 Stop-loss \& target Manage risk
5 Opposite cross Exit
Please follow and like if you appreciate my work. thank you.

SR-ZnV2There are many support and resistance scripts out there. I was unable to find one that met all of my needs so I have expanded on the closest ones that I was able to discover. The ability to show persistent S/R levels by volume at various time frames automates much of the process for the user with unique and customizable features, the lastest dated of which are displayed by its time frame support/resistance strength and extend toward the right of the screen where they can be seen more clearly by price .
// Original script is thanks to tommyf1001, synapticex and additional modifications is thanks to Lij_MC. Credit to both of them for most of the logic behind this script. Since then I have made many changes to this script as noted below.
// Changed default S/R lines from plots to lines, and gave option to user to change between solid line, dashed line, or dotted line for both S/R lines.
// Added additional time frame and gave more TF options for TF1 other than current TF. Now you will have 4 time frames to plot S/R zones from.
// Gave user option to easily change line thickness for all S/R lines.
// Made it easier to change colors of S/R lines and zones by consolidating the options under settings (rather than under style).
// Added extensions to active SR Zones to extend all the way right.
// Added option to extend or not extend the previous S/R zones up to next S/R zone.
// Added optional time frame labels to active S/R zones, with left and right options as well as option to adjust how far to the right label is set.
// Fixed issue where the higher time frame S/R zone was not properly starting from the high/low of fractal. Now any higher time frame S/R will begin exactly at the High/Low points.
// Added to script a function that will prevent S/R zones from lower time frames displaying while on a higher time frame. This helps clean up the chart quite a bit.
// Created arrays for each time frame's lines and labels so that the number of S/R zones can be controlled for each time frame and limit memory consumption.
// New alert options added and customized alert messages.

ATR Daniel# ATR Daniel - Indicator Description
## 🇬🇧 ENGLISH VERSION
### ATR Daniel - Smart Trailing Stop Manager
**ATR Daniel** is an intelligent trailing stop indicator that automatically adapts to your trading style and the asset you're trading.
#### Key Features:
**🎯 3 Trading Modes:**
- **Swing Trading** - For position trading with wider stops
- **Intraday** - For day trading with balanced parameters
- **Scalping** - For quick trades with tight stops
**📊 Automatic Asset Detection:**
The indicator automatically recognizes 3 major assets and applies optimized parameters:
- **XAUUSD (Gold)** - Lower volatility settings
- **BTCUSDT (Bitcoin)** - Medium volatility settings
- **NAS100USD (Nasdaq 100)** - Higher volatility settings
**🔧 Flexible Configuration:**
- **Auto Mode**: Applies optimal parameters based on detected asset and selected trading mode
- **Manual Mode**: Customize ATR length and multiplier to your preferences
- **Customizable Colors**: Choose your own line color
- **ON/OFF Display**: Toggle line visibility as needed
**📈 Visual Display:**
- Dynamic trailing stop line that follows price action
- Color changes based on trend direction (bullish/bearish)
- Real-time info table showing:
- Current asset
- Trading mode
- ATR value
- Stop loss distance
- Recommended SL price
- Current trend direction
- Signal arrows at trend reversals (optional)
**💡 How It Works:**
The indicator uses ATR (Average True Range) to calculate dynamic stop loss levels that adapt to market volatility. The trailing stop follows the price in trending markets while protecting your position.
**Perfect for:**
- Traders who want automated stop loss management
- Multi-asset traders (Gold, Bitcoin, Nasdaq)
- All trading styles (Swing, Intraday, Scalping)
---

Target Trend + Filter Toggles [ChadAnt] V3Minor Update that allows the user to adjust the size of the stop loss.
Indicator Overview and Core Logic CREDIT TO BIGBELUGA FOR THE MAIN INDICATOR
The indicator, named "Target Trend + Filter Toggles", is an overlay that draws directly on the price chart.
1. Core Trend Detection (Modified SMA Channel)
The indicator uses a primary trend-following mechanism based on a custom channel built with Simple Moving Averages (SMAs) and Average True Range (ATR):
SMA High: ta.sma(high, length) + atr_value
SMA Low: ta.sma(low, length) - atr_value
The length is set by the user (default 20).
The atr_value is a smoothed ATR (SMA of ATR(200), multiplied by 0.8), acting as an offset to create a channel around the price action.
Trend Logic:
Uptrend (trend=true): When the close price crosses over the sma_high line.
Downtrend (trend=false): When the close price crosses under the sma_low line.
Visual Trend: The candles are colored based on this determined trend, and the SMA High/Low lines are plotted.
2. Signal Generation (Raw vs. Filtered)
Raw Signal: A raw signal (signal_up_raw or signal_down_raw) is triggered simply when the core trend logic changes (e.g., trend changes from down to up).
Filtered Signal: The final buy/sell signal (signal_up or signal_down) is triggered only when the raw signal is true AND all currently active filter toggles are confirmed within a specified filter_lookback period (default 3 bars).
⚙️ Filter Toggles and Calculations
The script includes an extensive system of boolean (on/off) toggles for various popular technical indicators, allowing the user to customize which filters must be confirmed for a signal to be valid.
FILTER CATEGORIES:
MACD,
VOLUME,
STOCHRSI,
AWESOME OSCILLATOR,
MOVING AVERAGE,
VWAP,
COUNTERTREND MA
COUNTERTREND VWAP
The script uses a for loop to check if the required confirmation happened within the last filter_lookback number of bars.
🎯 Target and Stop-Loss Levels
Upon a valid filtered signal (signal_up or signal_down), the indicator uses an extensive user-defined type (TrendTargets) and a custom draw_targets method to draw potential trade management lines:
Entry Price: The close price of the bar where the filtered signal occurred.
Stop Loss (SL):
For a Long signal: The sma_low line (the lower band of the trend channel).
For a Short signal: The sma_high line (the upper band of the trend channel).
Profit Targets (T1, T2, T3): These are calculated based on the ATR multiplier (atr_value) and an adjustable user input called target (default 1).
Targets are a multiple of atr_value added to (for longs) or subtracted from (for shorts) the Entry Price.
T1: Entry +/- (5 + target) * atr_value
T2: Entry +/- (10 + target * 2) * atr_value
T3: Entry +/- (15 + target * 3) * atr_value
These levels are plotted as extended lines with corresponding labels (e.g., "SL," "Entry," "T1"). The script also includes logic to mark targets with a "✔" and the stop-loss with an "✖" if the price hits those levels.
🎨 Visualization
The script provides clear visual cues:
Candle Coloring: Candles are colored with up_color (Green/Teal) for an uptrend and dn_color (Brown/Orange) for a downtrend.
Trend Lines: The sma_high and sma_low lines are plotted and subtly shaded between the price action.
Signal Shapes: A filtered signal triggers a set of two colored triangles (one small solid, one large transparent) plotted below the low for a long signal and above the high for a short signal.
Trade Zones: The area between the Stop Loss and the Entry line is shaded in the counter-trend color, and the area between the Entry line and the T3 line is shaded in the trend color.
This indicator is essentially a complete trading system that uses a combination of an ATR-based trend channel for entries, a multitude of technical indicators for confirmation, and an ATR-based system for trade management (SL/TPs).
Would you like me to focus on a specific filter's logic, or perhaps help you configure the indicator's inputs for a certain trading style?

Target Trend + Filter Toggles [ChadAnt] V2Minor Update that allows the user to add/remove profit targets!
Indicator Overview and Core Logic CREDIT TO BIGBELUGA FOR THE MAIN INDICATOR
The indicator, named "Target Trend + Filter Toggles", is an overlay that draws directly on the price chart.
1. Core Trend Detection (Modified SMA Channel)
The indicator uses a primary trend-following mechanism based on a custom channel built with Simple Moving Averages (SMAs) and Average True Range (ATR):
SMA High: ta.sma(high, length) + atr_value
SMA Low: ta.sma(low, length) - atr_value
The length is set by the user (default 20).
The atr_value is a smoothed ATR (SMA of ATR(200), multiplied by 0.8), acting as an offset to create a channel around the price action.
Trend Logic:
Uptrend (trend=true): When the close price crosses over the sma_high line.
Downtrend (trend=false): When the close price crosses under the sma_low line.
Visual Trend: The candles are colored based on this determined trend, and the SMA High/Low lines are plotted.
2. Signal Generation (Raw vs. Filtered)
Raw Signal: A raw signal (signal_up_raw or signal_down_raw) is triggered simply when the core trend logic changes (e.g., trend changes from down to up).
Filtered Signal: The final buy/sell signal (signal_up or signal_down) is triggered only when the raw signal is true AND all currently active filter toggles are confirmed within a specified filter_lookback period (default 3 bars).
⚙️ Filter Toggles and Calculations
The script includes an extensive system of boolean (on/off) toggles for various popular technical indicators, allowing the user to customize which filters must be confirmed for a signal to be valid.
FILTER CATEGORIES:
MACD,
VOLUME,
STOCHRSI,
AWESOME OSCILLATOR,
MOVING AVERAGE,
VWAP,
COUNTERTREND MA
COUNTERTREND VWAP
The script uses a for loop to check if the required confirmation happened within the last filter_lookback number of bars.
🎯 Target and Stop-Loss Levels
Upon a valid filtered signal (signal_up or signal_down), the indicator uses an extensive user-defined type (TrendTargets) and a custom draw_targets method to draw potential trade management lines:
Entry Price: The close price of the bar where the filtered signal occurred.
Stop Loss (SL):
For a Long signal: The sma_low line (the lower band of the trend channel).
For a Short signal: The sma_high line (the upper band of the trend channel).
Profit Targets (T1, T2, T3): These are calculated based on the ATR multiplier (atr_value) and an adjustable user input called target (default 1).
Targets are a multiple of atr_value added to (for longs) or subtracted from (for shorts) the Entry Price.
T1: Entry +/- (5 + target) * atr_value
T2: Entry +/- (10 + target * 2) * atr_value
T3: Entry +/- (15 + target * 3) * atr_value
These levels are plotted as extended lines with corresponding labels (e.g., "SL," "Entry," "T1"). The script also includes logic to mark targets with a "✔" and the stop-loss with an "✖" if the price hits those levels.
🎨 Visualization
The script provides clear visual cues:
Candle Coloring: Candles are colored with up_color (Green/Teal) for an uptrend and dn_color (Brown/Orange) for a downtrend.
Trend Lines: The sma_high and sma_low lines are plotted and subtly shaded between the price action.
Signal Shapes: A filtered signal triggers a set of two colored triangles (one small solid, one large transparent) plotted below the low for a long signal and above the high for a short signal.
Trade Zones: The area between the Stop Loss and the Entry line is shaded in the counter-trend color, and the area between the Entry line and the T3 line is shaded in the trend color.
This indicator is essentially a complete trading system that uses a combination of an ATR-based trend channel for entries, a multitude of technical indicators for confirmation, and an ATR-based system for trade management (SL/TPs).
Would you like me to focus on a specific filter's logic, or perhaps help you configure the indicator's inputs for a certain trading style?

Jackpot_By_Rao_Gs_Swng_Pbls🎯 Description
Jackpot_By_Rao_Gs_Swng_Pbls is a precision-based intraday and swing trading automation tool designed for NIFTY options, built to identify high-probability BUY CE and BUY PE opportunities.
The script automatically tracks ITM (In-the-Money) option pairs derived from the live NIFTY spot price and calculates breakout/breakdown setups based on recent swing highs and lows, EMA alignment, and RSI confirmation.
Once a valid breakout condition is met, the script generates:
Visual chart signals with complete trade details (Entry, Stop Loss, Targets)
Dynamic JSON alerts for webhook-based auto order placement
Automated trade management (Target, SL, and Exit logic)
It’s optimized for traders using Dhan API or compatible webhook integrations, enabling one-click or automated trade execution directly from TradingView alerts.
⚙️ Core Features
✅ Auto-calculates current ATM and ITM strike codes based on today’s open price
✅ Identifies breakout/breakdown trades from the previous swing levels
✅ Dynamic EMA-based trend filter (EMA 20 vs EMA 50)
✅ RSI check for directional strength (internally calculated)
✅ Full trade details shown on the chart with 5 target levels
✅ Auto JSON alert generation with webhook-ready payload
✅ Built-in Stop Loss and Exit handling logic
✅ Visual markers for CE (Green arrows) and PE (Red arrows)
✅ Adjustable parameters for expiry date, open price, and swing length
📈 Trade Logic Overview
🔹 BUY CE Condition (Bullish Setup):
EMA20 > EMA50 → Bullish trend confirmation
Spot closes below recent swing low
CE Option price below its recent high
Confirmation candle closes above previous open (if green) or above midpoint (if red)
🔹 BUY PE Condition (Bearish Setup):
EMA50 > EMA20 → Bearish trend confirmation
Spot closes above recent swing high
PE Option price below its recent high
Confirmation candle closes below previous close/midpoint depending on color
Each signal automatically plots a BUY label on the chart showing:
Entry Price
Stop Loss
Targets 1–5
Strike Code
Trigger Time |
