Bull/Bear/Consolidation Zones Hariss 369This indicator helps to identify bullish, bearish, and consolidation zones using EMA and ATR-based calculations. It visually highlights zones on the chart and provides buy and sell signals with ATR-based stop-loss (SL) and take-profit (TP) levels.
Key Features:
EMA Trend Filter: Determines the direction of the market.
Bull / Bear / Consolidation Zones: Colored zones to easily spot market phases.
ATR-Based SL & TP: Automatic calculation for each trade signal.
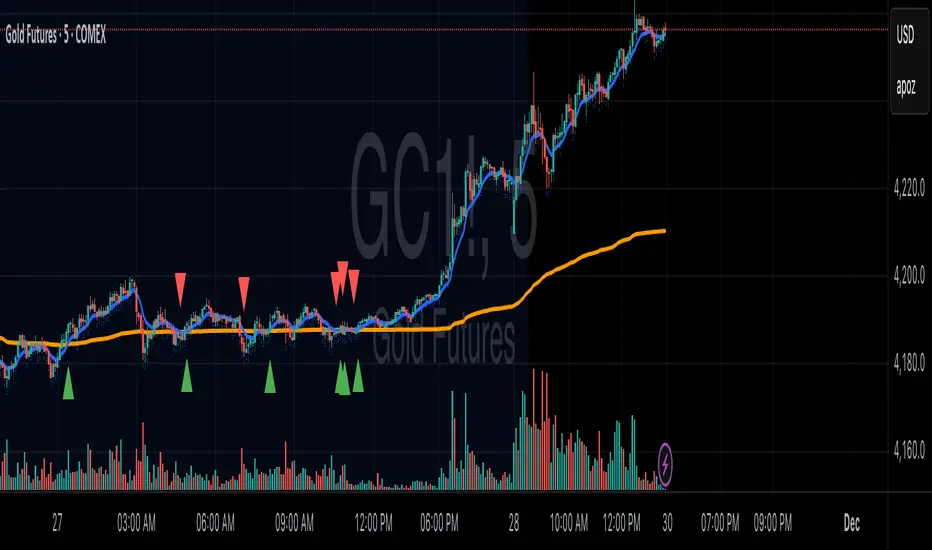
Buy / Sell Signals: Based on price relative to EMA and consolidation zones.
Relative Volume (RVOL) Filter: Optional filter to trade only when volume is significant, helping reduce low-probability signals.
Extended Zones: Option to extend zones forward until a breakout occurs.
Customizable Inputs: EMA length, ATR length, multipliers, RVOL period & multiplier, and toggle RVOL filter.
How to Use:
Identify bull/bear/consolidation zones on your chart. (These are already there) You can change the line as well zone color according to your needs.
Look for buy signals above EMA and consolidation zone, or sell signals below EMA and consolidation zone. The buy and sell labels are already there.
Confirm with RVOL filter (optional) to ensure higher volume support.
Use the plotted SL and TP levels for trade management.
This tool is designed for trend-following and market structure traders who want a visual guide to high-probability trading zones combined with volume confirmation.
One can also trail with EMA in trending market.
Pine Script® indicator