ICT index correlated market indicatorThis is not a real indicator, but is what ICT use as indicator for trading futures indexes.
it can only display SP500, Dow Jon Industrial Average and Nasdaq, if someone want other market can copy the code and change some parameters (is more easy than it can appear)
A good idea is using this other market on backtest to confirm the divergence idea of Linda Raske, than use it to spot quickly in real market.
Another idea published by ICT is the "hidden entry pattern", the entry signal appear in ES or YM but I trade NQ for volatility, so I use the trigger of SP500 or Dow to enter in Nasdaq.
Rember always don't trust anybody, do your own backtest and research!
Wave Analysis
Money Maykah -- DC-ATR , Stochastic RSI signals v.1-89 --This indicator shows the Stochastic RSI (SSRI) for overbought when the Donchian Channel (DC) is in the upper zone (between basis and upper), and SSRI for oversold when the DC is in the lower zone.
The DC upper and lower have a percentage of the ATR added I call this DC-ATR.
There can be numerous ways to form a strategy based on this. For a bull trend, an ABCD could be traced by A/C = blue signals and B/D = red signals.
Let me know what you think or if there is something wrong with the code. It's probably not the cleanest or more efficient but I am not a pro. If you find a good way to make a strategy from the indicator let me know.
Hope you enjoy!
-Casey R

Adaptive Average Vortex Index [lastguru]As a longtime fan of ADX, looking at Vortex Indicator I often wondered, where is the third line. I have rarely seen that anybody is calculating it. So, here it is: Average Vortex Index - an ADX calculated from Vortex Indicator. I interpret it similarly to the ADX indicator: higher values show stronger trend. If you discover other interpretation or have suggestions, comments are welcome.
Both VI+ and VI- lines are also drawn. As I use adaptive length calculation in my other scripts (based on the libraries I've developed and published), I have also included the possibility to have an adaptive length here, so if you hate the idea of calculating ADX from VI, you can disable that line and just look at the adaptive Vortex Indicator.
Note that as with all my oscillators, all the lines here are renormalized to -1..1 range unlike the original Vortex Indicator computation. To do that for VI+ and VI- lines, I subtract 1 from their values. It does not change the shape or the amplitude of the lines.
Adaptation algorithms are roughly subdivided in two categories: classic Length Adaptations and Cycle Estimators (they are also implemented in separate libraries), all are selected in Adaptation dropdown. Length Adaptation used in the Adaptive Moving Averages and the Adaptive Oscillators try to follow price movements and accelerate/decelerate accordingly (usually quite rapidly with a huge range). Cycle Estimators, on the other hand, try to measure the cycle period of the current market, which does not reflect price movement or the rate of change (the rate of change may also differ depending on the cycle phase, but the cycle period itself usually changes slowly).
VIDYA - based on VIDYA algorithm. The period oscillates from the Lower Bound up (slow)
VIDYA-RS - based on Vitali Apirine's modification of VIDYA algorithm (he calls it Relative Strength Moving Average). The period oscillates from the Upper Bound down (fast)
Kaufman Efficiency Scaling - based on Efficiency Ratio calculation originally used in KAMA
Fractal Adaptation - based on FRAMA by John F. Ehlers
MESA MAMA Cycle - based on MESA Adaptive Moving Average by John F. Ehlers
Pearson Autocorrelation* - based on Pearson Autocorrelation Periodogram by John F. Ehlers
DFT Cycle* - based on Discrete Fourier Transform Spectrum estimator by John F. Ehlers
Phase Accumulation* - based on Dominant Cycle from Phase Accumulation by John F. Ehlers
Length Adaptation usually take two parameters: Bound From (lower bound) and To (upper bound). These are the limits for Adaptation values. Note that the Cycle Estimators marked with asterisks(*) are very computationally intensive, so the bounds should not be set much higher than 50, otherwise you may receive a timeout error (also, it does not seem to be a useful thing to do, but you may correct me if I'm wrong).
The Cycle Estimators marked with asterisks(*) also have 3 checkboxes: HP (Highpass Filter), SS (Super Smoother) and HW (Hann Window). These enable or disable their internal prefilters, which are recommended by their author - John F. Ehlers . I do not know, which combination works best, so you can experiment.
If no Adaptation is selected ( None option), you can set Length directly. If an Adaptation is selected, then Cycle multiplier can be set.
The oscillator also has the option to configure the internal smoothing function with Window setting. By default, RMA is used (like in ADX calculation). Fast Default option is using half the length for smoothing. Triangle , Hamming and Hann Window algorithms are some better smoothers suggested by John F. Ehlers.
After the oscillator a Moving Average can be applied. The following Moving Averages are included: SMA , RMA, EMA , HMA , VWMA , 2-pole Super Smoother, 3-pole Super Smoother, Filt11, Triangle Window, Hamming Window, Hann Window, Lowpass, DSSS.
Postfilter options are applied last:
Stochastic - Stochastic
Super Smooth Stochastic - Super Smooth Stochastic (part of MESA Stochastic ) by John F. Ehlers
Inverse Fisher Transform - Inverse Fisher Transform
Noise Elimination Technology - a simplified Kendall correlation algorithm "Noise Elimination Technology" by John F. Ehlers
Momentum - momentum (derivative)
Except for Inverse Fisher Transform , all Postfilter algorithms can have Length parameter. If it is not specified (set to 0), then the calculated Slow MA Length is used. If Filter/MA Length is less than 2 or Postfilter Length is less than 1, they are calculated as a multiplier of the calculated oscillator length.
More information on the algorithms is given in the code for the libraries used. I am also very grateful to other TradingView community members (they are also mentioned in the library code) without whom this script would not have been possible.

Head-on-CorrelationThis is a simple wrapper script to generate 40 different series of information along an increasing candle length. It plots the last data point, and repaints on each new candle, allowing one to see variations within series' values as the timeframe increases. This POV is looking not across a depth of field, but the wave as if it were moving towards you. The goal ultimately is to find correlations on various timeframes in the y-plane, and the z-plane, as well as patterns of variation preceding price action.
As a wrapper, the switch case and engine can and should be modified to suit your indicator of choice. Additionally, It is possible to string these indicators together to perform multiple calculations and output a single series ultimately.
If watched on smaller timeframes (eg 1s) or bar replay, it is an entertaining addition to the chart.

Adaptive MA Difference constructor [lastguru]A complimentary indicator to my Adaptive MA constructor. It calculates the difference between the two MA lines (inspired by the Moving Average Difference (MAD) indicator by John F. Ehlers). You can then further smooth the resulting curve. The parameters and options are explained here:
The difference is normalized by dividing the difference by twice its Root mean square (RMS) over Slow MA length. Inverse Fisher Transform is then used to force the -1..1 range.
Same Postfilter options are provided as in my Adaptive Oscillator constructor:
Stochastic - Stochastic
Super Smooth Stochastic - Super Smooth Stochastic (part of MESA Stochastic ) by John F. Ehlers
Inverse Fisher Transform - Inverse Fisher Transform
Noise Elimination Technology - a simplified Kendall correlation algorithm "Noise Elimination Technology" by John F. Ehlers
Momentum - momentum (derivative)
Except for Inverse Fisher Transform, all Postfilter algorithms can have Length parameter. If it is not specified (set to 0), then the calculated Slow MA Length is used.
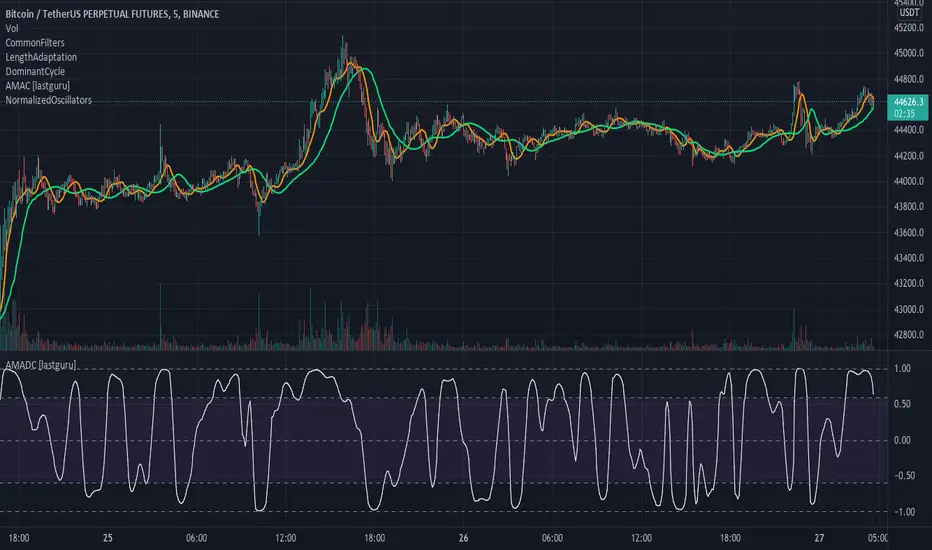
Adaptive Oscillator constructor [lastguru]Adaptive Oscillators use the same principle as Adaptive Moving Averages. This is an experiment to separate length generation from oscillators, offering multiple alternatives to be combined. Some of the combinations are widely known, some are not. Note that all Oscillators here are normalized to -1..1 range. This indicator is based on my previously published public libraries and also serve as a usage demonstration for them. I will try to expand the collection (suggestions are welcome), however it is not meant as an encyclopaedic resource , so you are encouraged to experiment yourself: by looking on the source code of this indicator, I am sure you will see how trivial it is to use the provided libraries and expand them with your own ideas and combinations. I give no recommendation on what settings to use, but if you find some useful setting, combination or application ideas (or bugs in my code), I would be happy to read about them in the comments section.
The indicator works in three stages: Prefiltering, Length Adaptation and Oscillators.
Prefiltering is a fast smoothing to get rid of high-frequency (2, 3 or 4 bar) noise.
Adaptation algorithms are roughly subdivided in two categories: classic Length Adaptations and Cycle Estimators (they are also implemented in separate libraries), all are selected in Adaptation dropdown. Length Adaptation used in the Adaptive Moving Averages and the Adaptive Oscillators try to follow price movements and accelerate/decelerate accordingly (usually quite rapidly with a huge range). Cycle Estimators, on the other hand, try to measure the cycle period of the current market, which does not reflect price movement or the rate of change (the rate of change may also differ depending on the cycle phase, but the cycle period itself usually changes slowly).
Chande (Price) - based on Chande's Dynamic Momentum Index (CDMI or DYMOI), which is dynamic RSI with this length
Chande (Volume) - a variant of Chande's algorithm, where volume is used instead of price
VIDYA - based on VIDYA algorithm. The period oscillates from the Lower Bound up (slow)
VIDYA-RS - based on Vitali Apirine's modification of VIDYA algorithm (he calls it Relative Strength Moving Average). The period oscillates from the Upper Bound down (fast)
Kaufman Efficiency Scaling - based on Efficiency Ratio calculation originally used in KAMA
Deviation Scaling - based on DSSS by John F. Ehlers
Median Average - based on Median Average Adaptive Filter by John F. Ehlers
Fractal Adaptation - based on FRAMA by John F. Ehlers
MESA MAMA Alpha - based on MESA Adaptive Moving Average by John F. Ehlers
MESA MAMA Cycle - based on MESA Adaptive Moving Average by John F. Ehlers , but unlike Alpha calculation, this adaptation estimates cycle period
Pearson Autocorrelation* - based on Pearson Autocorrelation Periodogram by John F. Ehlers
DFT Cycle* - based on Discrete Fourier Transform Spectrum estimator by John F. Ehlers
Phase Accumulation* - based on Dominant Cycle from Phase Accumulation by John F. Ehlers
Length Adaptation usually take two parameters: Bound From (lower bound) and To (upper bound). These are the limits for Adaptation values. Note that the Cycle Estimators marked with asterisks(*) are very computationally intensive, so the bounds should not be set much higher than 50, otherwise you may receive a timeout error (also, it does not seem to be a useful thing to do, but you may correct me if I'm wrong).
The Cycle Estimators marked with asterisks(*) also have 3 checkboxes: HP (Highpass Filter), SS (Super Smoother) and HW (Hann Window). These enable or disable their internal prefilters, which are recommended by their author - John F. Ehlers . I do not know, which combination works best, so you can experiment.
Chande's Adaptations also have 3 additional parameters: SD Length (lookback length of Standard deviation), Smooth (smoothing length of Standard deviation) and Power ( exponent of the length adaptation - lower is smaller variation). These are internal tweaks for the calculation.
Oscillators section offer you a choice of Oscillator algorithms:
Stochastic - Stochastic
Super Smooth Stochastic - Super Smooth Stochastic (part of MESA Stochastic) by John F. Ehlers
CMO - Chande Momentum Oscillator
RSI - Relative Strength Index
Volume-scaled RSI - my own version of RSI. It scales price movements by the proportion of RMS of volume
Momentum RSI - RSI of price momentum
Rocket RSI - inspired by RocketRSI by John F. Ehlers (not an exact implementation)
MFI - Money Flow Index
LRSI - Laguerre RSI by John F. Ehlers
LRSI with Fractal Energy - a combo oscillator that uses Fractal Energy to tune LRSI gamma
Fractal Energy - Fractal Energy or Choppiness Index by E. W. Dreiss
Efficiency ratio - based on Kaufman Adaptive Moving Average calculation
DMI - Directional Movement Index (only ADX is drawn)
Fast DMI - same as DMI, but without secondary smoothing
If no Adaptation is selected (None option), you can set Length directly. If an Adaptation is selected, then Cycle multiplier can be set.
Before an Oscillator, a High Pass filter may be executed to remove cyclic components longer than the provided Highpass Length (no High Pass filter, if Highpass Length = 0). Both before and after the Oscillator a Moving Average can be applied. The following Moving Averages are included: SMA, RMA, EMA, HMA , VWMA, 2-pole Super Smoother, 3-pole Super Smoother, Filt11, Triangle Window, Hamming Window, Hann Window, Lowpass, DSSS. For more details on these Moving Averages, you can check my other Adaptive Constructor indicator:
The Oscillator output may be renormalized and postprocessed with the following Normalization algorithms:
Stochastic - Stochastic
Super Smooth Stochastic - Super Smooth Stochastic (part of MESA Stochastic) by John F. Ehlers
Inverse Fisher Transform - Inverse Fisher Transform
Noise Elimination Technology - a simplified Kendall correlation algorithm "Noise Elimination Technology" by John F. Ehlers
Except for Inverse Fisher Transform, all Normalization algorithms can have Length parameter. If it is not specified (set to 0), then the calculated Oscillator length is used.
More information on the algorithms is given in the code for the libraries used. I am also very grateful to other TradingView community members (they are also mentioned in the library code) without whom this script would not have been possible.

Adaptive MA constructor [lastguru]Adaptive Moving Averages are nothing new, however most of them use EMA as their MA of choice once the preferred smoothing length is determined. I have decided to make an experiment and separate length generation from smoothing, offering multiple alternatives to be combined. Some of the combinations are widely known, some are not. This indicator is based on my previously published public libraries and also serve as a usage demonstration for them. I will try to expand the collection (suggestions are welcome), however it is not meant as an encyclopaedic resource, so you are encouraged to experiment yourself: by looking on the source code of this indicator, I am sure you will see how trivial it is to use the provided libraries and expand them with your own ideas and combinations. I give no recommendation on what settings to use, but if you find some useful setting, combination or application ideas (or bugs in my code), I would be happy to read about them in the comments section.
The indicator works in three stages: Prefiltering, Length Adaptation and Moving Averages.
Prefiltering is a fast smoothing to get rid of high-frequency (2, 3 or 4 bar) noise.
Adaptation algorithms are roughly subdivided in two categories: classic Length Adaptations and Cycle Estimators (they are also implemented in separate libraries), all are selected in Adaptation dropdown. Length Adaptation used in the Adaptive Moving Averages and the Adaptive Oscillators try to follow price movements and accelerate/decelerate accordingly (usually quite rapidly with a huge range). Cycle Estimators, on the other hand, try to measure the cycle period of the current market, which does not reflect price movement or the rate of change (the rate of change may also differ depending on the cycle phase, but the cycle period itself usually changes slowly).
Chande (Price) - based on Chande's Dynamic Momentum Index (CDMI or DYMOI), which is dynamic RSI with this length
Chande (Volume) - a variant of Chande's algorithm, where volume is used instead of price
VIDYA - based on VIDYA algorithm. The period oscillates from the Lower Bound up (slow)
VIDYA-RS - based on Vitali Apirine's modification of VIDYA algorithm (he calls it Relative Strength Moving Average). The period oscillates from the Upper Bound down (fast)
Kaufman Efficiency Scaling - based on Efficiency Ratio calculation originally used in KAMA
Deviation Scaling - based on DSSS by John F. Ehlers
Median Average - based on Median Average Adaptive Filter by John F. Ehlers
Fractal Adaptation - based on FRAMA by John F. Ehlers
MESA MAMA Alpha - based on MESA Adaptive Moving Average by John F. Ehlers
MESA MAMA Cycle - based on MESA Adaptive Moving Average by John F. Ehlers, but unlike Alpha calculation, this adaptation estimates cycle period
Pearson Autocorrelation* - based on Pearson Autocorrelation Periodogram by John F. Ehlers
DFT Cycle* - based on Discrete Fourier Transform Spectrum estimator by John F. Ehlers
Phase Accumulation* - based on Dominant Cycle from Phase Accumulation by John F. Ehlers
Length Adaptation usually take two parameters: Bound From (lower bound) and To (upper bound). These are the limits for Adaptation values. Note that the Cycle Estimators marked with asterisks(*) are very computationally intensive, so the bounds should not be set much higher than 50, otherwise you may receive a timeout error (also, it does not seem to be a useful thing to do, but you may correct me if I'm wrong).
The Cycle Estimators marked with asterisks(*) also have 3 checkboxes: HP (Highpass Filter), SS (Super Smoother) and HW (Hann Window). These enable or disable their internal prefilters, which are recommended by their author - John F. Ehlers. I do not know, which combination works best, so you can experiment.
Chande's Adaptations also have 3 additional parameters: SD Length (lookback length of Standard deviation), Smooth (smoothing length of Standard deviation) and Power (exponent of the length adaptation - lower is smaller variation). These are internal tweaks for the calculation.
Length Adaptaton section offer you a choice of Moving Average algorithms. Most of the Adaptations are originally used with EMA, so this is a good starting point for exploration.
SMA - Simple Moving Average
RMA - Running Moving Average
EMA - Exponential Moving Average
HMA - Hull Moving Average
VWMA - Volume Weighted Moving Average
2-pole Super Smoother - 2-pole Super Smoother by John F. Ehlers
3-pole Super Smoother - 3-pole Super Smoother by John F. Ehlers
Filt11 -a variant of 2-pole Super Smoother with error averaging for zero-lag response by John F. Ehlers
Triangle Window - Triangle Window Filter by John F. Ehlers
Hamming Window - Hamming Window Filter by John F. Ehlers
Hann Window - Hann Window Filter by John F. Ehlers
Lowpass - removes cyclic components shorter than length (Price - Highpass)
DSSS - Derivation Scaled Super Smoother by John F. Ehlers
There are two Moving Averages that are drown on the chart, so length for both needs to be selected. If no Adaptation is selected ( None option), you can set Fast Length and Slow Length directly. If an Adaptation is selected, then Cycle multiplier can be selected for Fast and Slow MA.
More information on the algorithms is given in the code for the libraries used. I am also very grateful to other TradingView community members (they are also mentioned in the library code) without whom this script would not have been possible.

BULB indicatorIt gives very accurate buy and sell signal. These signals are mainly based on RSI. RSI > 50 indicator - Good Buy. RSI < 30 indicator - Strong Sell
Lev Umanov Sin EquationThis indicator is taken from the calculations made by Lev Umanov. It predicts the peaks of Bitcoin. The indicator works with most BTCUSD pairings.

PivotsLibrary "Pivots"
This Library focuses in functions related to pivot highs and lows and some of their applications (i.e. divergences, zigzag, harmonics, support and resistance...)
pivots(srcH, srcL, length) Delivers series of pivot highs, lows and zigzag.
Parameters:
srcH : Source series to look for pivot highs. Stricter applications might source from 'close' prices. Oscillators are also another possible source to look for pivot highs and lows. By default 'high'
srcL : Source series to look for pivot lows. By default 'low'
length : This value represents the minimum number of candles between pivots. The lower the number, the more detailed the pivot profile. The higher the number, the more relevant the pivots. By default 10
Returns:
zigzagArray(pivotHigh, pivotLow) Delivers a Zigzag series based on alternating pivots. Ocasionally this line could paint a few consecutive lows or highs without alternating. That happens because it's finding a few consecutive Higher Highs or Lower Lows. If to use lines entities instead of series, that could be easily avoided. But in this one, I'm more interested outputting series rather than painting/deleting line entities.
Parameters:
pivotHigh : Pivot high series
pivotLow : Pivot low series
Returns:
zigzagLine(srcH, srcL, colorLine, widthLine) Delivers a Zigzag based on line entities.
Parameters:
srcH : Source series to look for pivot highs. Stricter applications might source from 'close' prices. Oscillators are also another possible source to look for pivot highs and lows. By default 'high'
srcL : Source series to look for pivot lows. By default 'low'
colorLine : Color of the Zigzag Line. By default Fuchsia
widthLine : Width of the Zigzag Line. By default 4
Returns: Zigzag printed on screen
divergence(h2, l2, h1, l1, length) Calculates divergences between 2 series
Parameters:
h2 : Series in which to locate divs: Highs
l2 : Series in which to locate divs: Lows
h1 : Series in which to locate pivots: Highs. By default high
l1 : Series in which to locate pivots: Lows. By default low
length : Length used to calculate Pivots: By default 10
Returns:

Zig Zag(auto Horizon lines)A guy who automatically draws a horizon from the top of the zigzag
*Gray horizon may be repainted
The horizon of the characteristic price in the past reacts well, so it is used for contrarian
ジグザクの頂点から、自動で水平線を引く奴です
※灰色の水平線はリペイントする可能性があります
過去の特徴的な価格の水平線はよく反応するので、逆張りするとかが用途です

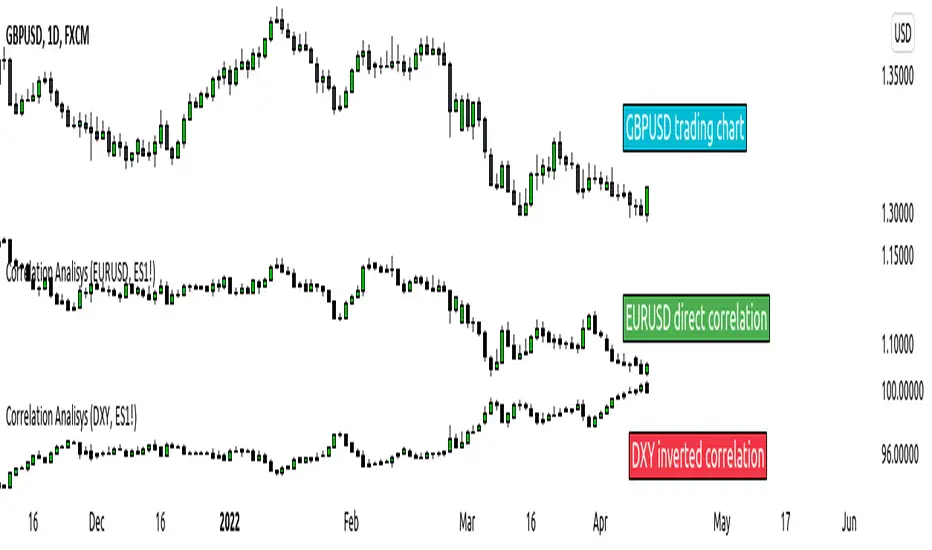
SARWThis indicator aims to indicate the correlation between two assets(Current and Base), it does NOT show entries or help your chart analysis directly.
The main features of this Correlation indicator is :
Correlation type : Direct Correlation | Inverse Correlation | No Correlation
Correlation Percentage : as its name, it calculate the Correlation Percentage between Current and base assets if exist
How to use: Chose the base asset (default: bitcoin) and open any other chart to be the other -Current- asset
inputs:
Max Lookback length : how many candles will be included in the scan.
Swing intensity : How many candle should be counted to confirm a Swing, If you are confused leave it as its default.
Base Asset : The base asset to calculate the current asset correlation with.
Important Notes:
As I promised, the previous correlation indicator used each candle alone, while this one uses waves and swings.
The Current asset has more power over the base, because it compares the Base to current, but not the opposite((E.g. if you want to check if some coin have correlation with bitcoin, it's better to use bitcoin and put the other coin name in the input field)).
For any notes on the indicator to be edited, or for another indicator ideas please comment.

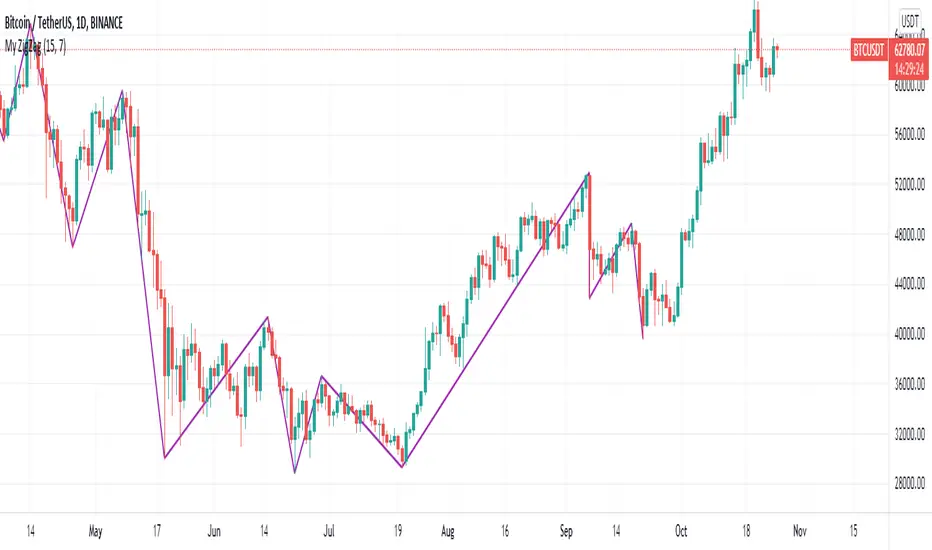
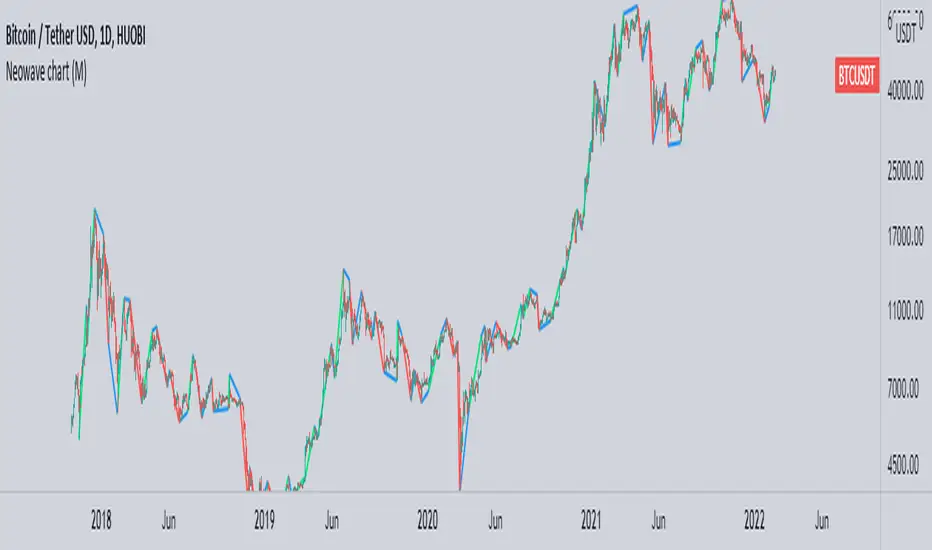
Wave Chart v1##Wave Chart v1##
For analyzing Neo-wave theory
Plot the market's highs and lows in real-time order.
Then connect the highs and lows
with a diagonal line. Next, the last plot of one day (or bar) is connected with a straight line to the
first plot of the next day (or bar).
##How To Use##
if you want a weekly chart you drop the time frame to the daily chart.
Then you set the range to 7(if the market opens 7 days per week).
Then you click "highlight the bar that runs to plot" and you must shift the highlight to the last day that the weekly chart bar close(Sunday / Friday)
##Example 1
Weekly chart BTCUSDT on BINANCE
first open daily chart, set range = 7 and Bars_shift = 3 (shift highlight to Sunday)
##Example 2
Weekly chart XAUUSD on FXOPEN
first open daily chart, set range = 5 (market open 5 days per week) and Bars_shift = 1 (shift highlight to Friday)
##Note##
If the market has a special holiday Wave Chart may be inaccurate.

Neowave chart cash dataScript Cash is a neo-analytic style data. Add to use on the chart and then hide the candlesticks and enjoy the cash data.
The daily data cache is set normally. To change the settings, be sure to change the D indicator to W for weekly and M for monthly.
Also enter the number of minutes to use in the hourly time frame, for example four hours (240)
...
When you change the data cache settings in the settings, you must follow the rule of one fortieth of the Neowave style and move the time frame chart to forty to analyze it, for example, for a daily time frame go to 30 minutes.
I hope it is used.
Renko Candles OverlayHello All,
For long time I got many request for Renko Candles and now here it's, Renko Candles Overlay . I tried to make almost everything optional, so you can play with the options as you want.
Let see the options:
Method: the option for brick scaling method: ATR, ATR/2, ATR/4, Percent, Traditional
- ATR Period: period for Average True Range and it's valid if the method is ATR
- ATR/2 Period: period for Average True Range and it's valid if the method is ATR/2
- ATR/4 Period: period for Average True Range and it's valid if the method is ATR/4
- Traditional: User-defined brick size, it's valid if the method is Traditional
- Percent: Percent of Close price, it's valid if the method is Percent
if the method is not Traditional (fixed brick size) then Brick size is calculated/updated when new bricks added. so The box sizes may be different because of the calculation is dynamic.
Levels & Lines for new Bricks: if you enable this option then the script shows the levels for new brick
Change Bar Color: optionally the script changes the bar color by using direction of the bricks
and some other options for coloring.
The script shows the bricks for visible area, which is approximately 280 candles. so if you change the width and number of the bricks then number of bricks that is shown is adjusted automatically to fit the screen. you can see the examples below:
The script shows the levels to new brick as a line and label:
Because of real-time bar is not confirmed until the candle close, the script shows the bricks as Unconfirmed , and unconfirmed bricks shown in different color:
You can change the width of the bricks (width is 10 in following example):
Optionally candle colors are changde by the direction of the bricks:
If you have any recommendation then please drop a comment under the script ;)
Enjoy!

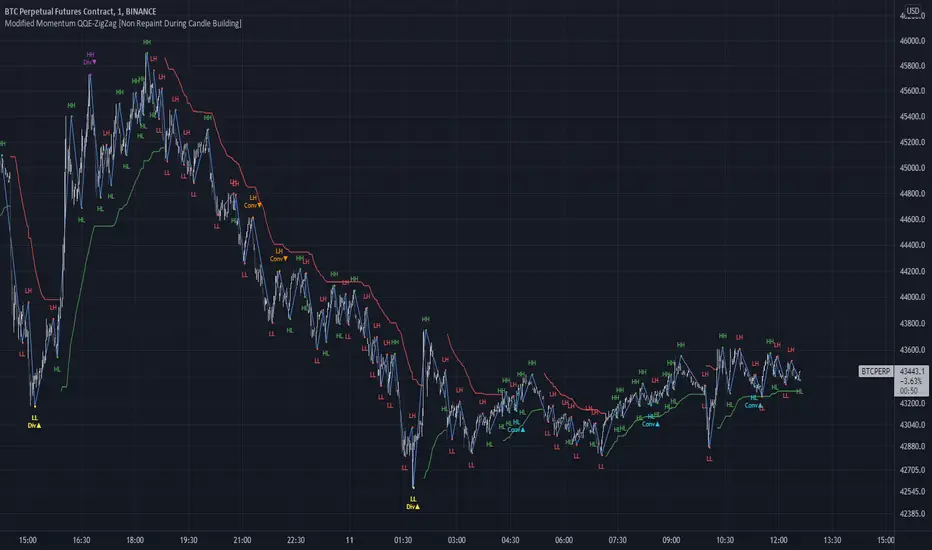
Modified QQE-ZigZag [Non Repaint During Candle Building]V V V V V V V Please Read V V V V V V V
I ask Peter and he is fine, that im published this script
Tell me if you have some ideas or criticism about that sricpt
>>>>>>>>>> This is a modified Version of Peter_O's Momentum Based ZigZag <<<<<<<<<<<
This is only a test, and i want to share it with the community
It works like other ZigZags
Because Peters_O's original Version is only non repaint on closed historical Data ,
during a Candle building process it can still repaint (signal appears / 21 seconds later signal disapears / 42 seconds later signal appears again in the same candle / etc.),
but that isnt important for backtesting, its only important for realtime PivotPoints during a candle.
My goal for this zigzag was to make it absolute non repaint neither during a candle building process (current candle),
so once the signal is shown there is no chance that it disapers and shown a few seconds later again on that same candle, it can only show up one time per candle an thats it,
and that makes it absolute non repaint in all time frames.
Credits to:
==> Thanks to @glaz , for bringing the QQE to Tradingview <3
==> Thanks to @Peter_O , for sharing his idea to use the QQE as base for a Zigzag
and for sharing his MTF RSI with the Community <3
Changes:
- I changed the MTF RSI a little bit, you can choose between two version
- I changed the QQE a little bit, its now using the MTF RSI , and its using High and Low values as Source to make it absolute non repaint during a candle is building
- I added a little Divergence Calculation beween price and the MTF RSI that is used for the ZigZag
Colors :
- Green for HH / HL Continuation
- Red for LL / LH Continuation
- Yellow for Positive Divergence
- Purple for Negative Divergence
Important:
It is not possible to backtest this script correctly with historical Data, its only possible in Realtime,
because the QQE is using crossunders with RSILowSource and the QQE Line to find the Tops and,
because the QQE is using crossovers with RSIHighSource and the QQE Line to find the Bottoms,
and that means it is not possible to find the correct Time/Moment when that crossovers / crossunders happens in historical Data
=============> So please be sure you understand the Calculation and Backtest it in Realtime when you want to use it,
because i didn't published this script for real trading
=============> Im not a financial advisor and youre using this script at your own risk
=============> Please do your own research
Cyclic RSI High Low With Noise Filter█ OVERVIEW
This indicator displays Cyclic Relative Strength Index based on Decoding the Hidden Market Rhythm, Part 1 written by Lars von Thienen.
To determine true or false for Overbought / Oversold are unnecessary, therefore these should be either strong or weak.
Noise for weak Overbought / Oversold can be filtered, especially for smaller timeframe.
█ FEATURES
Display calculated Cyclic Relative Strength Index.
Zigzag high low based on Cyclic Relative Strength Index.
Able to filter noise for high low.
█ LEGENDS
◍ Weak Overbought / Oversold
OB ▼ = Strong Overbought
OS ▲ = Strong Oversold
█ USAGE / TIPS
Recommend to be used for Harmonic Patterns such as XABCD and ABCD.
Condition 1 (XABCD) : When ▼ and ▲ exist side by side, usually this outline XA, while the next two ◍ can be BC.
Condition 2 (ABCD) : When ▼ and ▲ exist side by side, usually this outline AB, while the next one ◍ can be BC, strong ABCD.
Condition 3 (ABCD) : When ▼ or ▲ exist at Point A, the next two ◍ can be Point B and Point C, medium ABCD.
Condition 4 (ABCD) : When ◍ exist at Point a, the next two ◍ can be Point b and Point c, weak ABCD usually used as lower case as abcd.
█ CREDITS
LoneSomeTheBlue
WhenToTrade

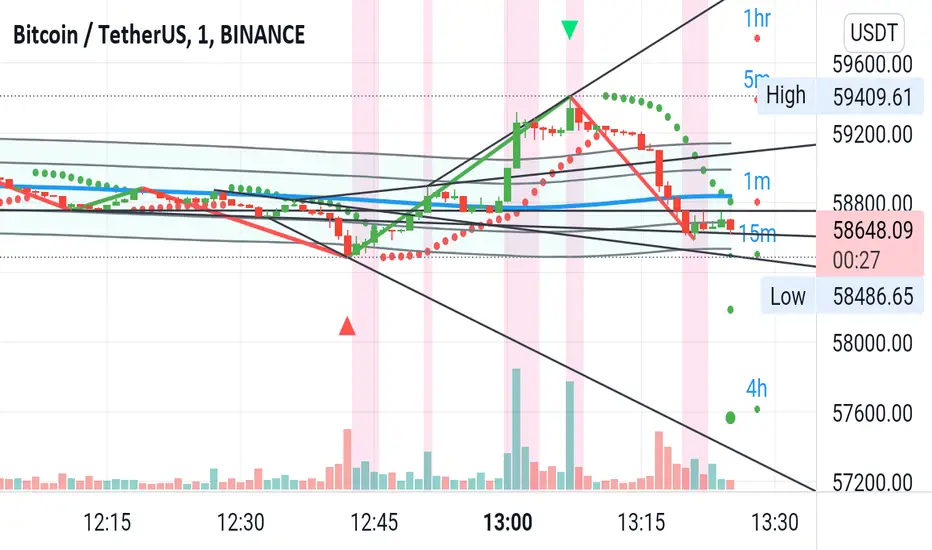
MA VisualizerThe MA Visualizer is made up of 5 Moving Averages (MA)
All MA change color when the price closes above or below the MA line.
The background between the MA line and price will also change color, this creates the Visualizer.
When two or more MA are selected the two visualizer's will combine and create a gradient effect.
Each MA can be adjusted with 6 source selection's to choose from (SMA , EMA , WMA , HMA , RMA , WVMA).
The Visualizer can be turned off while leaving the MA lines turned on and vice versa.
Their is also a MA Cross indicator built-in.

ZigZag WavesHello All,
I am here with a new idea and script, " Zigzag Waves ". This indicator creates 3 Zigzags with different lengths, keeps the lengths of each zigzag wave and calculates/draws average waves for each zigzag. optionally it can reset the wave when zigzag direction changes and new highest/lowest found. And optionally it draws Exponential Moving Average(EMA) of the sum of waves. This idea is very new and at the moment there is no optimization for the Zigzag Periods. Maybe we altogether can improve the idea and find the best zigzag periods for different symbols and time frames.
Using the options You can play with the periods, add/remove EMA, set its color and reset the waves on new Highest/Lowest. As far as I see resetting the waves on new Highest/Lowest may bring better results.
if we enable "Reset the waves on new Highest/Lowest":
Using different periods and EMA length:
P.S. if you have ideas to improve this script, drop a comment under the script please.
Enjoy!

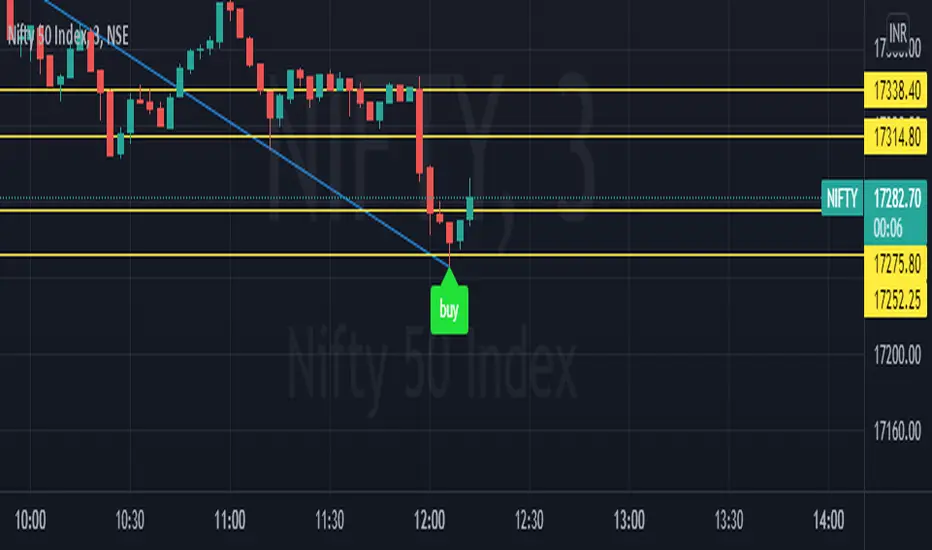
Intraday Grid trading exampleHello everyone,
This was a grid trading example for intraday trading.
Please be advised that every commodity have diferent kind of reaction and rate of change between periods therefore the percentages need to be adjusted acording to the commodities change %.
In order to specify the adjustment rate we add the Zig Zag in the script.
For Example ;
Last 3 days zigzag high points are %25 , %13 and %8 , the average %is about %9 therefore you have to put the adjustment ratios something like;
Z%1 = %3
Z%2 = %6
Z%3 = %9
Feel free to use the script with caution( it was not a investment advice), this was only a example of grid trading strategy on our trading platform.
Regards.
FunctionZigZagMultipleMethodsLibrary "FunctionZigZagMultipleMethods"
ZigZag Multiple Methods.
method(idx) Helper methods enumeration.
Parameters:
idx : int, index of method, range 0 to 4.
Returns: string
function(method, value_x, value_y) Multiple method ZigZag.
Parameters:
method : string, default='(MANUAL) Percent price move over X * Y', method for zigzag.
value_x : float, x value in method.
value_y : float, y value in method.
Returns: tuple with:
zigzag float
direction
reverse_line float
realtimeofpivot int

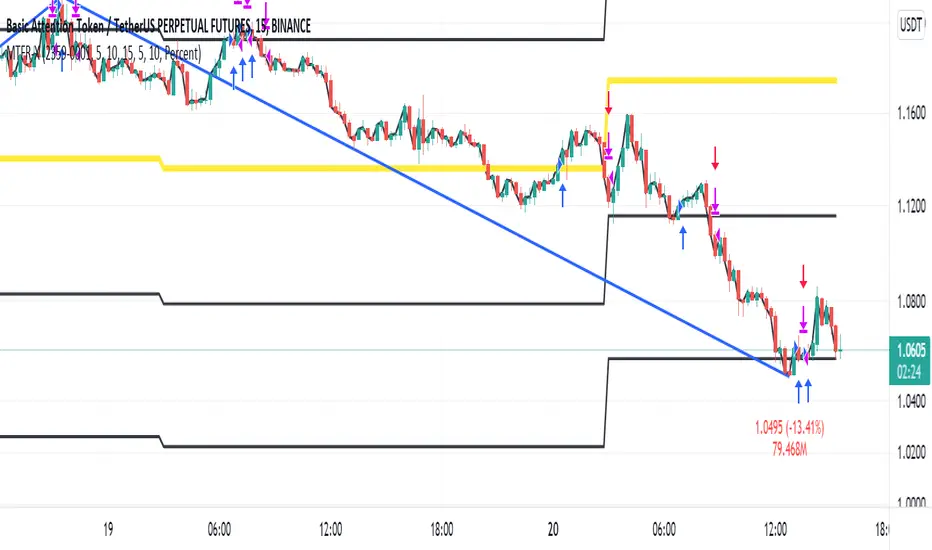
Jeges JigsThis is a combination of all my old indicators, with an added feature for trend lines (inspiration for this came from Wedge Maker script thanks to veryfid, I hope he doesn't mind).
This script looks for a period with increased volatility , as measured by ATR ( Average True Range ), then it looks for a high or a low in that area.
When price is above EMA (400 is default, can be changed), it looks for the highs and adds multiples of ATR to the high. Default values for multipliers are 3,9 and 27, meaning that the script will show 3xATR level above the high, 9xATR above the high and 27xATR above the high.
When price is below EMA it looks for the lows and subtracts multiples of ATR from the low.The script will show 3xATR level below the low, 9xATR below the low and 27xATR below the low.
Multipliers values can be changed as well, making it a versatile tool that shows potential levels of suppport/resistance based on the volatility .
Possible use cases:
Breakout trading, when price crosses a certain level, it may show potential profit targets for trades opened at a breakout.
Stoploss helper. Many traders use ATR for their stoplosses, 1 ATR below the swing low for long trades and 1 ATR above the swing high for short trades are common values used by many traders. In this case, the Lookback value comes handy, if we want to look maybe at a more recent value for swing high/low point.
It highlights ATR peaks, it also displays Bollinger bands of SMA400 (or Ema), breakouts for upper/lower bands.
Another thing you get is Parabolic SAR and Zigzag based on SAR.
ZigZag reSampledthis indicator looks like the default ZigZag indicator but it uses the price action instead of the deviation%