Weekly OHLC UpdatedWeekly OHLC first edit is to include a standard style. From here we'll be adding a few moving averages and a few other things I find helpful in both in crypto and FOREX trading.Pine Script® indicatorby RexDogActualUpdated 22554
Highs & Lows - Month, Day, Week - MasonA more readable monthly, daily, weekly HIGH LOW plotPine Script® indicatorby masonmahaffey0011132
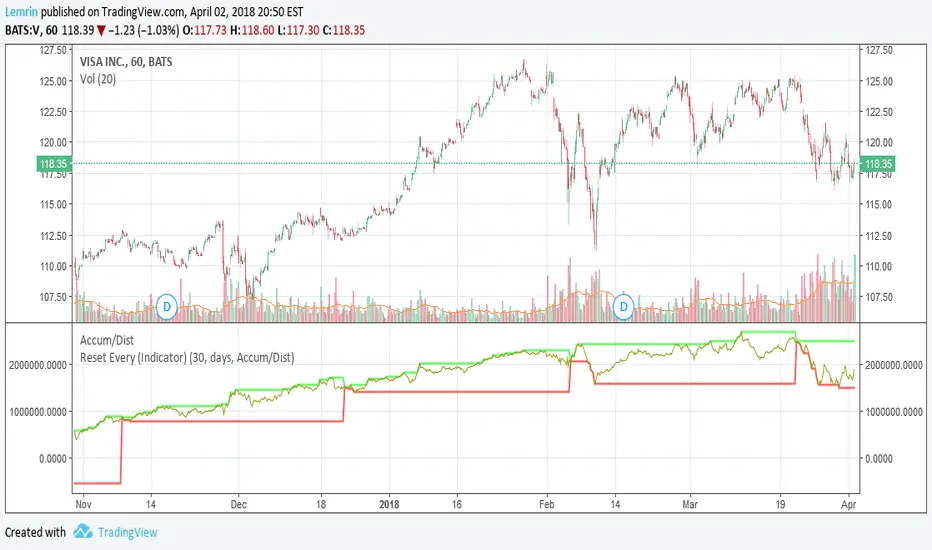
Reset Every (Indicator)Nearly identical to the price version , this configurable indicator retains the max and min value of a chart for the time duration you specify. The difference with this one is that it can be applied to any other indicator, not just price. Applied to volume: Pine Script® indicatorby Lemrin11169
Reset Every (Price)Someone requested a high/low price indicator that would reset the "remembered" prices daily. I started out doing just that, and then decided to make it much more configurable. Choose the units (minutes, hours, days, weeks, months) and the number of those units, and this will reset the highest/lowest value remembered to the current values on your chosen time interval. This should work with any time interval you desire, within reason...asking for resets every 4000 hours on a monthly chart will probably not work. GE, monthly, every 7 months: Ford, weekly, every 18 months: Dow Jones Industrial Average, weekly, every 90 days: LTCBTC, daily, every 10 days: ETHUSD, 30 minutes, every 10 days: BTCUSD, 1 minute, every 10 hours: EURUSD, 1 minute, every 50 minutes: Also, I am about to publish another version of this with just one source input that can be applied to any indicator...stay tuned!Pine Script® indicatorby Lemrin33137
Close of relevant previous periodThis indicator puts the previous close value of a higher relevant time frame on the chart, it adepts to the period of the chart. Relevant means that it puts: Close of previous year in monthly chart Close of previous month in weekly chart Close of either previous month of week in daily chart, default setting is week Close of previous week in 4hourly and 3hourly charts Close of previous day in 30minute and higher intraday charts Not bother the user below 30 minutes.Pine Script® indicatorby eykpunter290
Weekly closeIt turned out not to be that easy to plot the close of the previous week in hourly or daily charts. In my first experiments things went wrong on Friday or intraday if you simply use the security function. So here is the thing with an algorithm that guaranties the correct value.Pine Script® indicatorby eykpunter200
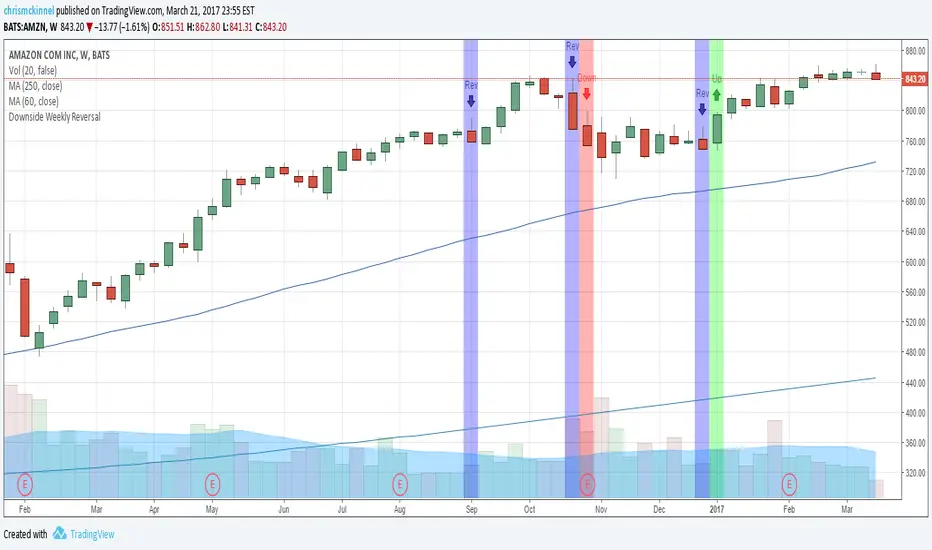
Downside Weekly ReversalBased on Thomas Bulkowski's top ranking small pattern: the Downside Weekly Reversal pattern. Add this indicator to your weekly charts. Blue bars represent weekly reversals and green bars following blue bars indicate an upside breakout. These are to be traded in a Bull market. Red bars following blue bars indicate a downside breakout. These are to be traded in a Bear market. More details: thepatternsite.comPine Script® indicatorby chrismckinnel154
Single Timeframe EMAThis plots EMAs from higher timeframes on intraday charts. Very useful for finding areas of S/R Pine Script® indicatorby jayman271149
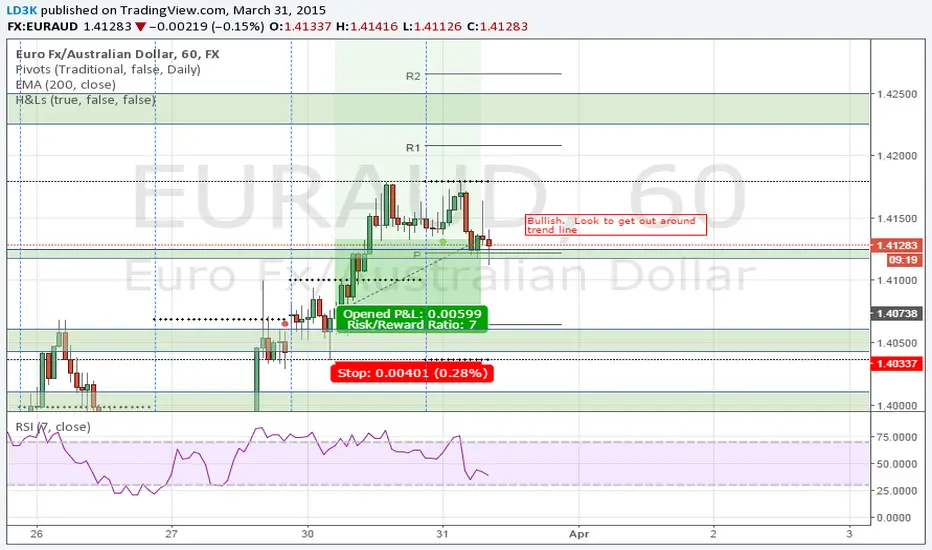
High and LowsSimple script used to show the previous day/week/month high and low as an overlay on the chartPine Script® indicatorby LD3K44874
MAGNUS® CyclesThis indicator will help you if you struggle making any profit in bitcoin. It generates very few signals with very nice profit potential ( around 100% this year ! ). Perfect tool for longterm swing traders and new traders that need help figuring out the midterm trend. Use it with these parameters only: weekly: 13, 5, 12 daily: 92, 21, 96Pine Script® indicatorby MagnusTradingGroup2828 1.7 K