WTI Scalp Signals @RADUVEGAWTI Scalp Signals Pro V1.3
Description:
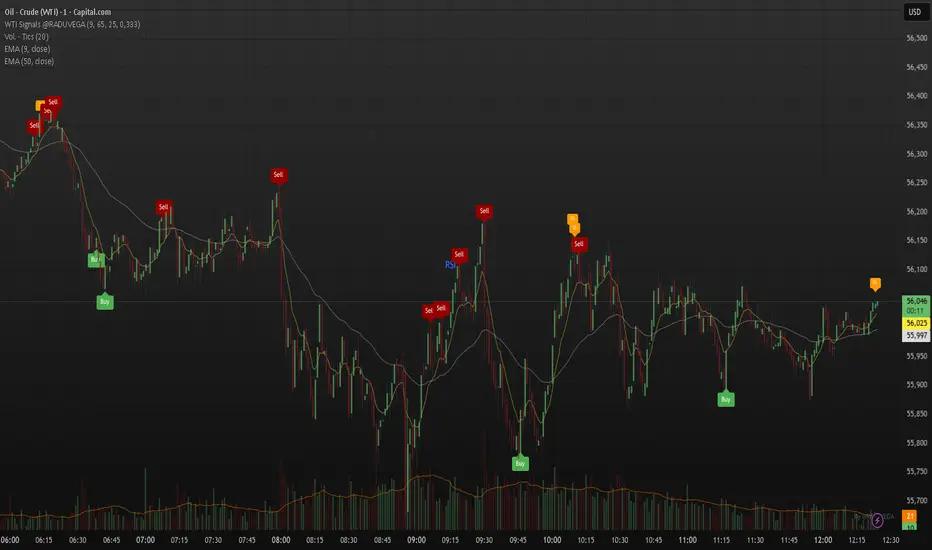
Overview This indicator is a specialized mean-reversion tool designed specifically for the high volatility of the Crude Oil (WTI) market. It combines momentum exhaustion (using a fast RSI) with classic Price Action patterns to identify high-probability scalping opportunities.
Unlike standard indicators that use generic settings, this script has been tuned to react to the "whipsaw" nature of modern energy markets.
Key Features & Logic
Optimized RSI Settings: Uses a 9-period RSI (instead of the standard 14) to catch rapid momentum shifts.
Asymmetric Levels: Tuned with a Sell Threshold at 65 and a Buy Threshold at 25. This asymmetry reflects the market's tendency to drop sharper than it rises (panic selling vs. accumulation).
Pattern Recognition: The script validates RSI signals only when confirmed by specific candlestick patterns:
Bullish/Bearish Engulfing
Hammer / Shooting Star
2-Bar Reversals
Smart Stacking Technology (v1.2): Includes a custom logic to prevent label overlapping. If multiple signals occur on the same bar (e.g., a "Sell" signal + a "Shooting Star"), the labels automatically stack vertically so the chart remains clean and readable.
How to Use
Timeframe: Best used on lower timeframes (1m, 5m, 15m) for scalping sessions.
Sell Signals (Red/Maroon): Look for these during rapid price pumps. The script identifies when price is overextended (RSI > 65) and prints a bearish candle pattern.
Buy Signals (Green): Look for these during sharp sell-offs. The script waits for the RSI to dip below 25 and confirms with a bullish reversal pattern.
Secondary Patterns: Small labels like "SS" (Shooting Star) or "2Bear" serve as additional confirmation of trend weakness.
Settings
RSI Length: Default 9 (Adjustable).
Overbought/Oversold: Default 65/25 (Adjustable).
Pattern Toggles: You can turn on/off specific patterns (Engulfing, Hammers, etc.) to suit your visual preference.
Disclaimer This tool is designed to assist in technical analysis and does not constitute financial advice. Always use proper risk management.
Author: @RADUVEGA
WTI
Accurate BUY & SELL 5 mins TF by RRAlways trade using 5 mins Time frame of chart.
For Buy entry always buy 1 point above the candle closing price & SL would be previous candle low or 30 points.
For Sell Entry Always Sell 1 point below the candle opening price & SL would be previous candle high or 30 points.
Do not take trades using 3 mins Time frame, as there is lot of noise. It works best with 5 mins Time frame.
I have adjusted/set according my trading pattern, if needed use the settings options to set accordingly .
Removed range highlighter to keep the chart simple.
Original Version credits to ZacVaughn
Actual Version i just set alerts and change the parameters for Crude OIL 5min Chart.
NO REPAINT.
Wait For Barclose

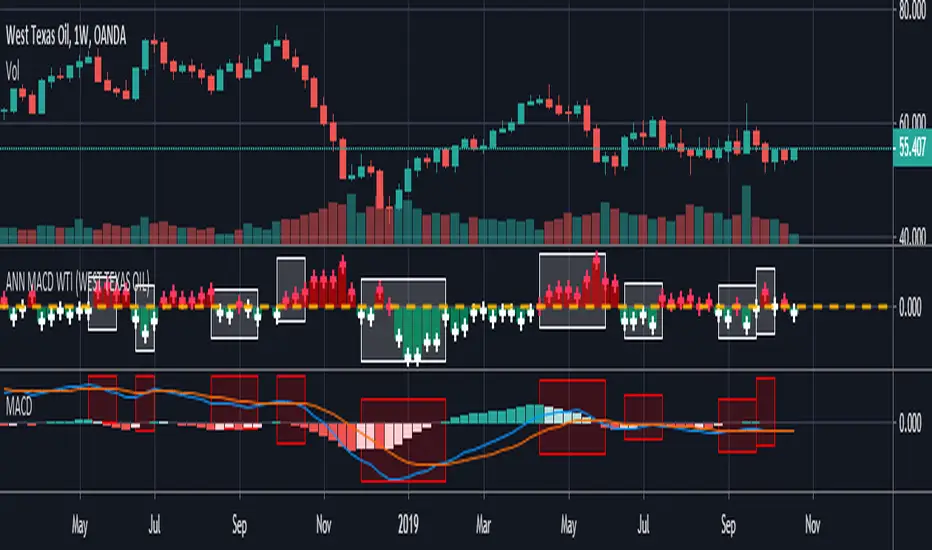
ANN MACD WTI (West Texas Intermediate) This script created by training WTI 4 hour data , 7 indicators and 12 Guppy Exponential Moving Averages.
Details :
Learning cycles: 1
AutoSave cycles: 100
Training error: 0.007593 ( Smaller than average target ! )
Input columns: 19
Output columns: 1
Excluded columns: 0
Training example rows: 300
Validating example rows: 0
Querying example rows: 0
Excluded example rows: 0
Duplicated example rows: 0
Input nodes connected: 19
Hidden layer 1 nodes: 2
Hidden layer 2 nodes: 6
Hidden layer 3 nodes: 0
Output nodes: 1
Learning rate: 0.7000
Momentum: 0.8000
Target error: 0.0100
Special thanks to wroclai for his great effort.
Deep learning series will continue. But I need to rest my eyes a little :)
Stay tuned ! Regards.