Smart Accumulation Pro – US SmallCap Edition v2
Smart Accumulation Pro v2 — US SmallCap Edition
Institutional Footprint and Structural Behavior Engine
Overview
Smart Accumulation Pro v2 detects structural behavior, internal liquidity shifts, and multi-phase accumulation footprints that are not visible through momentum or volatility indicators. The engine focuses on underlying institutional habits rather than reacting to price alone.
ULTRA — High-Threshold Structural Trigger
ULTRA appears only when multiple internal phases align simultaneously. It is not a momentum spike or volume anomaly. It represents compression pressure, phase readiness, and structural alignment. ULTRA does not repaint. When this signal appears, internal liquidity has already transitioned into an acceleration phase.
PRE — Early Structural Drift (Not a Buy Signal)
PRE should not be interpreted as a buy signal. It indicates gradual accumulation or controlled liquidity positioning. PRE usually appears during stable or quiet phases but rarely appears during panic drops or disorderly downtrends.
ACC — Transitional Footprint Signal
ACC identifies late-stage structural footprints. It is not intended as a standalone buy trigger. ACC highlights that structural preparation is underway, but direction and timing require user validation. ACC often precedes larger institutional behavior.
Philosophy
This engine does not attempt to cover every market pattern. It focuses on the highest-probability institutional habits. Exit timing, risk management, and execution remain user responsibility. The tool minimizes noise and emphasizes rare, high-impact structural zones.
Preset Modes
1) Conservative
For ETFs or stable large-cap instruments. Minimal noise and lower signal frequency.
2) Normal
Optimized for US mid-cap and small-cap behavior. Balanced and recommended as the default mode.
3) Aggressive
For volatile or thematic instruments. Higher frequency, higher risk.
Usage Notes
This indicator does not provide financial advice. It highlights structural conditions that often precede institutional movement. Execution and risk decisions depend on the user.
License Notice
Unauthorized copying, redistribution, or sharing is prohibited. Invite-Only access requires your TradingView username. One purchase equals one user license.
------------------------------------------------------------
Korean Summary (한국어 요약본)
------------------------------------------------------------
Smart Accumulation Pro v2는 세력의 습관, 유동성 이동, 압축 단계 등의 “보이지 않는 내부 구조”를 추적하는 지표다. 기존 모멘텀 기반 지표로는 포착되지 않는 패턴을 분석한다.
ULTRA 신호는 여러 내부 단계가 동시에 정렬될 때만 등장하는 극히 희귀한 트리거다. 페인팅이 없으며, 신호가 뜰 때 이미 내부 구조는 가속 단계에 진입한 상태다.
PRE는 매수 신호가 아니다. 세력이 서서히 움직이기 시작하거나 유동성을 재정렬할 때 나타나는 미세한 초기 흔적이다.
ACC는 본격 움직임 전에 나타나는 마지막 흔적이다. 단독 매수 신호가 아니며, 이후 더 큰 구조적 변화로 이어질 가능성을 나타내는 정도로 해석해야 한다.
이 지표는 모든 패턴을 잡지 않는다. 세력이 반복적으로 사용해 온 고확률 구조만 좁게 추적한다. 출구 전략과 리스크 관리는 사용자의 몫이다.
프리셋은 Conservative, Normal, Aggressive의 3가지 모드로 구성되며, 각각 안정형·균형형·변동성형 종목에 맞춰 설계되었다.
본 지표는 금융 조언을 제공하지 않으며, 무단 공유 또는 재배포는 금지된다. Invite-Only 기반이며 1인 1라이선스 방식이다.
X-volume

Volume Gaps & Imbalances (Zeiierman)█ Overview
Volume Gaps & Imbalances (Zeiierman) is an advanced market-structure and order-flow visualizer that maps where the market traded, where it did not, and how buyer-vs-seller pressure accumulated across the entire price range.
The core of the indicator is a price-by-price volume profile built from Bullish and Bearish volume assignments. The script highlights:
True zero-volume voids (regions of no traded volume)
Bull/Bear imbalance rows (horizontal volume slices)
A multi-section Delta Panel, showing aggregated Buy–Sell pressure per vertical sector
A clean separation between profile structure, volume efficiency, and delta flows
Together, these components reveal market inefficiencies, displacement zones, and fair-value regions that price tends to revisit — making it an exceptional tool for structural trading, order-flow analysis, and contextual confluence.
Highlights
Identifies true volume voids (untraded price regions), more precisely than standard FVG tools
Plots Bull vs Bear volume at each price row for fine-grained imbalance reading
Includes a sector-based Delta Grid that aggregates Buy–Sell dominance
█ How It Works
⚪ Profile Construction
The indicator scans a user-defined Lookback window and divides the full high–low range into Rows. Each bar's volume is allocated into the correct price bucket:
Bullish volume when close > open
Bearish volume when close <= open
This produces three values per price level:
Bull Volume
Bear Volume
Total Volume & Imbalance Profile
Rows where no volume at all occurred are marked as volume gaps — signaling true untraded zones, often produced by impulsive imbalanced moves.
⚪ Zero-Volume Gaps (True Voids)
Unlike candle-based Fair Value Gaps (FVGs), volume gaps identify the deeper, structural inefficiency: Price moved so fast through a region that no trades occurred at those prices. These areas often attract revisits because liquidity never exchanged hands there.
⚪ Bull/Bear Volume Imbalance
Every price row is drawn using two colored horizontal segments:
Bull segment proportional to bullish volume
Bear segment proportional to bearish volume
This reveals where buyers or sellers dominated individual price levels.
⚪ Delta Panel
The full volume profile is cut into Summary Sections. For each block, the script computes: Δ = (Bull Volume − Bear Volume) ÷ Total Volume × 100%
█ How to Use
⚪ Spot True Voids & Inefficiencies
Zero-volume zones highlight where the price moved without trading. These areas often behave like:
Refill zones during retracements
Targets during displacement
Thin regions price slices through quickly
Ideal for both SMC-style trading and structural mapping.
⚪ Identify Bull/Bear Control at Each Price Level
Broad bullish segments show zones of buyer absorption, while wide bearish slices reveal seller control.
This helps you interpret:
Where buyers supported the price
Where sellers defended a level
Which price levels matter for continuation or reversal
⚪ Use Delta Sectors for Contextual Direction
The delta panel shows where market pressure is accumulating, revealing whether the profile is dominated by:
Bullish flow (positive delta)
Bearish flow (negative delta)
Neutral flow (balanced or minimal delta)
█ Settings
Lookback – Number of bars scanned to build the profile.
Rows – Vertical resolution of price bins.
Source – Price source used to assign volume into rows.
Summary Sections – Number of vertical delta sectors.
Summary Width – Horizontal size of the delta bar panel.
Gap From Profile – Distance between profile and delta grid.
Show Delta Text – Toggle Δ% labels.
-----------------
Disclaimer
The content provided in my scripts, indicators, ideas, algorithms, and systems is for educational and informational purposes only. It does not constitute financial advice, investment recommendations, or a solicitation to buy or sell any financial instruments. I will not accept liability for any loss or damage, including without limitation any loss of profit, which may arise directly or indirectly from the use of or reliance on such information.
All investments involve risk, and the past performance of a security, industry, sector, market, financial product, trading strategy, backtest, or individual's trading does not guarantee future results or returns. Investors are fully responsible for any investment decisions they make. Such decisions should be based solely on an evaluation of their financial circumstances, investment objectives, risk tolerance, and liquidity needs.

QuantMotions - Smart Money BlocksSmart Money Blocks – Clean Edition is a minimalistic, high-precision Smart Money Concepts (SMC) tool designed for traders who want clean and reliable market structure signals without chart clutter.
This script detects and visualizes Order Blocks, Fair Value Gaps (FVGs), and Liquidity Levels using a strictly filtered, volume-based institutional logic.
Unlike many SMC indicators that overload the chart with noise, this version is built to stay fast, clean, and accurate — ideal for both scalpers and higher-timeframe traders.
🔍 Features
✔ Institutional Order Block Detection
• Identifies bullish and bearish order blocks
• Uses high-volume + price-displacement confirmation
• OBs extend forward and deactivate when broken
• Includes volume + tick range info-box
✔ Fair Value Gaps (FVG)
• Auto-detects bullish and bearish FVGs
• Marks imbalance zones until they are fully filled
• Clean, non-intrusive visualization
✔ Liquidity Levels
• Smart swing-high/swing-low liquidity detection
• Tracks touches to distinguish strong vs weak levels
• Marks support/resistance liquidity with labels only (no chart clutter)
⚙️ Clean & Minimal Design
This script is optimized for a clean workflow:
• No volume profile
• No BOS/CHOCH spam
• No unused SMC elements
• Only high-value SMC signals
• Clean color theme for dark charts
The goal is to provide only what matters, nothing more.
📈 Use Cases
• Smart Money / ICT style trading
• Scalping (1s – 1m)
• Intraday / London & New York session trading
• Swing trading
• Market structure analysis
• Liquidity and imbalance mapping
Whether you're identifying points of interest (POIs), building a bias, or mapping high-probability reaction zones — this tool helps you see structure clearly.
🔔 Alerts Included
• Order Block creation
• FVG creation
• Price touching an active Order Block
• Volume surge
• Institutional candle detection
• Structure break detection
Great for automation or bias confirmation.
🧠 Why This Script?
Many SMC indicators try to do everything — which often results in clutter, lag, and unreliable signals.
This edition focuses on precision, clarity, and real usability.
The logic is light, efficient, and suited for real-time execution on very fast charts.
📌 Note
This tool does not generate trade signals by itself.
It is designed as a market structure map for traders who already understand Smart Money principles such as:
• Displacement
• Imbalance
• Institutional candles
• OB mitigation
• Liquidity sweeps
Use it as part of your confluence system.

Daily POC Lines - Clustered
Overview
This indicator automatically plots horizontal lines at the Point of Control (POC) for each daily candle, intelligently clustering nearby levels to reduce visual noise and highlight the most significant price zones where volume concentration occurred.
What Makes This Original
Unlike standard volume profile indicators that show static profiles for the entire chart, this script:
Calculates individual POC levels for each daily candle within a user-defined lookback period
Implements an intelligent clustering algorithm that merges POC levels within a customizable percentage threshold, preventing chart clutter from redundant lines
Dynamically highlights high-significance clusters (multiple days sharing the same POC level) with customizable visual styling
Provides granular control over line extension, label positioning, and visual appearance
How It Works
The script divides each daily candle's price range into configurable bins (default 20) and distributes the day's volume across these levels to approximate the POC. When multiple days produce POC levels within the specified clustering threshold (default 2%), they merge into a single line with a counter showing how many days share that level.
Key Features
Adjustable lookback period (1-500 candles)
Intelligent clustering with customizable threshold percentage
Separate styling controls for regular POCs vs. high-count clusters
Toggle visibility for lines and labels independently
Configurable line colors, widths, styles (solid/dashed/dotted), and extension
Date labels with cluster count indicators
Adjustable label positioning and offset
Use Cases
Traders can use clustered POC levels to:
Identify key support and resistance zones based on historical volume concentration
Recognize high-significance price levels where multiple days' POCs converge
Reduce chart clutter while maintaining visibility of important volume-based levels
Combine with other technical analysis methods for confluence
Settings
The indicator organizes inputs into four logical groups:
General Settings - Lookback period, cluster threshold, volume bins
Line Settings - Visibility, color, width, style, and extension options
Label Settings - Visibility, position, offset, and color
Cluster Highlights - Threshold and custom styling for high-count clusters
Important Notes
This script uses an approximation method for POC calculation by dividing each candle's range into bins. For maximum accuracy, use on daily timeframe charts. The clustering feature is particularly useful when analyzing longer lookback periods where many POC levels may naturally converge around similar price zones.
Technical Details
Written in Pine Script v5
Maximum 500 lines on chart
Requests daily timeframe data using security function
Uses arrays to store and manage POC data efficiently
Redraws all lines on the last bar for optimal performance

Accumulation And Distribution Zones (Zeiierman)█ Overview
Accumulation And Distribution Zones (Zeiierman) is a structural zone indicator that highlights where the market has recently been absorbing sell pressure (Accumulation) or releasing buy pressure (Distribution).
The indicator tracks a refined sequence of swing highs and lows and measures how these swings tighten, expand, or step directionally. When they form staircase-style structures such as higher lows with compressing highs for Accumulation or lower highs with compressing lows for Distribution, the script marks these areas as shifts in market control.
Once the full pattern completes, the indicator converts it into an Accumulation or Distribution zone. Each zone is based on a confirmed structural sequence rather than a single point, making it more reliable and reflective of actual market behavior.
The indicator can also display a mini-volume profile within each zone and extend POC levels forward, showing where trading activity clustered most. Combined, these features reveal areas where price has recently shown acceptance, absorption, or rejection, helping you understand whether current price action is reacting to, breaking from, or retesting these important structural regions.
█ How It Works
⚪ Swing Structure
The indicator builds its foundation by detecting swing highs and lows using a configurable Swing Detection Window. Each confirmed swing is stored with its price, time, bar index, and direction. If two consecutive swings share the same direction, only the more extreme one is kept. This produces a clean structural sequence that removes noise and keeps only meaningful turning points.
⚪ Accumulation vs Distribution Pattern Logic
Using the refined swing sequence, the script looks for staircase-style formations that signal shifts in control:
Accumulation (bottoming): higher lows combined with compressing highs.
Distribution (topping): lower highs combined with compressing lows.
Two detection modes are available:
Quick for compact 4-swing formations
Slow for broader 6-swing structures
When a full structural pattern completes, the indicator marks the zone and resets the swing buffer for the next formation.
⚪ Volume Profile Construction
The price range between the zone’s upper and lower boundary is divided into several Rows. For every bar within the zone’s swing range, the bar’s volume is added to the appropriate price row.
Volume is classified as:
Bullish volume when close > open
Bearish volume when close < open
Each row is drawn as two horizontal segments (bull and bear), colored with smooth gradients based on your bull/bear color settings. This creates a compact profile that reveals where trading activity is concentrated inside the zone and whether buyers or sellers dominate those price levels.
█ How to Use
The indicator is designed to provide context and confluence, not raw buy/sell signals.
⚪ Spot Fresh Accumulation & Distribution
Use newly printed zones as a map of where the market has recently:
Absorbed selling and formed a floor (Accumulation below price).
Absorbed buying and formed a cap (Distribution above price).
In a trending environment, fresh accumulation zones below price are often areas to watch for pullbacks, while distribution zones above price can act as sell zones or targets.
⚪ Volume Profile
Longer horizontal bars show where the market traded the most volume inside the zone.
Bull-leaning rows inside an accumulation zone often signal strong buying interest during the formation.
Bear-leaning rows inside a distribution zone highlight concentrated selling pressure.
By combining this volume distribution with the zone label and the broader trend context, you can judge whether the structure is more likely to hold, break, or retest as the price approaches it again.
⚪ POC (Point of Control) Trading
Extended POC zones (Regular or Faded) can be treated as dynamic support/resistance rails:
When price revisits a prior accumulation POC and rejects it from above, the level may act as support. When price retests a distribution POC from below and fails to break through, it can act as resistance.
⚪ Combine with Your Own Strategy
The script does not decide direction for you. You get the most value by combining it with:
Your own trend filters (moving averages, higher timeframe structure, volatility measures).
Your preferred entry models (reversal candles, momentum breaks, liquidity grabs, etc.).
Higher-timeframe mapping.
Think of this tool as a map of where the market did meaningful business. You decide how to trade around those areas.
█ Settings
Acc/Dist Ranges – Master switch for drawing all Accumulation and Distribution zones. Turn this off to temporarily hide boxes while leaving supporting logic active.
Pattern – Shows or hides the swing-based pattern outline that formed each zone. Good for structural debugging and education.
Pattern Sensitivity
Quick – more responsive, detects smaller compact structures.
Slow – stricter, focuses on wider and more established zones.
Swing Detection Window – Pivot width used to confirm swing highs and lows. Larger values filter noise and produce bigger zones; smaller values pick up more minor structures.
Volume Profile – Enables the embedded volume profile inside each zone.
Rows – Number of price slices used to aggregate volume in the zone. Higher values give more detail but increase visual density.
Switch Order – Flips the horizontal order of bull vs bear volume segments within each row.
Extend Zones – Behaviour of POC and zone extension:
None – No forward extension.
Faded Zones – Store and draw up to four past POC zones as faded horizontal levels.
Regular Zones – Extend POC boxes forward until price breaks out.
-----------------
Disclaimer
The content provided in my scripts, indicators, ideas, algorithms, and systems is for educational and informational purposes only. It does not constitute financial advice, investment recommendations, or a solicitation to buy or sell any financial instruments. I will not accept liability for any loss or damage, including without limitation any loss of profit, which may arise directly or indirectly from the use of or reliance on such information.
All investments involve risk, and the past performance of a security, industry, sector, market, financial product, trading strategy, backtest, or individual's trading does not guarantee future results or returns. Investors are fully responsible for any investment decisions they make. Such decisions should be based solely on an evaluation of their financial circumstances, investment objectives, risk tolerance, and liquidity needs.

Momentum + Volume Percentile
This advanced momentum indicator combines smoothed momentum analysis with percentile-based volume filtering to identify high-quality trading opportunities backed by significant market participation.
How It Works:
The indicator calculates momentum (rate of change) over a customizable period and applies multiple smoothing techniques to reduce noise. It then filters price action by highlighting only periods where volume exceeds a specified percentile threshold.
The algorithm:
Calculates raw momentum based on price changes over the specified period
Applies customizable smoothing (SMA, EMA, WMA, or HMA) to the momentum values
Computes a moving average of the smoothed momentum as a trend reference
Analyzes volume over a lookback period to establish percentile rankings
Highlights candles where volume exceeds the percentile threshold with color-coded backgrounds
Distinguishes between bullish (green) and bearish (red) high-volume events

Distância Preço vs VWAPIt calculates the distance from the price to the VWAP. The idea is to make it easier to observe when the price might return to the VWAP.

Volume Pulse [ziksfx]Volume Pulse is a clean volume indicator designed to make it easier to read meaningful changes in activity without cluttering your chart. It enhances the standard volume view by supporting both classic volume and dollar volume , highlighting spikes and extreme bars and adding a compact label on the latest bar so you always see the current volume value at a glance. The script is intended to be used in a separate volume pane.
How it works
– Supports two modes: standard volume or dollar volume (close × volume).
– Colors volume bars by candle direction (up/down). Optionally, it can:
• highlight volume spikes above a moving average;
• mark the highest-volume bar over a user-defined lookback period.
– Plots a simple moving average of volume so you can quickly see when activity is above or below typical levels.
– On the latest bar, shows a small label with the current volume value, automatically abbreviated (K / M / B) and optionally prefixed with “$” in dollar-volume mode.
Inputs & customization
– Volume type: choose between standard volume and dollar volume.
– Volume MA length: controls how sensitive the moving average is to recent changes in activity.
– Spike highlighting: optional, turns on/off coloring for bars where volume exceeds the moving average.
– Highest-volume bar lookback: sets the period for detecting the highest-volume bar.
– Label position: choose whether the last-bar label appears on the left or right side of the bar, and optionally shift it slightly above the bar for better readability.
Use cases
Use Volume Pulse to:
– Spot sudden spikes in volume and compare them to the recent average.
– Identify sessions or candles with unusually high activity relative to a chosen TF.
– Visually study how volume behaves around price moves, breakouts or potential fakeouts to better understand their strength or weakness.
– Keep track of the latest bar’s volume instantly, without having to read the raw scale values.
This indicator works on any symbol that has volume data (stocks, futures, crypto and more), but volume quality may vary between markets and instruments. It is intended as an analytical and educational tool only: it does not constitute financial advice and does not provide or guarantee any trading results. Always combine volume context with your own analysis and risk management.

Volume–Phase Analyzer ProVolume–Phase Analyzer Pro – Trend & Institutional Volume Phases
This indicator analyzes how volume behaves relative to price movement to detect whether the market is in Accumulation, Markup, Distribution, or Markdown — the same phases institutions track in professional trading.
Unlike regular volume/MA mashups, this tool combines:
• Institutional volume classification (HighVol Up/Down, LowVol, Confused Vol)
• Price–volume efficiency and wick dominance
• Multi-Timeframe directional filters
• Volatility compression signals using Bollinger Width
• Volume mapped directly into the price chart as candles
• Smart signal engine with cooldown (prevents repeated signal spam)
This helps reveal w hen Smart Money is accumulating, pushing trends, unloading positions, or flushing liquidity.
────────────────────────────────────
How It Works
1️⃣ Volume Strength vs Average Volume
Identifies whether a move is backed by genuine buying/selling power.
2️⃣ Wick & Body Analysis
Confirms whether volume produced meaningful directional pressure — not just noise.
3️⃣ Trend Alignment
Fast EMA vs Slow EMA ensures signals align with active trend.
4️⃣ Higher-Timeframe Confirmation
Confirms if current movement agrees with a larger directional bias.
5️⃣ Compression Detection
When price volatility contracts while high-volume bars appear → phase shift often ahead.
────────────────────────────────────
Signals
BUY → Confirmed bullish demand with trend backing
SELL → Confirmed bearish supply taking control
TRAP → Likely stop-hunt or absorption — often before reversal
Signals only appear when multiple institutional conditions align.
A cooldown prevents repetitive signals like BUY-BUY-BUY.
────────────────────────────────────
Background shading helps visually locate these phases.
Markup phase:
• Meaning: Buyers are in control and the market is trending up
• Background color: Light green
Markdown phase:
• Meaning: Sellers are in control and the market is trending down
• Background color: Light red
Accumulation phase:
• Meaning: Smart Money quietly buying near the bottom before an uptrend
• Background color: Teal (blue-green)
Distribution phase:
• Meaning: Smart Money quietly selling near the top before a downtrend
• Background color: Light orange/yellow
Consolidation phase:
• Meaning: Sideways movement with low conviction
• Background color: Very light grey
Transition phase:
• Meaning: Market has not picked a direction yet
• Background color: No shading (clear background)
⸻
Quick Usage Notes
• Best trades are Buy signals during Markup and Sell signals during Markdown
• Accumulation and Distribution often come before reversals
• Consolidation is a low-quality trading zone
────────────────────────────────────
How to Trade It
• Take BUY signals during Markup
• Take SELL signals during Markdown
• Expect reversals near Trap signals, especially when phase is changing
• Avoid over-trading Consolidation zones
• Volume candles below price reveal when momentum is increasing or fading
Best applied on 5m–1H for intraday and swing confirmation.
────────────────────────────────────
Why This Indicator Is Unique
• It uses p rice-volume efficiency , not standard lagging signals
• It detects S mart Money intent , not retail reactions
• It avoids spam signals using an internal cooldown logic
• It gives context, not just entries — via live market-phase analysis
This makes it a multi-purpose tool for trend trading, breakout trading, and reversal anticipation.
────────────────────────────────────
Alerts Included
• Buy/Sell/Trap Signals
• Phase Change Alerts
────────────────────────────────────
This is a free tool and meant for educational use only.
Always use proper risk management.
────────────────────────────────────

Daily & Average Dollar VolumeCalculates the daily and average (20D) $ volume.
Fully customizable appearence and can be placed in any corner.

Turnover (Volume * HLC/3)Let's get the elephant out of the room. Everyone knows volume is the key to validate price movement, but you can't compare two volume candles of the same stock when the price is 3 times different you need to account for that. So here it is, Turnover chart, to replace volume entirely, because why would you look at volume when you can look at turnover instead?

RT-Split VolumeSplit Volume is a volume analytics tool that separates estimated buy and sell volume for each bar, highlights abnormal activity, and makes it easier to see when larger participants may be stepping in or out of the market.
Split Volume Introduction
Traditional volume tools only show you the data for the candle that "won". This leaves traders in the dark about the balance between buying and selling behind each bar. Often a candle close is a photo finish between bulls and bears, and other times it is hardly a battle at all.
The Split Volume Indicator looks at both sides of the flow and identifies which volume candles have been flagged as anomalies compared with the surrounding volume bars. It is designed to provide additional context around where and how volume is flowing, rather than only showing total volume per candle.
Traditional Volume vs Split Volume
While volume is one of the most important signals a trader can watch, traditional volume indicators only show a single bar for each candle. Only looking at one side of the story puts the trader at a disadvantage. Sometimes the battle between the bears and the bulls is a photo finish, and sometimes it is hardly a battle at all.
In the comparison chart below, the middle pane shows TradingView's built in Volume indicator, while the lower pane shows Split Volume, so you can compare a single bar view with the split buy and sell view side by side.
Split Volume estimates buy and sell pressure separately and plots them on different halves of the panel. This gives a clearer picture of what is actually happening in the underlying order flow, not just which side closed the bar.
How Split Volume Works
The Split Volume Indicator uses an algorithm to estimate the buy and sell volume for each candle. All of the estimated buy volume is placed on the upper half of the indicator, while all of the estimated sell volume is placed on the lower half of the indicator.
As the bulls and bears trade back and forth on each candle, the algorithm also calculates a baseline average of the volume being traded over a rolling window. This dynamic baseline is shown by the gray Ghost Line.
When either the buy side or the sell side volume spikes well above that Ghost Line, the corresponding bars are flagged as abnormal. These abnormal spikes are color coded so they stand out against normal background activity.
Volume Candle Types
Green volume candles - Normal buying volume above the midline.
Blue volume candles - Abnormal buying volume above the Ghost Line.
Red volume candles - Normal selling volume below the midline.
Yellow volume candles - Abnormal selling volume below the Ghost Line.
Volume Impulses
One key pattern to watch with Split Volume is volume impulses: short bursts of concentrated activity that stand out from the Ghost Line baseline. These can be easy to miss with standard volume bars but become very obvious when normal and abnormal buy and sell flows are separated.
Settings
Volume in USD toggle On/Off - Switch between volume being displayed in USD or in the number of units (stocks or tokens) being traded. This change is reflected on the Y axis of the indicator.
Volume smoother - Changes the smoothness setting of the Ghost Line. Higher values make the baseline slower and smoother, and lower values make it more responsive to recent changes in activity.
Volume displacement shifter - Adjusts the vertical height of the Ghost Line. This lets traders control where they want abnormal blue and yellow volume candles to start triggering.
What Makes This Tool Different
Separates estimated buy and sell volume into their own zones instead of showing a single undifferentiated volume bar.
Uses a dynamic Ghost Line baseline so spikes are judged relative to recent activity, not a fixed threshold.
Highlights abnormal volume with clear color coding, making it easier to see when activity is concentrated on one side of the tape.
Emphasizes volume impulses and clusters that can precede or accompany larger moves, rather than only tracking total daily or session volume.
This indicator is intended to provide additional context around order flow and volume behavior. It is not a standalone signal generator and should always be used together with your own analysis, risk management and trading plan. Historical volume patterns do not guarantee future results.
🐋 Tight lines and happy trading!

1x RVOL Bull/Bear Painter v2Relative volume candle indicator registers bull and bear relative volume, at a threshold of 1 or greater. This can be modified to your liking. Use this to enter a strong trend on any time frame.

Dobrusky Pressure CoreWhat it does & who it’s for
Dobrusky Pressure Core is a volume by time replacement for traders who care about which side actually controls each bar. Instead of just plotting total volume, it splits each bar into estimated buy vs sell pressure and overlays a custom, session-aware volume baseline. It’s built for discretionary traders who want more nuanced volume context for entries, breakouts, and pullbacks.
Core ideas
Buy/sell pressure split: Each bar’s volume is broken into estimated buying and selling pressure.
Dominant side highlighting: The dominant side (buy or sell) is always displayed starting from the bottom of the bar, so you can quickly see who “owned” that bar.
Median-based baseline: Uses the median of the last N bars (50 by default) to build a robust volume baseline that’s less sensitive to one-off spikes.
Session-aware behavior: Baseline is calculated from Regular Trading Hours (RTH) by default, with an option to include Extended Hours (ETH) and a control to force Regular data on higher timeframes.
Volume regimes: Three multipliers (1x, 1.5x, 2x by default) show normal, high, and extreme volume regions.
Flexible display: Baseline can be shown as lines or as columns behind the volume, with full color customization.
How the pressure logic works
For each bar, the script:
Adjusts the range for gaps relative to the prior close so the “true” traded range is more consistent.
Computes buy pressure as a proportion of the adjusted range from low to close.
Defines sell pressure as: total volume minus buy pressure.
Marks the bar as buy-dominant if buy pressure ≥ sell pressure, otherwise sell-dominant, and colors the dominant side from the bottom to at least the midpoint using the selected buy/sell colors.
In practice, this turns basic volume columns into bars where the internal split and dominant side are clearly visible, helping you judge whether aggressive buyers or sellers truly controlled the bar instead of just looking at the price action.
Volume baseline & session logic
The script builds a session-aware baseline from recent volume:
Baseline length: A rolling window (default 50 bars) is used to compute a median volume value instead of a simple moving average.
RTH-only by default: By default, the baseline is built from Regular Trading Hours bars only. During extended hours, the baseline effectively “freezes” at the last RTH-derived value unless you choose to include extended session data.
Extended mode: If you select Extended mode, the script builds separate rolling baselines for RTH and ETH trading, using the appropriate one depending on the current session.
Force Regular Above Timeframe: On timeframes equal to or higher than your chosen threshold, the baseline automatically uses Regular session data, even if Extended is selected.
Multipliers: Three adjustable multipliers (1x, 1.5x, 2x by default) create normal, high, and extreme volume bands for quick identification.
This lets you choose whether you want a pure RTH reference or a baseline that adapts to extended-session activity.
Example ways to use it
1. Replace standard volume bars
Add Dobrusky Pressure Core to your volume pane and hide the default volume if you prefer a clean look.
Use the colors and split to see at a glance whether buyers or sellers were dominant on each bar.
2. Pressure confirmation for entries
For longs (example concept; adapt to your own rules):
Require that the entry bar’s buy pressure is greater than the previous bar’s sell pressure , or
If the entry and prior bar are both buy-dominant, require that the entry bar has more buy pressure than the prior bar.
This helps avoid taking a long when buying pressure is clearly fading relative to what sellers recently showed. A mirrored idea can be used for short setups with sell pressure.
3. Context from baseline multipliers
Use ~1x baseline as “normal” volume.
Watch for bars at or above 1.5x baseline when you want to see increased participation.
Treat 2x baseline and above as “extreme” volume zones that may mark climactic or especially important bars.
In practice, the baseline and multipliers are best used as context and filters, not as rigid rules.
Settings overview
Display
- Show Volume Baseline: toggle the baseline and its levels on or off.
- Baseline Display: choose between Line or Bars for the baseline visualization.
Baseline Calculation
- Length: lookback for the median baseline (default 50, configurable).
- Baseline Session Data: choose Regular or Extended to control which session data feeds the baseline.
Session Controls
- Regular Session (Local to TZ): define your RTH window (e.g., 0930-1600).
- Session Time Zone: choose the time zone used for that window.
- Force Regular Above Timeframe: on higher timeframes, force the baseline to use Regular session data only.
Baseline Levels
- Show Level x Multiplier 1/2/3: toggle each volume regime level.
- Multiplier 1/2/3: define what you consider normal, high, and extreme volume (defaults: 1.0, 1.5, 2.0).
Colors
- Buy Volume / Sell Volume: choose colors for buy and sell pressure.
- Baseline Bars (Base / x2 / x3): colors when the baseline is drawn as columns.
- Baseline Line (Base / x2 / x3): colors when the baseline is drawn as lines.
Limitations & best practices
This is a decision-support and visualization tool, not a buy/sell signal generator.
Best suited to markets where volume data is meaningful (e.g., index futures, liquid equities, liquid crypto).
The usefulness of any volume-based metric depends on the underlying data feed and instrument structure.
Always combine pressure and baseline context with your own strategy, risk management, and testing.
Originality
Most volume tools either show total volume only or compare it to a simple moving average. Dobrusky Pressure Core combines:
An intrabar buy/sell pressure split based on a gap-adjusted price range.
A median-based, configurable baseline built from session-specific data.
Session-aware behavior that keeps the baseline focused on Regular hours by default, with the option to incorporate Extended hours and force Regular data on higher timeframes.
The goal is to give traders a richer, session-aware view of participation and pressure that standard volume bars and simple SMA overlays don’t provide, while keeping everything transparent and open-source so users can review and adapt the logic.

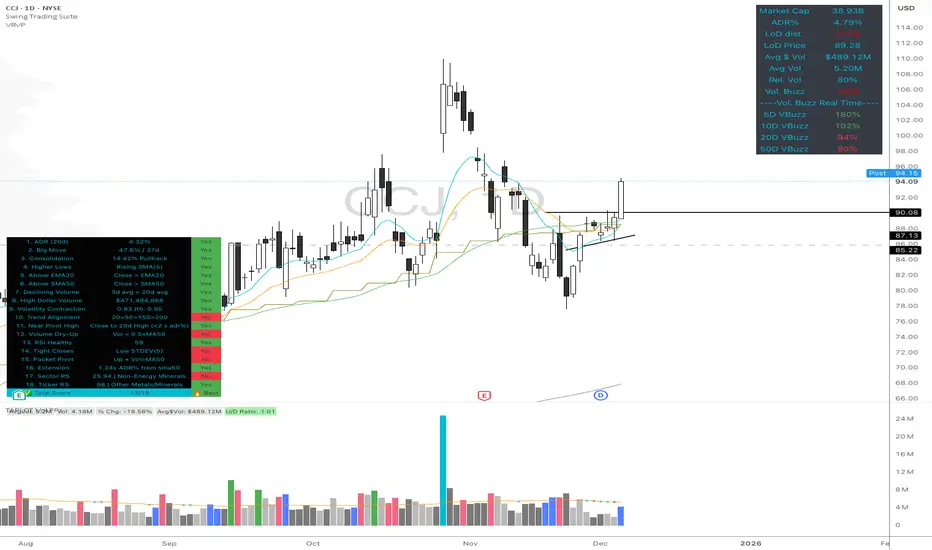
High Quality Setup Detector (Ultimate Edition)High Quality Setup Detector (Ultimate Edition)
A complete, rules-based detector for identifying elite high-probability trading setups based on volatility contraction, trend alignment, volume behavior, RS strength, and classic breakout conditions.
This script consolidates multiple proven technical concepts into one unified scoring system — giving traders a fast, objective way to evaluate the overall quality of any chart.
🔍 What This Tool Does
The indicator evaluates 16–18 technical conditions (depending on whether RS is enabled) and assigns each chart a Total Quality Score.
You instantly see:
✔ ADR volatility quality
✔ Big move + constructive pullback
✔ Higher lows (constructive structure)
✔ Trend alignment (20/50/150/200)
✔ Dollar volume strength
✔ Volatility contraction (ATR ratio)
✔ Volume dry-up before breakout
✔ RSI health
✔ Pocket pivot
✔ Extension from the 50-day
✔ Near pivot high
✔ Optional: Sector RS + Ticker RS
The result appears in a clean, color-coded table displayed on-chart.
🎯 Scoring System
Every condition is worth 1 point.
Based on your total score:
🔥 Best Setup — high probability
🟡 Good Setup — decent but not top-tier
🔴 Weak — avoid
This helps keep you disciplined and objective, even during choppy markets.
📊 RS Rating System (Optional)
Enable RS to compute:
Sector RS strength using mapped sector ETFs
Ticker RS strength using a percentile-based multi-quarter performance model
Both follow a full 1–99 rating scale.
🧩 Customizable Display
Adjustable text size (Tiny → Huge)
Clean 3-column diagnostics table
Organized into logical categories (Trend, Volume, Volatility, RS, etc.)
💡 Ideal For
Growth traders
Breakout traders
VCP / volatility contraction pattern traders
Swing traders who want rule-based confirmation
Anyone who wants structured, systematic chart evaluation
Delta Volume RSI1. Introduction
The Delta Volume RSI (Relative Strength Index based on Volume Delta) indicator provides a unique perspective on market momentum by analyzing the average gains and losses of the volume delta —the difference between buying and selling volume—over a specified period. Unlike traditional RSI, which focuses on price changes, this indicator evaluates shifts in market participation intensity, helping traders detect periods of accumulation and distribution through volume action.
2. Key Features
- Volume-Based Calculation: Computes RSI using the average gains and losses of delta volume rather than price changes, offering insights into buying/selling pressure.
- Dynamic Color Coding: Paints the indicator line green when above the 50 level, and red when below, enabling quick visual identification of momentum shifts around neutrality.
- Reference Levels: Clearly displays overbought (70), neutral (50), and oversold (30) lines for context on volume-driven market extremes.
- Customizable Period: Users can set the period for RSI calculation to fit their trading style and timeframe preferences.
3. How to Use
1. Interpret Colors: The indicator line turns green when volume delta momentum is bullish (above 50) and red when bearish (below 50). Overbought and oversold zones (above 70 or below 30) may highlight exhaustion in volume-driven pushes.
2. Adjustment: Modify the RSI period in the settings to tailor responsiveness.
3. Reference Line: Use the dashed gray line at 50 as a core threshold for detecting transitions between buyer and seller dominance.
How It Differs From Standard RSI
The standard RSI uses changes in closing price to calculate market momentum. In contrast, this indicator calculates RSI using the average gains and losses of the delta volume , capturing underlying shifts in buying and selling activity—even when price is flat. This makes the Delta Volume RSI especially useful for identifying divergence between volume flow and price movement, potentially signaling strong accumulation/distribution or market reversals not visible on price-based RSI alone.

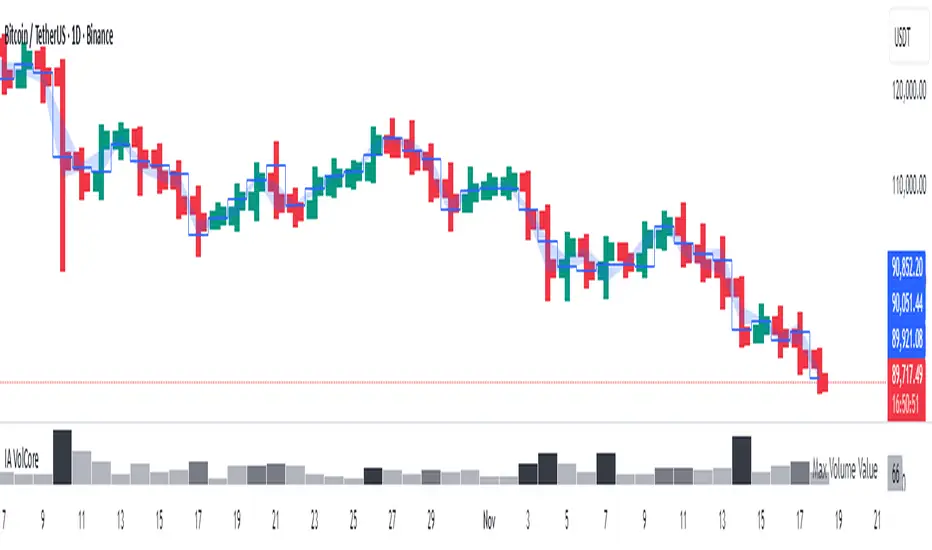
Candle Volume CoreIA VolCore — Candle Volume Core
Indicator Overview
IA VolCore is an intra‑candle volume analysis tool that shows where the core traded volume is concentrated inside each candle.
It visualizes how buyers and sellers interacted within the bar and highlights key levels and zones where the highest activity takes place.
How Calculations Work
The indicator uses the lowest available timeframe data to calculate volume distribution inside each candle.
If you have a Premium or higher subscription, VolCore uses second‑based data for the most accurate results. Older candles (where second‑data is no longer available due to platform limits) are calculated using minute data. The indicator can therefore be used on any timeframe from 1 minute and higher.
If you do not have Premium, the indicator uses minute‑based data only, so it is recommended to use it from the daily timeframe and above.
Example of Calculation
If the chart timeframe is 1 hour and the lowest available timeframe is 1‑second data, the indicator loads 3600 1‑second candles. Each 1‑second candle has a known volume, which is evenly distributed across its own price range.
The 1‑hour candle is then divided into a number of price ranges based on the Candle Volume Resolution parameter. The volumes of all 3600 1-second candles are then aggregated into the corresponding price ranges of the hourly candle.
The final result is a detailed intra‑candle volume map for the entire hour — calculated using the most precise data available.
Custom Timeframe Parameter
If Use Custom Timeframe is enabled and a timeframe is selected, all calculations will be performed strictly using this specified timeframe.
For example: if the chart is on 1D, the user has 1‑second data available, but Custom TF is set to 1 minute, then the volume distribution inside each daily candle will be calculated using 1‑minute candles.
Key Features
Candle Volume Resolution — defines how many price ranges each candle is divided into (3–50,000). All calculations in the indicator are based on this resolution.
Max Volume Level — displays the price level inside the candle where the maximum volume occurred.
% of Volume (1, 2, 3) — defines percentages of the candle's total volume (e.g., 33%, 66%, 50%). For each percentage, VolCore finds the minimum price range containing that share of volume. You can view the corresponding volume values for these shares in histogram form via the Show: Vol % 1–3 parameters. The actual intra-candle zones are displayed using the Show area option.
Volume % for Density — sets the volume percentage used to calculate Vol Density, which reflects how concentrated the volume is inside the selected price range.
Display Parameters (Show)
Show: Vol % 1–3 — shows histograms of volume share zones based on the selected "% of Volume" parameters (with color logic applied).
Show: Max Volume Value — displays the maximum internal volume value for each candle as a histogram (with color logic applied).
Show: Volume — displays the candle's total volume (with color logic applied).
Show: Vol Density — shows the density of volume distribution inside the candle for the selected volume percentage (with color logic applied).
Example Use Cases (not a complete list)
IA VolCore shows where liquidity forms inside each candle, how volume is distributed, and how concentrated trading activity is.
Detecting False Breakouts
If a breakout candle shows increased volume, and after the breakout the core volume forms beyond the level, but the price moves back — VolCore provides a strong signal of a false breakout.
Examples:
Identifying Support & Resistance Zones
If Max Volume Level repeatedly forms in the same internal range over multiple candles, this indicates a hidden support or resistance level.
Example:
Who This Indicator Is For
For traders using volume‑based and contextual market analysis, and for IA (Initiative Analysis) ecosystem users who want a deeper understanding of intra‑candle structure.
Histogram Color Logic
IA VolCore uses three color shades to highlight volume behavior relative to previous candles:
light shade — normal volume, no significant change,
medium shade — volume exceeds both previous candles,
dark shade — volume exceeds the sum of the previous two candles.
This helps quickly spot growing activity and potential shifts in market pressure.
Style Settings
Line styles, histogram styles, and colors can be customized in the indicator’s Style tab.
Delta Manipulation FootprintIntroduction
The Delta Manipulation Footprint indicator highlights significant shifts in volume delta between consecutive candles, helping traders visually identify potential market manipulation or strong buying/selling pressure. By analyzing the difference in buy and sell volume (delta) and its changes over time, this indicator reveals aggressive market behavior often associated with big players.
Key Features
- Calculates the absolute difference of volume delta between candles, maintaining the direction of change.
- Uses a customizable moving average and threshold multiplier to filter meaningful volume shifts.
- Colors candles green when delta difference is notably increasing, and red when decreasing, for clear visual signals.
- Fully overlays the main price chart, painting candles directly for intuitive interpretation.
How to Use
Apply this indicator to your price chart to instantly visualize periods of significant volume delta shifts. Look for green candles signaling rising buying pressure and red candles showing increasing selling pressure. Adjust the moving average length and threshold multiplier inputs to tune sensitivity to your trading style or particular market behavior. Use in conjunction with other price action and volume indicators to confirm signals and improve trade timing.
This tool is ideal for traders aiming to spot footprint-like manipulations in volume delta, aiding in the detection of institutional activity and potential market turning points.

Effort HeatmapThe Effort Heatmap visualizes where meaningful, same-direction volume occurred inside an imbalance during strong directional movement.
Instead of analyzing total bar volume or traditional volume-at-price distributions, this tool reconstructs a simplified internal volume profile using lower-timeframe data.
When a Fair Value Gap forms during a high-volume displacement, the script highlights the portions of the imbalance candle where directional effort was concentrated and projects those regions forward as a heatmap.
The purpose of this indicator is not to predict price or represent institutional activity, but to offer a visual way to study how the market delivered volume inside a move that created an imbalance.
How It Works
1. Lower-Timeframe Volume Extraction
The indicator retrieves open, close, and volume data from a selected lower timeframe.
Only sub-candles that move in the same direction as the previous bar are considered, ensuring the heatmap reflects directional effort—not mixed volume.
2. Candle Body Binning
The FVG candle is divided into multiple horizontal bins.
Each lower-timeframe sub-candle contributes volume proportionally to the bins it overlaps, creating a vertical volume distribution for that bar.
3. Imbalance (FVG) Detection
A simple 3-bar displacement logic detects bullish or bearish imbalances.
An optional Z-Score filter ensures the heatmap only forms when volume is relatively elevated compared to recent history.
4. Heatmap Projection
When a qualifying imbalance occurs:
• The FVG bar’s volume distribution is normalized
• Only areas with relatively elevated volume are displayed
• Colored heatmap boxes are created and extend forward
• These boxes remain until price trades into or through them
This allows traders to observe how price interacts with past zones of concentrated directional effort.
What Makes It Different
Most volume tools focus on fixed session profiles, market-wide volume-at-price calculations, or bar-level volume totals.
The Effort Heatmap instead reconstructs a per-bar vertical volume distribution using lower-timeframe price action and displays it only when displacement occurs.
Rather than treating the candle as a single block of volume, the indicator highlights where inside the candle body volume was delivered while moving in the displacement direction.
This creates a unique visualization of directional effort that conventional profiles, OB/FVG indicators, and classic oscillators do not show.
How to Use It
1. Apply to any timeframe: The indicator works on all chart timeframes, but gains more detail when higher timeframes are used in combination with lower-timeframe volume data.
2. Identify displacement moments: When a bullish or bearish FVG forms with a high volume Z-Score, the heatmap will appear.
3. Observe the heatmap structure:
Each horizontal band represents the relative concentration of same-direction volume inside the previous candle.
4. Watch how price interacts with these zones:
Heatmap areas extend until price touches or trades through them, at which point they stop extending and are finalized.
5. Combine with your own analysis:
These areas can be used to study...
...how past directional volume clusters influence current movement
...structural reactions to zones of prior effort
...which parts of a displacement candle were most active
The indicator is a visual study tool, not a signal generator.
Settings
• Volume Source Timeframe
Chooses the lower timeframe used to reconstruct internal volume. Smaller timeframes give more detail; larger timeframes give smoother profiles.
• Z-Score Lookback
Controls how many bars are used to measure relative volume. Larger values make the volume filter stricter.
• Z-Score Threshold
Minimum relative-volume strength required to draw a heatmap. Higher values show only high-effort moves.
• Volume Filter (%)
Removes weaker bins based on how much volume they contain compared to the strongest one. Higher percentages = fewer but more meaningful zones.
• Bullish / Bearish Colors
Sets the base color for heatmap boxes depending on direction.

Volume Peak Box📄 English Description
Overview
The Volume Peak Box indicator highlights periods of unusually high volume by identifying volume spikes using Bollinger Bands on volume and drawing a price-range box around each spike window. This provides traders with a clear visual representation of supply/demand imbalances, absorption zones, and breakout/false-break areas.
All calculations come from one unified concept: detecting statistically significant volume peaks on a locked timeframe and mapping them onto the chart.
Concept & Logic
1. Locked Timeframe Volume Analysis
Instead of using the current chart timeframe, this script allows users to lock volume analysis to any timeframe (e.g., 60m, 4H, 1D).
The script retrieves from the chosen timeframe:
Volume
High price
Low price
This allows volume structure from higher timeframes to be used while trading lower timeframes.
2. Bollinger Bands on Volume
Volume volatility is analyzed using a standard Bollinger Band model:
Basis = SMA(volume, BB length)
Upper Band = Basis + (mult × standard deviation)
When:
Volume > Upper Band
→ This bar is classified as a Volume Peak.
This approach makes the peak detection statistically meaningful, instead of simply comparing raw volume to previous bars.
3. Peak Session Detection (Continuous Peaks Form One Box)
The script tracks continuous volume peaks:
When a peak starts → begin a session
While peaks continue → extend the session
When peaks end → session closes and a box is created
For each peak session, the script records:
Start bar index
End bar index
Highest high within the session
Lowest low within the session
These values determine the box boundaries.
This allows the indicator to group related peaks into a single price zone, instead of drawing a box for every bar.
4. Drawing the Volume Peak Box
When a session ends, the script draws:
A filled box covering the full price range
From startBar → endBar
Using user-defined:
Box fill color
Border color
Each box visually marks a region where strong participation entered the market, often signaling:
Breakout validation
Absorption zones
Supply/demand imbalance
High-activity trading decisions
How to Use
Use the boxes to identify high-volume reaction zones.
When price revisits a box:
Expect strong reactions (bounce, rejection, or absorption).
When price breaks out from a box:
Can signal continuation with momentum.
Lower-timeframe entry signals become more reliable when aligned with high-timeframe volume boxes.
Recommended to lock the TF to:
60m for intraday
4H or 1D for swing trading
Why This Script Is Original
It uses Bollinger Bands on volume, not price — a less common volatility-based method for detecting volume anomalies.
It groups continuous peaks into unified zones instead of treating each spike separately.
The ability to lock the volume analysis to a higher timeframe allows multi-timeframe volume interpretation without cluttering the chart.
Boxes give traders a clean and intuitive view of volume-based “decision zones”.
🇹🇭 Thai Description — คำอธิบายภาษาไทย
ภาพรวม
อินดิเคเตอร์ Volume Peak Box ใช้การตรวจจับ “Volume Peak” โดยใช้ Bollinger Band บน Volume แล้วสร้าง “กล่องช่วงราคา” ครอบช่วงที่มี Volume สูงผิดปกติ ทำให้เห็นบริเวณที่มีแรงซื้อขายเข้ามาอย่างชัดเจน เช่น จุด Breakout, จุด Absorption, หรือเขต Supply/Demand
แนวคิดและหลักการทำงาน
1. วิเคราะห์ Volume จาก Timeframe ที่ล็อกไว้
คุณสามารถเลือก TF ที่ต้องการให้ Volume ถูกนำมาคำนวณ เช่น 60 นาที, 4 ชั่วโมง, 1 วัน
แม้คุณจะเปิดกราฟ TF เล็ก เช่น 5m แต่กล่องยังอิง volume จาก TF ที่เลือกไว้ ทำให้ได้ “โซน Volume ใหญ่” ที่แม่นยำขึ้น
2. Bollinger Band บน Volume
ใช้ SMA + ส่วนเบี่ยงเบนมาตรฐานของ Volume เพื่อหา “จุดที่ Volume สูงกว่าปกติอย่างมีนัยสำคัญ”
เงื่อนไข Peak:
Volume > Upper Bollinger Band
นี่เป็นวิธีที่ดีกว่า “เทียบกับแท่งก่อนหน้า” เพราะคิดจากสถิติของทั้งช่วง
3. รวม Peak ต่อเนื่องเป็นกล่องเดียว
ถ้า Volume Peak เกิดต่อเนื่องหลายแท่ง:
จะถูกจับรวมเป็น Peak session เดียว
ใช้ High สูงสุด และ Low ต่ำสุดของทั้ง session
เมื่อ Peak จบ → วาดกล่องช่วงราคา
เหมาะกับการหาจุดที่ตลาดมีแรงเข้าซื้อ/ขายหนักในช่วงเวลาเดียวกัน
4. วาดกล่อง Volume Peak
กล่องจะครอบ:
ช่วงแท่งเริ่มต้น → แท่งสุดท้ายของ Peak
ความสูงของกล่อง = ช่วงราคาที่มี Volume สูงผิดปกติ
กล่องสามารถใช้เป็น:
โซน Breakout/Breakdown
โซน Supply/Demand
เขตที่ราคามักมี reaction
วิธีใช้งาน
ใช้กล่องเป็น “เขตการตัดสินใจ” (Decision Zone)
ราคาแตะซ้ำมักเกิดการกลับตัวหรือความผันผวนสูง
การทะลุกล่องบ่อยครั้งนำไปสู่ขาเทรนด์ใหญ่
เหมาะกับการใช้ร่วมกับ Price Action และโครงสร้างราคา
จุดเด่น / ความเป็น Original
ใช้ Bollinger Band บน Volume (น้อยอินดี้ทำ)
รวม Peak ต่อเนื่องเป็น session เดียว
วิเคราะห์ Volume ข้าม TF ได้ โดยไม่ต้องเปลี่ยน TF บนกราฟ
ได้ “โซน Volume สำคัญ” แบบชัดเจน อ่านง่าย ไม่รกจอ

Adaptive Window Volume ProfileThe indicator builds a rolling volume profile over a chosen time window (1, 3, 12 months or lower), finds POC, VAH/VAL, RH/RL, HVN/LVN, and then overlays volume-driven bar colors (climax, initiative, absorption) filtered by a 30-day RVWAP trend, so you can see where big volume traded and who is winning there right now.
Example Use Case:
How to use it on 4H with 3-month and 12-month rolling profiles:
On a 4H chart, you run two copies of the indicator, both in Rolling Lookback mode, both using the Full (Overlap) engine:
Instance A – 12-month rolling profile (macro map):
-Rolling Unit: Months
-Rolling Length: 12
This gives you the 1-year composite:
-12M RH / RL → outer range of where almost all yearly volume traded (macro high/low “rails”).
-12M VAH / VAL → yearly value area: where the market has been comfortable doing business over the last year.
-12M POC → the single most traded price of the last 12 months (macro gravity).
-12M HVNs/LVNs → long-term shelves (acceptance) and gaps (knife-edges).
Use this instance to answer:
Where are we in the last year’s distribution, and are we approaching macro extremes or living in fair value?
-Combine it with the 30-day RVWAP regime the script computes:
-Above RVWAP and RVWAP rising → macro bull tilt.
-Below RVWAP and RVWAP falling → macro bear tilt.
For example:
-Price near 12M RL with RVWAP bull → potential deep-discount accumulation zone.
-Price near 12M RH with RVWAP bear → potential exhaustion / distribution zone.
Instance B – 3-month rolling profile (tactical map)
-Rolling Unit: Months
-Rolling Length: 3
This builds a 3-month composite on top of your 4H chart:
-3M RH / RL → extremes of the current quarter’s trading.
-3M VAH / VAL → current “fair value box” for the last 90-ish days.
-3M POC → where recent volume concentrates most heavily.
-3M HVNs/LVNs → fresh shelves and gaps inside the bigger yearly structure.
You use this instance for actual trade locations and management:
-Pullbacks into 3M VAL / RL that still sit inside the 12M value and in a bull RVWAP regime → high-probability dip-buy zones; you then look for bull initiative/absorption bar colors to confirm entry.
-Rallies into 3M VAH / RH that line up near 12M VAH / RH in a bear RVWAP regime → good areas to look for shorts, especially when you see bear climax/initiative bars there.
-3M LVNs that coincide with 12M LVNs or VA edges act as sharp decision points: acceptance through often means expansion; rejection often means reversal.
How it all fits together
On your 4H chart, with both instances active:
-12M profile = macro context and big terrain (where the yearly battlefield is).
-3M profile = tactical zones (where to actually trade inside that terrain).
-Bar colors (climax / initiative / absorption) filtered by 30-day RVWAP = timing + confirmation at those levels, favoring the side that has trend and effort behind it.
So the indicator, used this way, becomes:
-one instance to tell you where the big war is being fought (12M)
-one instance to tell you where the current campaign inside that war is concentrated (3M)
-bar colors to tell you whether the team you want to back is actually showing up with size when price hits those levels.

Cumulative Delta Difference HistogramINTRODUCTION:
This "Cumulative Delta Difference Histogram" is a volume-based indicator that calculates the difference (delta) between aggressive buying volume and selling volume for each candle and then builds a cumulative momentum histogram with the following behavior:
Momentum Tracking: The indicator accumulates the delta values when the delta is positive and increasing, producing green bars whose height visually represents growing buying pressure momentum.
Negative Momentum Detection: When the delta becomes negative or starts to decline, the histogram bars turn red and the accumulation decreases, effectively showing increasing selling pressure momentum.
Directional Reset: On each change from positive to negative delta momentum or vice versa, the accumulator resets to zero, providing a clear and sharp visualization of shifts without persistence from previous trends.
Zero Reference Line: A horizontal zero line serves as a visual baseline to distinguish positive from negative momentum easily.
HOW TO USE:
To trade effectively using the "Cumulative Delta Difference Histogram," you compare the price action chart with the indicator to confirm momentum and detect potential reversals or continuations. Here's how to do it in practice:
Confirming Trends:
When the price is rising, look for the histogram bars to be green and increasing, indicating strong and growing buying pressure supporting the uptrend. If price rises but the histogram shows diminishing green bars or shifts to red, it could signal weakening momentum and a potential reversal.
Identifying Divergences:
Compare price highs/lows with histogram peaks. If price makes a new high but the histogram fails to make a corresponding new high (bearish divergence), it warns of a possible trend reversal. Conversely, if price makes a new low but histogram shows higher lows (bullish divergence), it signals potential bullish reversal.
Volume Confirmation:
The histogram reflects real-time volume aggression behind price moves. Confirmation of price breakouts or breakdowns by corresponding strong histogram colors and bar height increases adds reliability to signals.
By aligning price patterns and levels with the cumulative delta histogram's signals, traders gain a deeper understanding of market strength and better timing for trades.
This combined approach improves the accuracy of entries and exits beyond relying on price alone, especially in markets sensitive to order flow and volume dynamics.
Use this indicator with a default volume or with my other indicator "Agression Histogram" for a better reading.

Volume Pressure and PercentVPP Volume Pressure and Percentage Indicator with a Volume Trendline that indicates which side is driving the flow.
Features:
1. Buy/Sell Pressure Bars (Core Volume Split)
The indicator separates each candle’s volume into buy volume (green) above the zero line and sell volume (red) below it. This gives you a real-time visualization of which side is more aggressive within the current bar. Instead of waiting for prices to move or candles to close, you can instantly see whether buyers or sellers are stepping in.
2. Dynamic Total Volume (Invisible Histogram + Status Line Color)
The total volume of each bar is tracked behind the scenes and displayed in the pinned status line using a dynamic color—green when buyers dominate, red when sellers dominate. The histogram for total volume is invisible to keep the chart clean, but the total volume figure stays visible and changes color based on who is in control. This gives you instant confirmation of whether institutional-sized volume supports the direction shown by the buy/sell pressure, which is especially valuable when evaluating the risk or conviction behind a potential entry.
3. Percentage Mode (% of Bar Volume)
When toggled on, the indicator converts each bar into percent buy vs percent sell, normalizing all flow to a 0–100% scale. This mode is incredibly useful when comparing pressure across different times of day, gaps, or varying volume conditions—such as early morning spikes versus lunchtime chop. By removing absolute volume from the equation, you gain a clean look at the actual imbalance between buyers and sellers.
4. 70% Pressure Band (Imbalance Threshold Zone)
In percentage mode, the indicator displays a subtle 70% band (a light gray zone) above and below the zero line, showing where buy or sell pressure reaches extreme dominance (≥70%). When a bar’s buy or sell percentage enters this zone, it highlights moments of exhaustion, acceleration, or potential reversal. The band acts like a real-time overbought/oversold gauge specifically for volume imbalance, not price.
5. Trend Line (Net Pressure Trend / Reversal Detector)
The trend line smooths out the net volume pressure (buy volume minus sell volume or its percentage equivalent) and shows the overall direction of order flow. When the line slopes upward, buyers are gaining control; when it slopes downward, sellers are taking over. This trend line acts as a real-time momentum indicator based directly on flow rather than price. Because it reacts quickly to intrabar shifts in buy/sell pressure, it often turns before price does—giving you a measurable timing edge.
6. Auto-Selecting Trend Source (Volume Net, Percent Net, or CVD)
The indicator lets you choose how the trend line is calculated: Volume Net (buy minus sell volume), Percent Net (normalized imbalance), or CVD (Cumulative Volume Delta) for long-term flow bias. The default “Auto” mode automatically switches between Volume Net and Percent Net depending on which view you’re using. This flexibility allows the trend line to remain meaningful whether you’re analyzing raw volume or normalized percentage data.
7. Pinned (Status Line) Totals in K/M/B Format
Regardless of whether you’re in volume or percentage mode, the indicator always displays Total Volume, Buy Volume, and Sell Volume in the status line using abbreviated K, M, B formatting. These values update in real time and are color-coded: green for bullish dominance, red for bearish. This gives you a concise snapshot of order flow strength on every bar.
---------------------
How To Use:
Support Level Zones
• Watch for Buy bars increasing + Trend line flipping up right at or slightly below support.
• This often signals absorption — market makers filling large buy orders before reversal.
• Confirmation: Price reclaims VWAP ... enter calls / longs.
Resistance Level Zones
• Watch for Sell bars increasing + Trend line flattening/turning down near resistance.
• This signals distribution or stop runs.
• Confirmation: Price rejects VWAP ... enter puts / shorts.
Breakout Traps
• Sometimes you’ll see price break a level, but the flow doesn’t confirm (buy volume doesn’t expand).
• That’s a false breakout — fade it with options opposite the move.
