Performance
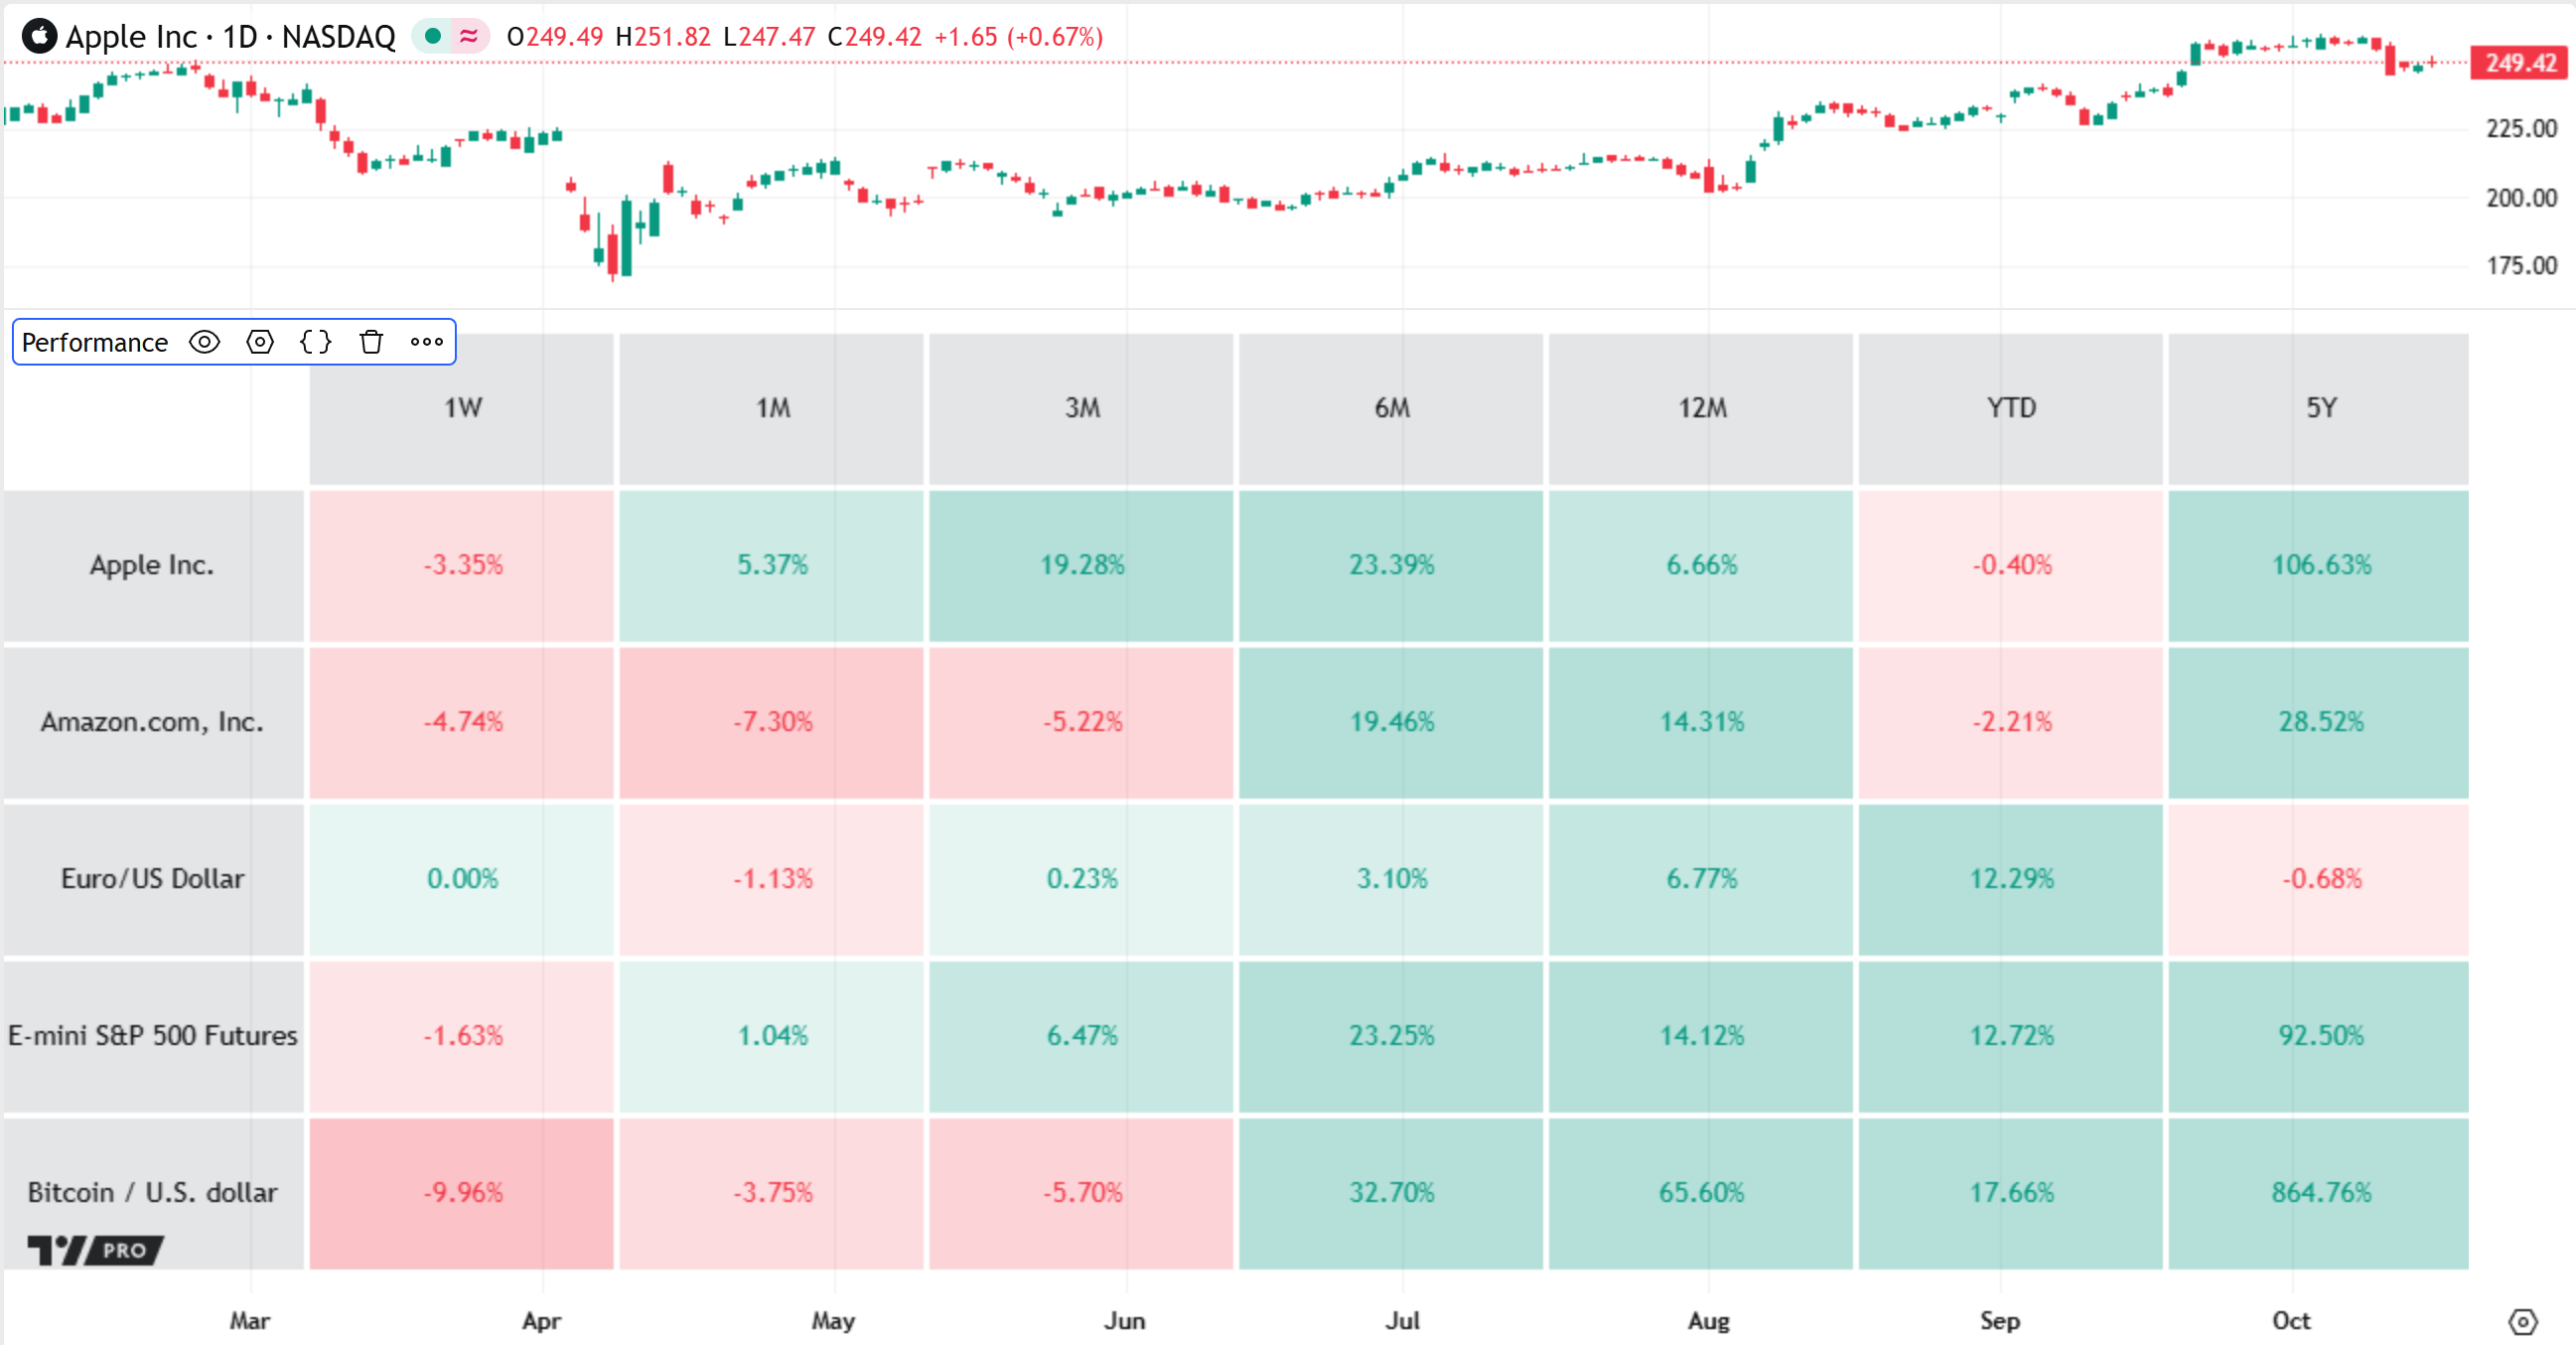
The Performance indicator displays the current percentage change in prices of one or more symbols, over a set of chosen time periods, in a heatmap-style table. The indicator features text inputs where you can supply comma-separated lists to customize the symbols and timeframes for which it displays performance data.
Calculation
The indicator requests daily close prices for each symbol from the user-defined symbol list, then calculates the percentage change in those prices (the performance value) across each time period specified in the timeframe list. Each row in the table corresponds to a symbol, and each column corresponds to a timeframe. The cell at the intersection of a row and column shows the relative amount by which a specific symbol's price increased or decreased over one of the time periods.
For each listed timeframe and symbol, the indicator determines an anchor time for the performance calculation based on the opening time of the symbol's latest daily bar. The anchor time calculation depends on the type of timeframe:
- For day-based or week-based timeframes, the indicator subtracts the specified number of 24-hour or 7-day periods from the current daily bar's opening time. For example, if the symbol's current bar opens on Oct 10, 2025, the anchor time for the "1W" timeframe is on Oct 3, 2025.
- For month-based or year-based timeframes, the indicator subtracts the number of months or years but selects the same day and time, adjusting the final date as necessary. For example, for a daily bar that opens on Oct 10, 2025, the "6M" anchor time is on Apr 10, 2025, and the "2Y" anchor time is on Oct 10, 2023.
- For "year to date" ("YTD"), the anchor time is midnight on the first day of the current daily bar's opening year. For example, the YTD anchor for any bar that opens in 2025 is midnight on Jan 1, 2025.
After determining a symbol's anchor time for one of the specified timeframes, the indicator uses that time to find the anchor bar for the symbol's change percentage. The anchor bar is the daily bar that opens at the calculated time, if one exists for that symbol, or the latest available bar that opened before that time.
For each symbol-timeframe combination, the indicator calculates the performance value using the following formula:
100 * (CurrentValue - PastValue) / PastValueWhere CurrentValue is the symbol's latest price, and PastValue is the closing price of the anchor bar.
For example, if the symbol's latest price is 215.00 and the "1M" anchor bar's closing price is 193.00, the resulting performance value is 100 * (215 - 193) / 193 = 11.40%. This value indicates that the symbol's price increased by over eleven percent across the latest one-month period.
! Tip: To view the date of a performance value's anchor bar, hover over its cell in the table to reveal a tooltip. The tooltip shows the date in the "dd MMM yyyy" format.Inputs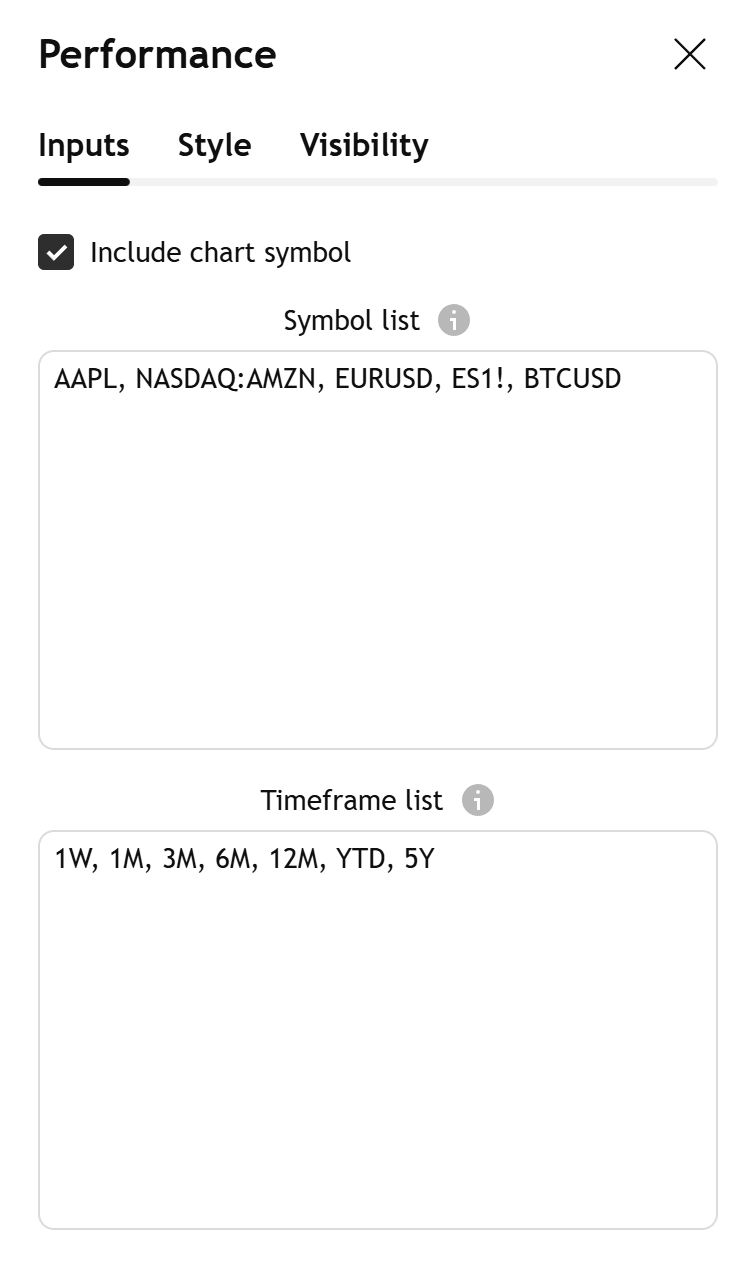
Include chart symbol
If enabled, the indicator automatically adds a table row for the current chart's symbol if that symbol is not already included in the symbol list.
Symbol list
A comma-separated list of symbols or ticker IDs, with optional spaces. Each item can specify an exchange prefix (e.g., "NASDAQ:AAPL") or use just the symbol name (e.g., "AAPL"). If a listed symbol does not include an exchange prefix, the indicator automatically selects the most popular exchange for that symbol.
Timeframe list
A comma-separated list of timeframes, with optional spaces, which define the periods over which the indicator calculates performance values for each symbol.
Each listed timeframe must use one of the following units:
- "D" for days
- "W" for weeks
- "M" for months
- "Y" for years
- "YTD" for year to date
All timeframes except for "YTD" can include a multiplier prefix to specify the number of days, weeks, months, or years in the performance period. For example, "3D" represents a period of three days, and "5Y" represents five years.

Positive color
The base color of the table cells that contain positive performance values.
Negative color
The base color of the table cells that contain negative performance values.
Color intensity cutoff (%)
The maximum absolute percentage for color intensity calculations. The table cells with absolute values at or above this level have the highest intensity (opacity) in the heatmap display. For example, a cutoff value of 10% means that cell colors become increasingly opaque as the corresponding values approach 10%, but all cells with values above 10% share the same opacity.
Table position
These settings specify the horizontal and vertical position of the heatmap table relative to its pane. The defaults are "center" and "middle", which position the table in the center of the pane. Use the first input to move the table left or right, and use the second to move it up or down.
Table width (%)
The table width, expressed as a percentage of the indicator's pane width. The default is 100, which means that the table is as wide as the pane. If the value is 0, the width automatically adjusts to fit the table's contents. Note that if the timeframe list includes a large number of timeframes, the table's width might exceed the width of the pane.
Table height (%)
The table height, expressed as a percentage of the indicator's pane height. The default is 95, which means that the table is slightly shorter than the pane. If the value is 0, the height automatically adjusts to fit the table's contents. Note that if the symbol list includes a large number of symbols, the table's height might exceed the height of the pane.