Big Breakout Soon in Commodity Chart similar to Silver Chart- 🚀 ALUMINIUM - $2631
Date: 18-07-2025
Price: $2,631.05
Volume: 37.12K
1⃣ Pattern Structure & Breakout Development 📈
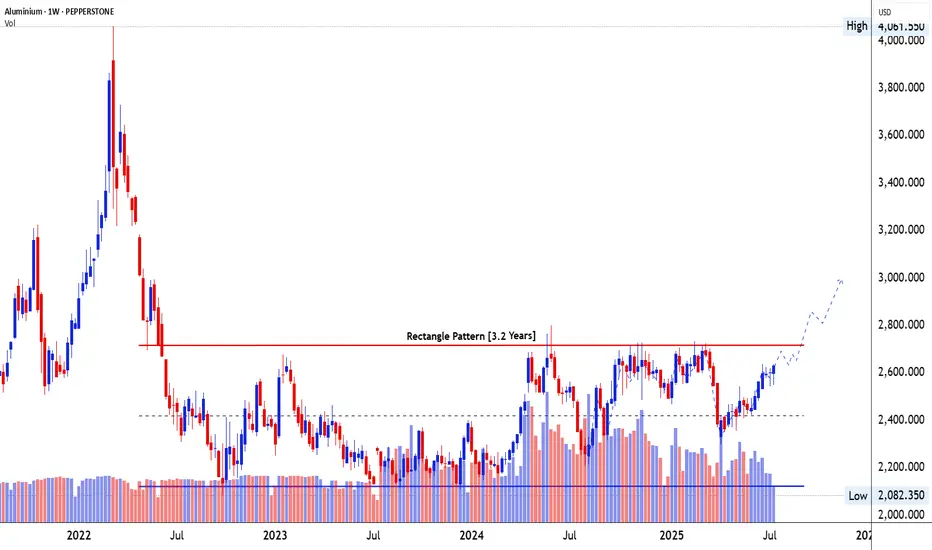
📐 Pattern Identification: A Rectangle Pattern has been forming over 3.2 years, acting as a large-scale accumulation base. This is a continuation pattern typically seen in commodities post major corrections, where price builds energy for the next directional leg.
⏳ Time Taken in Formation: Over 166 weeks (~3.2 years), price has remained within a defined range. This extended time reflects long-term accumulation and the absorption of supply by institutional players. Such long bases often precede explosive breakouts.
📊 Price Trend Before the Pattern: The trend leading into the rectangle was a sharp downtrend from 2022 highs. The drop was vertical, indicating panic or macro stress, followed by multi-year stabilization inside the rectangle.
📦 Price Movement Inside the Pattern: The range has been defined by $2,080 on the lower side and $2,710 on the upper side. Inside this range, the price has respected support and resistance with multiple bounces, forming higher lows since early 2024, hinting at underlying strength and diminishing seller strength.
🚀 Breakout Zone & Behavior: The resistance level at $2,710 is a multi-tested zone, tested over 5–6 times. This increases its significance. Current price is approaching this zone with momentum, and a breakout above it would activate the 3.2-year base, unleashing a possible long-term trend.
2⃣ Volume Behavior & Breakout Validity 🔍
📉 Volume During the Pattern: Volume was consistently high during the early phase of the rectangle, especially near the bottoming area, suggesting accumulation. It gradually tapered off during consolidation — classic sign of supply exhaustion.
📈 Volume Before the Breakout: Recent price candles show expanding volume near higher lows and bullish follow-through candles. This reflects smart money buildup before the expected breakout.
💥 Volume on Breakout Candle: The breakout is not yet confirmed, but once $2,710 is taken out on weekly closing basis, we expect a clear volume spike, validating the breakout.
🔮 Volume After Breakout – What to Expect: Post-breakout, volume must remain above average to sustain momentum. Low volume on breakout would increase false breakout risk. Watch for weekly candle closes above $2,710 with volume expansion for confirmation.
3⃣ Candlestick Dynamics & Trap Awareness 🕯️
🔥 Candles Formed Before Breakout: Recent weekly candles include strong bullish engulfing and hammer candles, especially near the $2,400–2,450 zone. These are reliable reversal signals when formed after higher lows.
💎 Breakout Candle Characteristics (Expected): Ideally, we want a large-bodied bullish candle, closing decisively above $2,710, with minimal upper wick and expanding volume.
⚠️ Impact of the Breakout Candle: A clean breakout with follow-through would invalidate the rectangle resistance and invite fresh breakout buyers. But a failed breakout or long upper wick near $2,710 without volume may lead to a bull trap — especially if price falls back below $2,600.
4⃣ Trade Setup – Entry, Exit & Risk Strategy 🛍️
🛡️ Safe Entry: Wait for weekly close above $2,710, then enter on retest near $2,700–2,720, confirmed by a bullish reversal candle.
⚡ Aggressive Entry: Enter now near $2,630–2,650, with tight SL below the recent higher low at $2,480, anticipating the breakout.
🎯 Target Zones:
Target 1: $3,000 – round number and psychological barrier
Target 2: $3,400 – historical consolidation zone and pattern-measured move (rectangle height projected upward)
🚩 Stop-loss Placement:
Conservative SL: Below $2,600 (minor swing)
Structure-based SL: Below recent higher low – $2,480
5⃣ SEBI Disclosure – Educational Purpose Only 📜
“This report is for educational purposes only and does not offer investment advice. Mr. Chartist (Rohit Singh) is a SEBI Registered Research Analyst under the Investology (INH000012376). Please consult a SEBI-registered advisor before taking any investment decisions. All investments carry risk. Past performance is not a guarantee of future results.”
#Trading #Investing #Stocks #TechnicalAnalysis
ALUMSPOT trade ideas
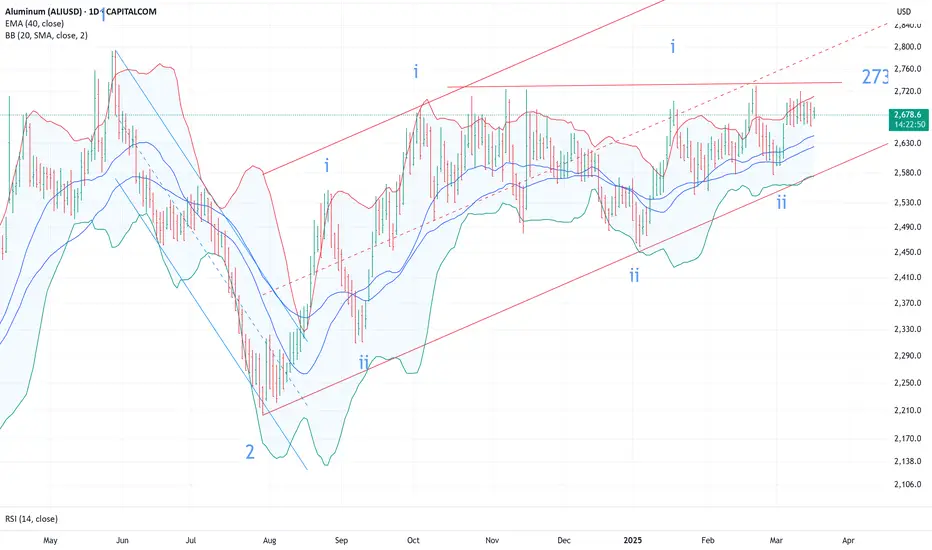
Aluminium prices are waiting for a triggerAluminium prices are forming an ascending triangle pattern where resistance is along a horizontal line but we continue to make higher lows. The breakout point is at 2725. We should be looking at a substantial and sustainable move in the metal in the weeks or months ahead
Aluminum Long ?We can see a uptrend in aluminum as per my analysis we can buy aluminum in future at current price with the stop loss of 200 and we can see good target of 210, 215 and 220 in upcoming days.
In this chart we can see clearly shifty of lower lows on upwards which is showing uptrend.
Thanks

