#APPLE breakout soon #APPLE breakout soon for 388 level in long term
after breakout open to new life time high as charts and pattern shows
Trade ideas
APPLE is about to turn bearish Apple could turn bearish because macro and company factors are aligning negatively.
US debt: Soaring national debt means higher interest rates and weaker consumer demand, which can drag down all high valuation stocks like Apple.
Apple Intelligence flop: Its AI rollout has stumbled delays, underwhelming demos, and quality issues have hurt investor confidence.
Get ready for a strong pull back.

long trade on appleweekly structure is bullish and we are expecting the price to rise from the support levels
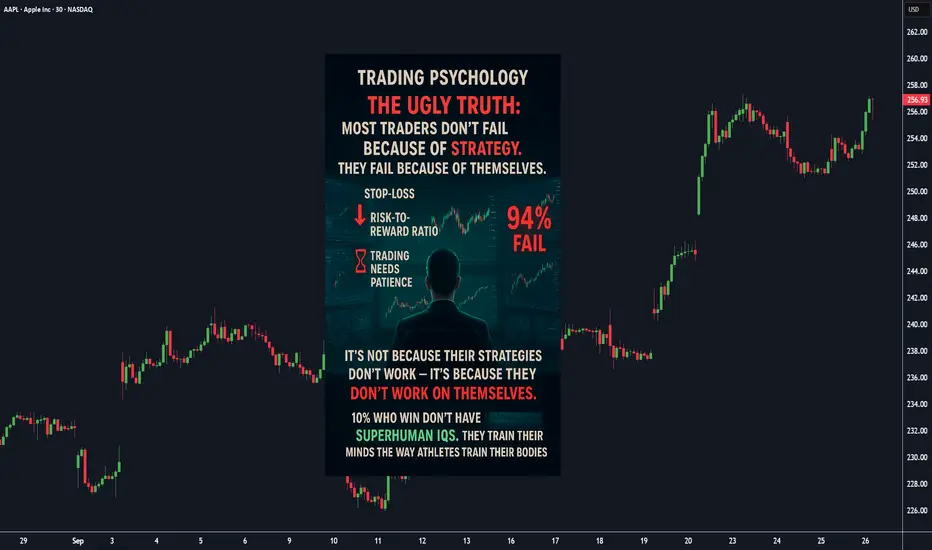
Psychology, Why 90% of Traders Fail (And How to Be the 10%)⚡ The ugly truth: Most traders don’t fail because of strategy. They fail because of *themselves* . It’s NOT bad strategies, it’s bad psychology.
📉 Here’s the real story 👇:
We know about stop-losses.
We know about risk-to-reward.
We know patience matters.
Imagine this: You’ve planned your trade. Price goes against you. Suddenly, your brain whispers:
👉 “Just hold a little longer.”
👉 “Double your position, you’ll recover.”
👉 “Skip the stop-loss this time, it’ll bounce back, praying it turns back.”
NASDAQ:GOOGL
Sound familiar?
That inner voice has blown more accounts than any chart pattern ever did.
🧠 “It’s not because their strategies don’t work—it’s because *they don’t work on themselves*.
✅ The 10% who wins don’t have superhuman IQs . They *train their minds* the way athletes train their bodies.
Here’s how you can upgrade yourself today :
1️⃣ **Detach From Money** → Don’t measure success by today’s P&L.
Measure it by *following your plan*. Consistency is the real wealth.
2️⃣ **Write Your Rulebook 📘** → Define your entries, exits, and risk rules. Print it. Stick it near your screen.
No match = no trade. (Yes, it’s boring. That’s why it works.)
3️⃣ **Journal Your Trades** → Every. Single. Trade. Wins and losses. How did you feel?
Why do you enter?
after doing this, you’ll start to * see your patterns * —and they’ll expose your weaknesses too..
🎯 Success in trading isn’t about predicting/beating the market. It’s about controlling *yourself*, beating your own impulses.
💬 Question for you: Which habit is killing your trades?
NASDAQ:MSFT
If you could fix just ONE habit right now:— what would it be?
Which one would change your results the most?
1️⃣ Overtrading 🔂
2️⃣ Revenge Trading ⚔
3️⃣ Ignoring Risk ⚠
4️⃣ chasing losses 🏃➡️
5️⃣ No 📘rulebook/📰Journal
💬 Comment below ⬇️
I'll post my new content accordingly.
Happy Trading and Investing!
Regards:
@TradeWithKeshhav
Bullish Signs from AMZN Options Chain Sept 29, 2025Bullish Signs from AMZN Options Chain
The AMZN options chain for the September 26, 2025 expiry shows strong buy-side activity, with significant open interest in near-term call options around key strike prices such as 230, 235, and 240. Notably, the open interest stands at 30,319, 27,281, and 25,454 contracts respectively, accompanied by increasing trading volumes, indicating solid market confidence.
Moreover, the call option Delta distribution and the implied volatility levels suggest that institutional players are leaning bullishly, and volatility remains moderate, implying there is room for continued upward momentum without panic buying.
Overall, the positioning and trading volume in the options market reflect active accumulation by both institutional and retail investors, signaling strong short-term bullish momentum for AMZN, and increasing the likelihood of the stock challenging new highs in the coming week.
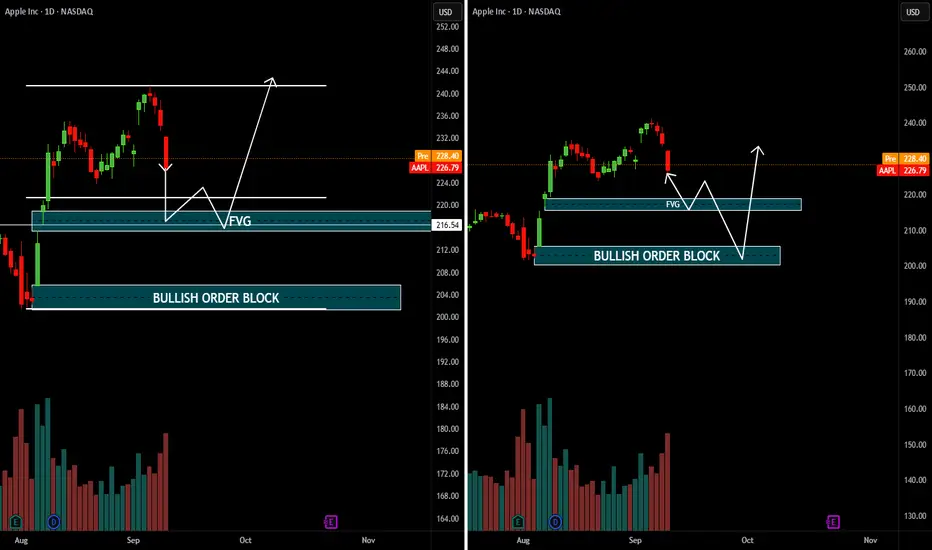
APPLETechnical Outlook
Immediate Support:
216 (FVG zone) → first reaction level.
200–204 (Bullish OB) → stronger demand zone if deeper correction happens.
Resistance / Targets:
Near-term resistance at 232–236 (recent high).
Breakout above this could open path to 248–252.
Bias:
Still bullish as long as price holds above 200 OB zone.
Any dip into FVG / OB is a potential buy opportunity
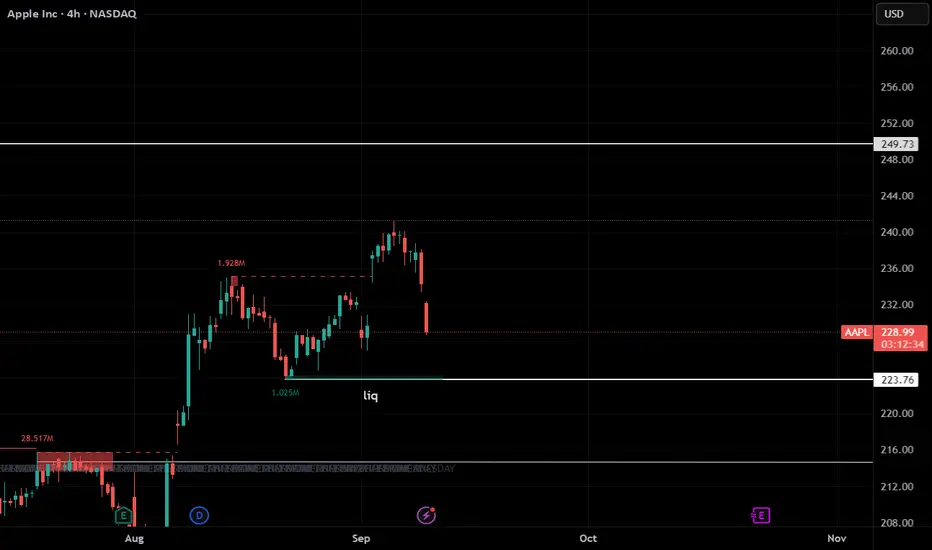
AAPL STOCKS BEARISH wait for liquidity hunt and take long entry in apple stocks
liq hunt price = 223 $
TARGET =249 $
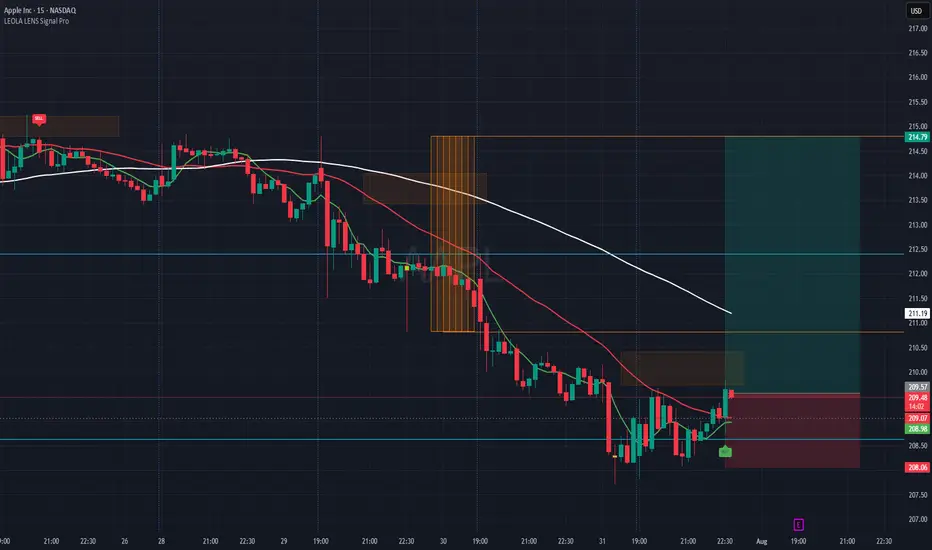
AAPL-Reaction Setup Lower Structure Zone-Eyes LongThis chart captures a structure-aware buy setup on Apple Inc. (AAPL), using Leola Lens SignalPro with momentum overlays and risk visualization.
What the Chart Shows:
🟢 A new BUY label appeared after price tapped a previously marked liquidity zone.
📉 Prior bearish momentum exhausted near 208.50–208.90 area — forming a potential base.
🟥 Overhead resistance is clearly defined, aligning with a recent rejection block and moving average confluence.
✅ A well-defined Risk:Reward setup is plotted — aiming for continuation toward 214.79, with risk below 208.06.
Key Levels to Monitor:
🔺 Break and hold above 210.50 could shift bias toward bullish continuation.
⚠️ Failure to hold above 209.00 could invalidate the current intraday structure.
This view is for educational purposes only — illustrating how price reacts around structure, liquidity, and confirmation signals.
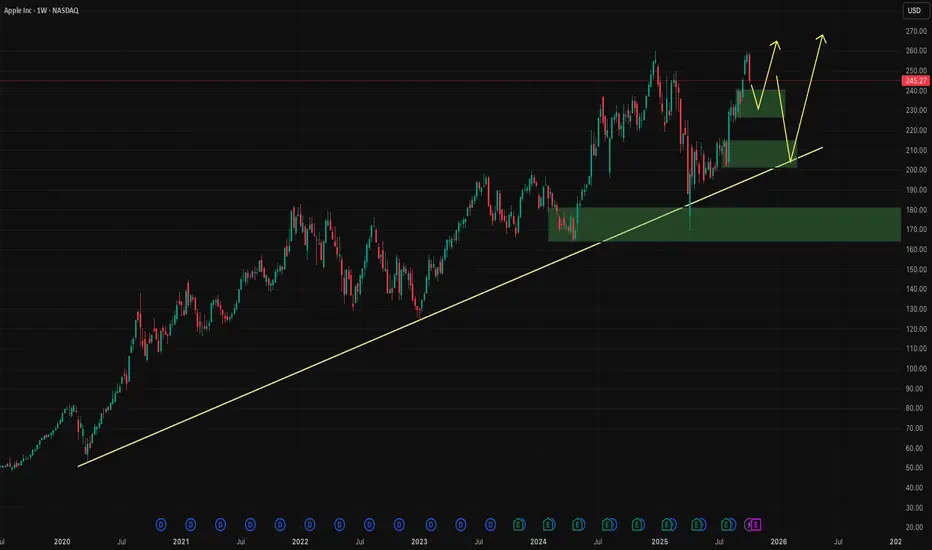
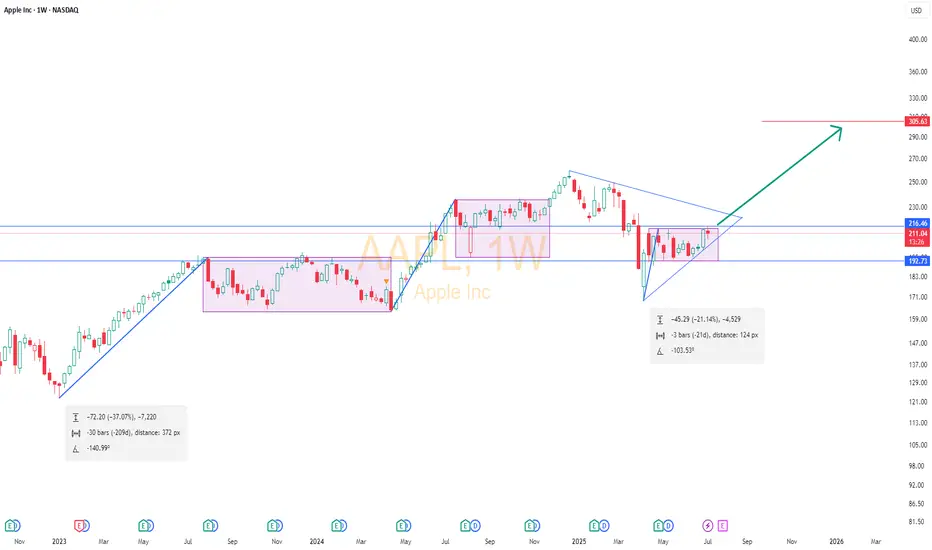
Aapl📈 NASDAQ:AAPL Weekly Chart Update
Apple is forming its third bullish flag since Jan 2023.
🔹 Flags:
1️⃣ Jan 2023 – Feb 2024
2️⃣ May 2024 – Mar 2025
3️⃣ Ongoing since Apr 2025
🔺 A triangle formation from Dec 2024 to Apr 2025 low is also converging.
💥 Breakout level: Weekly close above $216
📉 Stop Loss: $193 (weekly close)
🎯 Target: $305 in coming weeks
Technicals point to a strong bullish setup. Keep it on watch!
#AAPL #Apple #StockMarket #ChartAnalysis #TradingView
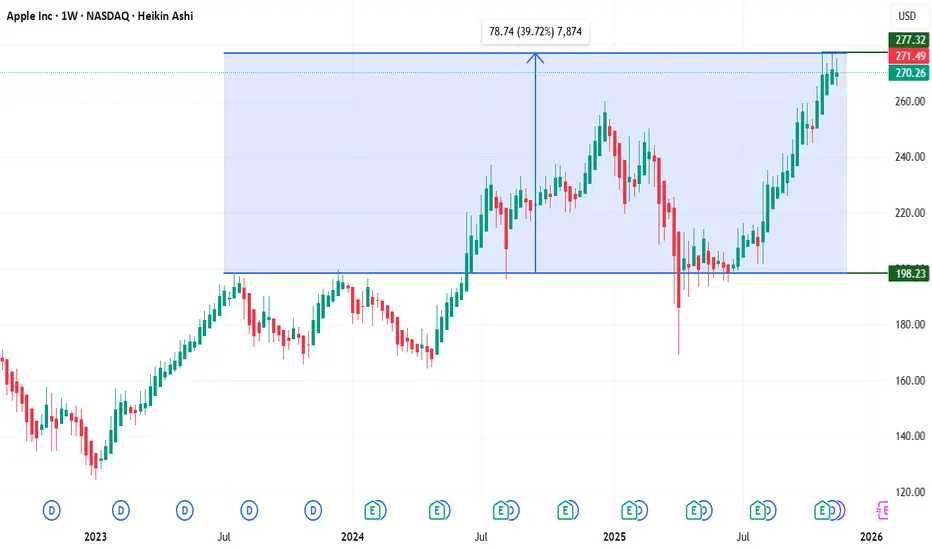
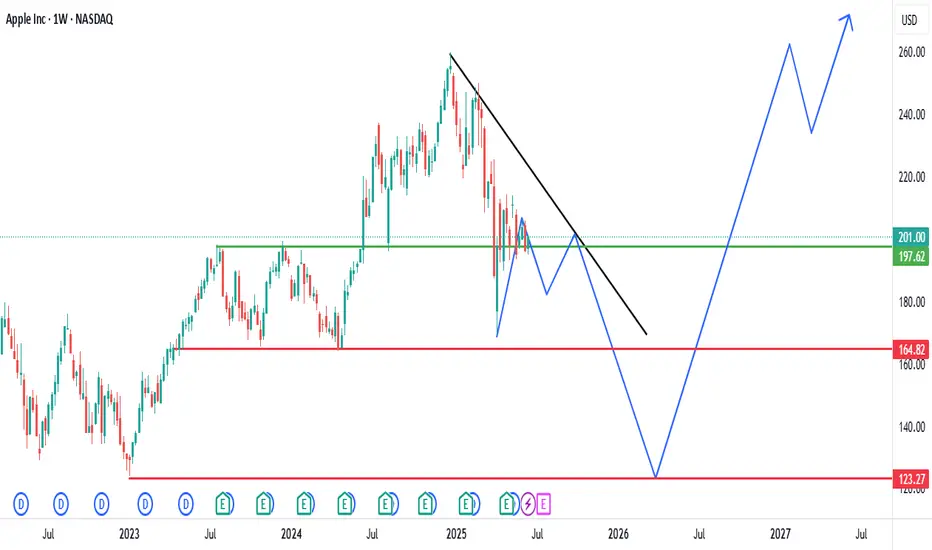
Analysis of Apple Inc. (AAPL) Weekly ChartHistorical Trend: The chart shows Apple Inc.'s stock price on a weekly timeframe from 2022 to mid-2025. The stock exhibited a strong upward trend from 2022 to early 2025, with notable growth followed by periods of consolidation and correction.
Key Levels:
Resistance: The $201.00-$197.62 range (green line) has acted as a significant resistance level. The price recently broke above this zone, suggesting potential bullish momentum.
Support: The $164.82 level (red line) has served as a major support zone. The stock tested this level during a recent decline and rebounded, indicating its strength.
Recent Price Action: After reaching a peak near $201.00, the stock entered a descending triangle pattern (black trendline). A breakout above the resistance at $201.00 is evident, accompanied by an upward projection (blue arrow), hinting at a possible continuation of the bullish trend.
Projected Movement: The upward projection suggests the stock could target levels around $240.00-$260.00 if the breakout holds. However, a failure to maintain above $201.00 might lead to a retest of the $164.82 support.
Volume and Indicators: The chart includes Bollinger Bands (O197.30 H201.70 L195.07 C201.00) with a -4.55 (-2.22%) change, indicating recent volatility. Specific volume data is not detailed, but the breakout suggests increasing buying pressure.
Outlook: The stock is currently in a bullish phase following the breakout above $201.00.
Maintaining above this level could drive further gains, while a drop below might signal a return to the $164.82 support. Close monitoring of price action around these levels is recommended.
Buy Apple Inc. (AAPL)Apple Inc. (AAPL)
Current Price: $204.60
Trend: Uptrend
Technical Indicators:
Support: $202.84
Resistance: $207.91
PE Ratio: 40.27
EPS: $6.30
Trade Setup:
Entry Point: Around $204.60
Target Price: $207.91 (short-term), $215 (extended)
Stop Loss: $202.84
Rationale: Apple continues to demonstrate strong financial performance with a solid PE ratio and EPS. The stock is in an uptrend, and technical indicators suggest potential for further gains.
Investopedia
+19

AB = CD Apple: Daily Vision
The trend is clearly bullish, and selling in this context could be risky. However:
Resistance Break: The price recently broke a resistance level (red zone / white arrows) but has not yet performed a pullback.
Scenario to Watch: If the price returns to the support/polarity zone, it could offer a potential buying opportunity to aim for an AB = CD pattern.
Key Points:
Uncertainty: It’s unclear whether the price will pull back to the support zone or reach the target directly without a correction.
Plan: I have set up a plan and will stick to it.
Conclusion:
If the price revisits or approaches the support zone (or the rising trendline), I will look for a potential buy setup.
⚠️ Disclaimer: This analysis reflects my personal perspective and is not financial advice.

Apple Share D1This year, artificial intelligence played a key role in two Nobel Prizes for scientific achievement. One prize was awarded for developing the technology, while the other was for its application. These two Nobel Prize wins clarify that AI is here to stay. However, key issues such as regulations, ethical use, and other potential risks, still need to be resolved for responsible and sustainable integration into society.

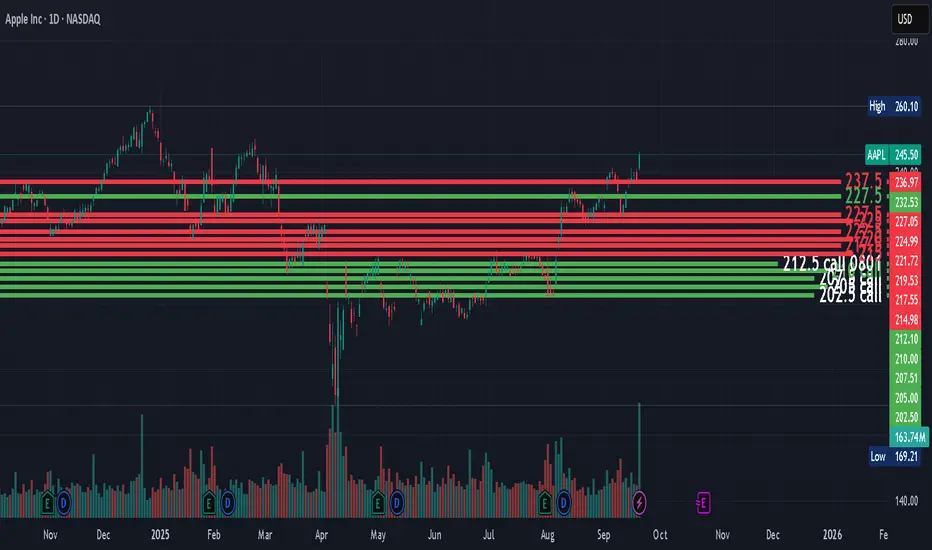
Apple Inc. Key Resistance Breakout SetupI'm observing an interesting setup on Apple Inc. (AAPL) on the daily timeframe. The price has approached a critical resistance level at $236–$237.50, which has acted as a rejection point in the past. A breakout above this level with a successful retest could confirm bullish momentum.
### My Game Plan:
- **Breakout Confirmation**: Wait for the price to break above $237.50 with strong volume.
- **Retest Entry**: If the price pulls back to retest the $236–$237.50 zone and shows bullish rejection, it could offer a low-risk entry point.
- **Target**: Post-breakout, the price could potentially rally towards $245 and beyond.
- **Stop Loss**: Placed below the $234 level to minimize downside risk.
### Key Notes:
This setup aligns with my approach of trading breakouts with confirmation and retests. Remember to manage risk and use proper position sizing.
What are your thoughts on this ? Let me know in the comments!

Apple Next move is the Pole Target at 269 USDApple is forming a Flag Pattern, and Breakout above the Pattern is expected. The Next Target is the Pole Target price at $269, offering a potential Profit with an 18.8% ROI.
I want to help People Make Profit all over the "World".

APPLE is ready for bullish reversalApple was in a downtrend from couple of weeks and now it has broken its structure at the level of 223.94 with a strong bullish candlestick and changed its character at 225.35 with a bullish closing i've entered a long position at 224 with stop loss of 221 and i'm targeting the levels of 229.81, 234.70, 237.51. once it is successful in closing above 228.18 it will show strong bullish move hitting all the targets

Apple is ready for big rally again. CMP 225. Apple is ready for big rally again. CMP 225.
Target 250.
Entry Price 225.
Stoploss 218.
If you look at the current Price action it should give good RR.

Apple for 20% gain in 4 monththere is good chance to make 20% in AAPL . further this stock can go only 5-10% down but can go up for 20-30% in 4-5 month.
good time to invest in this stock.


Apple Dropping the #Apple stock price is a natural moveDropping the #Apple stock price is a natural move. Warren Buffett, regardless of the buzz, aims to guide the masses toward the profit side of the market maker's pocket. Interestingly, Warren Buffett sold the stock when the market was closed, resulting in no immediate impact on Apple's stock price. #applestock #WarrenBuffett

APPLE STOCKS TREND DOWN AFTER WARREN BUFFET SELLING 50% STOCKApple stock price make high 236.92 and buffet start the selling of apple stock its dumped the price of stock 55.02% now scenario is apple start falling the price of stocks my scenario is you will get the opportunity because my analysis show me a down trend in apple stocks after that buffet selling the stocks price close on Friday around 221.73 i give a scenario to buy stocks on different level .
1. 207.04 $
2. 197.14 $
3. 192.36 $
4. 186.55 $
IF apple stocks break down the level of 164.03 you will see sharp fall in apple stocks.
You will invest your wealth so don't be greedy some times institution play games with retail investor so before you invest your wealth look around the your financial condition and your risk because you know its risky some times. we need to wait when institution players enter in the market for manipulation.
Wait and watch then enter in the market grow together .

Apple - Conditional Long Monthly ChartsMultiple Times has reacted from the 176-178 Levels. If however 184 level breaks will see new heights for the stock 200++

Apple Strong is the Out Perform the MarketApple as a share is Strong movement, Most of the people think that Warren Buffet is not taking risk hence he is invest Apple but this chart is Good Answer.
If you are looking in the Risk free with technolgy company this is the one of tham. I am currently bullish but currently risk is high as compare to the Reward
