Fiscal Policy Risk and Its Impact on Debt Markets1. Understanding Fiscal Policy Risk
Fiscal policy risk refers to the uncertainty that arises from government budgetary actions, particularly when those actions impact the broader economy and financial markets. It is associated with the possibility that fiscal decisions—such as changes in tax rates,
Amazon.com, Inc. Shs Cert Deposito Arg Repr 0.00694444 Sh
No trades
65 ARS
96.73 T ARS
892.88 T ARS
About Amazon.com, Inc.
Sector
Industry
CEO
Andrew R. Jassy
Website
Headquarters
Seattle
Founded
1994
IPO date
May 15, 1997
Identifiers
2
ISIN ARBCOM460176
Amazon.com, Inc. engages in the provision of online retail shopping services. It operates through the following business segments: North America, International, and Amazon Web Services (AWS). The North America segment includes retail sales of consumer products and subscriptions through North America-focused websites such as amazon.com and amazon.ca. The International segment offers retail sales of consumer products and subscriptions through internationally-focused websites. The Amazon Web Services segment involves in the global sales of compute, storage, database, and AWS service offerings for start-ups, enterprises, government agencies, and academic institutions. The company was founded by Jeffrey P. Bezos in July 1994 and is headquartered in Seattle, WA.
Related stocks

Part 1 Intraday Trading Master Class How Option Pricing Works
Option prices (premiums) depend on multiple factors:
1. Underlying Price Movement
Biggest factor.
CE rises when market rises.
PE rises when market falls.
2. Time to Expiry (Theta)
As expiry approaches, options lose value due to time decay.
Buyers suffer from theta.

As U.S. stocks head into the fourth quarter, investors are once (AMZN) seasonal advantages and structural market factors. Multiple bullish signals are currently aligning in favor of AMZN.
Santa Claus Rally Support
Historical data shows that from late November through early January, U.S. equities often experience what is known as the “Santa Claus Rally.” For Ama

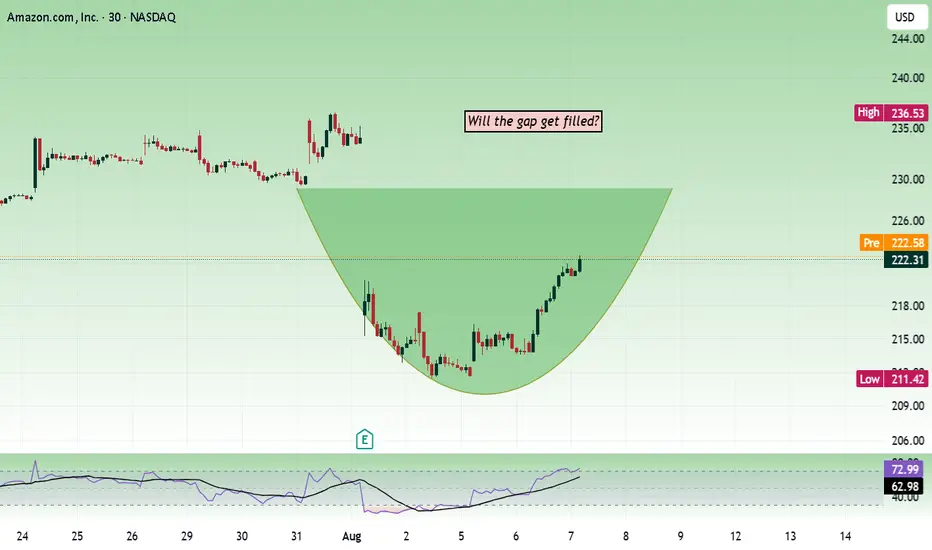
Amazon - Will the gap get filled?Price is sustaining an important level of 220. It can make the price move towards the 230 zone.
Below 220, the price will start to lose bullish strength. The next support is at 200–202, with 220 being a strong support.
Buy above 221.5 with the stop loss of 220 for the targets 223, 224.5, 227, and 22
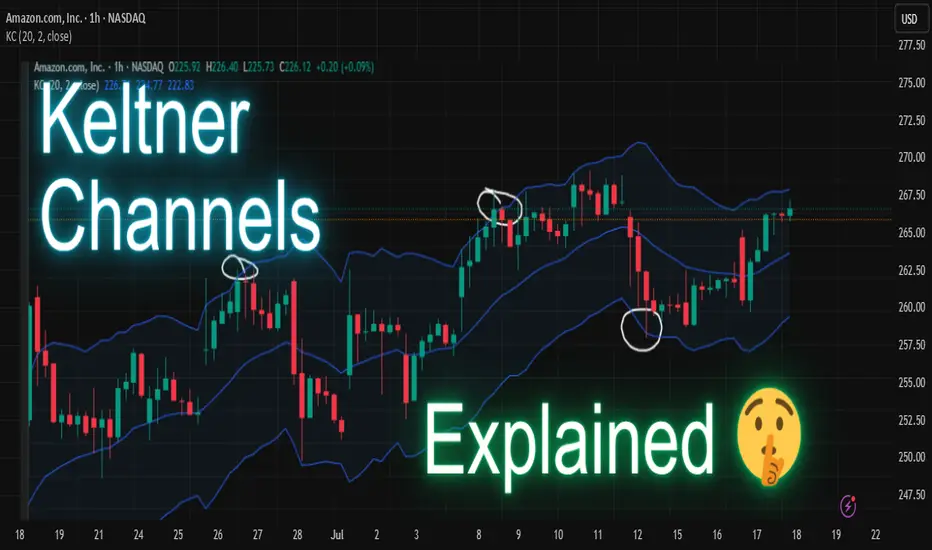
The Keltner Channels Indicator ExplainedDive into the world of Keltner Channels—a powerful volatility-based indicator used by traders to spot trends, reversals, and breakout opportunities! Let’s see how you can use it to enhance your trading decisions. 🚀
What Are Keltner Channels? 🤔
Keltner Channels consist of three lines plotted aroun
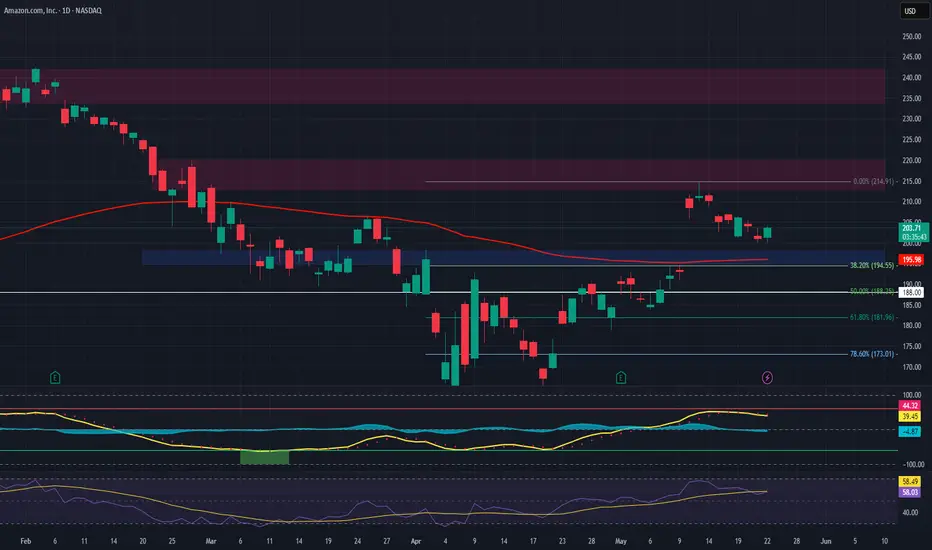
Amazon on shot high selling pressureThe chart depicts the weekly price movement of Amazon (AMZN) stock from 2022 to mid-2025, with a focus on a recent period around June 2025. Here’s an analysis based on the provided chart:
Historical Trend: The stock experienced a significant upward trend from 2022 to mid-2024, showing consistent gr

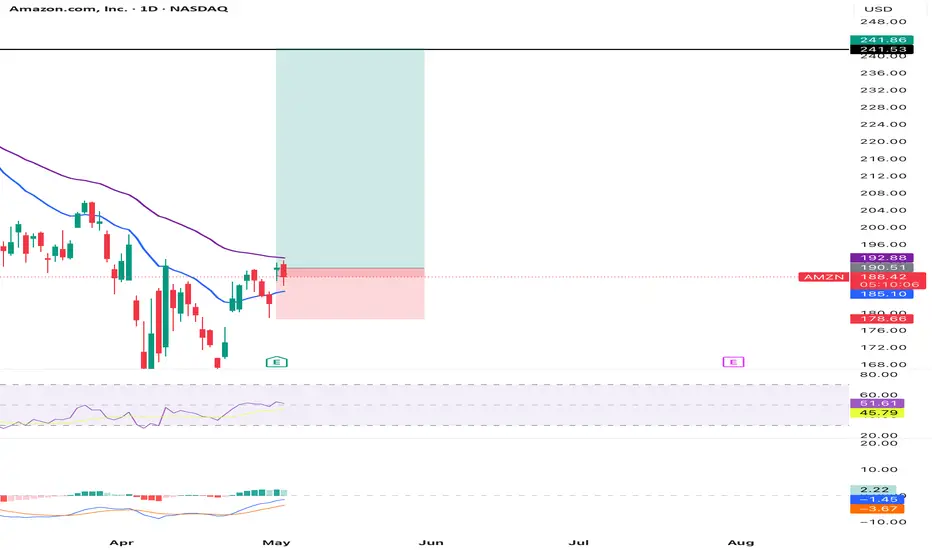
AMZN – Long Spot Trade Setup at Key SupportAmazon NASDAQ:AMZN is currently retracing into a major support level near $195, offering a solid long opportunity as broader market momentum holds up. This level has previously acted as a strong base, and price could now be positioning for a bullish continuation.
🔹 Entry Zone:
Around $195 (major
Amazon (AMZN) Swing Trade Analysis## Amazon (AMZN) Swing Trade Analysis
**Timeframe: 4H Chart (as per your screenshot, May 2, 2025)**
---
### **Technical Overview**
#### **1. Price Structure**
- **Trend:** The chart shows a recent reversal from a downtrend, with price making higher lows and attempting to break resistance around
Amazon analysisAccording to chart pattern, Amazon could face a downfall as other companies doing well in field of AI. Yet, Amazon didn't announce anything about AI project and not developing infrastructure for the same.

$AMZN - Possible Inverse Head & Shoulders NASDAQ:AMZN - Possible Inverse Head & Shoulders - Measured Move $225 which lines up with 200 SMA (yellow line). Let's see if we can get a breakout.

See all ideas
Summarizing what the indicators are suggesting.
Oscillators
Neutral
SellBuy
Strong sellStrong buy
Strong sellSellNeutralBuyStrong buy
Oscillators
Neutral
SellBuy
Strong sellStrong buy
Strong sellSellNeutralBuyStrong buy
Summary
Neutral
SellBuy
Strong sellStrong buy
Strong sellSellNeutralBuyStrong buy
Summary
Neutral
SellBuy
Strong sellStrong buy
Strong sellSellNeutralBuyStrong buy
Summary
Neutral
SellBuy
Strong sellStrong buy
Strong sellSellNeutralBuyStrong buy
Moving Averages
Neutral
SellBuy
Strong sellStrong buy
Strong sellSellNeutralBuyStrong buy
Moving Averages
Neutral
SellBuy
Strong sellStrong buy
Strong sellSellNeutralBuyStrong buy
Displays a symbol's price movements over previous years to identify recurring trends.
AMZN6237342
Amazon.com, Inc. 5.55% 20-NOV-2065Yield to maturity
5.68%
Maturity date
Nov 20, 2065
AMZN5182960
Amazon.com, Inc. 3.25% 12-MAY-2061Yield to maturity
5.58%
Maturity date
May 12, 2061
AMZN6237344
Amazon.com, Inc. 5.45% 20-NOV-2055Yield to maturity
5.57%
Maturity date
Nov 20, 2055
AMZN4531868
Amazon.com, Inc. 4.25% 22-AUG-2057Yield to maturity
5.57%
Maturity date
Aug 22, 2057
AMZN5396185
Amazon.com, Inc. 4.1% 13-APR-2062Yield to maturity
5.56%
Maturity date
Apr 13, 2062
AMZN4996701
Amazon.com, Inc. 2.7% 03-JUN-2060Yield to maturity
5.54%
Maturity date
Jun 3, 2060
AMZN5182959
Amazon.com, Inc. 3.1% 12-MAY-2051Yield to maturity
5.50%
Maturity date
May 12, 2051
AMZN5396184
Amazon.com, Inc. 3.95% 13-APR-2052Yield to maturity
5.48%
Maturity date
Apr 13, 2052
AMZN4996700
Amazon.com, Inc. 2.5% 03-JUN-2050Yield to maturity
5.47%
Maturity date
Jun 3, 2050
AMZN4531866
Amazon.com, Inc. 4.05% 22-AUG-2047Yield to maturity
5.42%
Maturity date
Aug 22, 2047
US23135AQ9
Amazon.com, Inc. 4.95% 05-DEC-2044Yield to maturity
5.23%
Maturity date
Dec 5, 2044
See all AMZN bonds