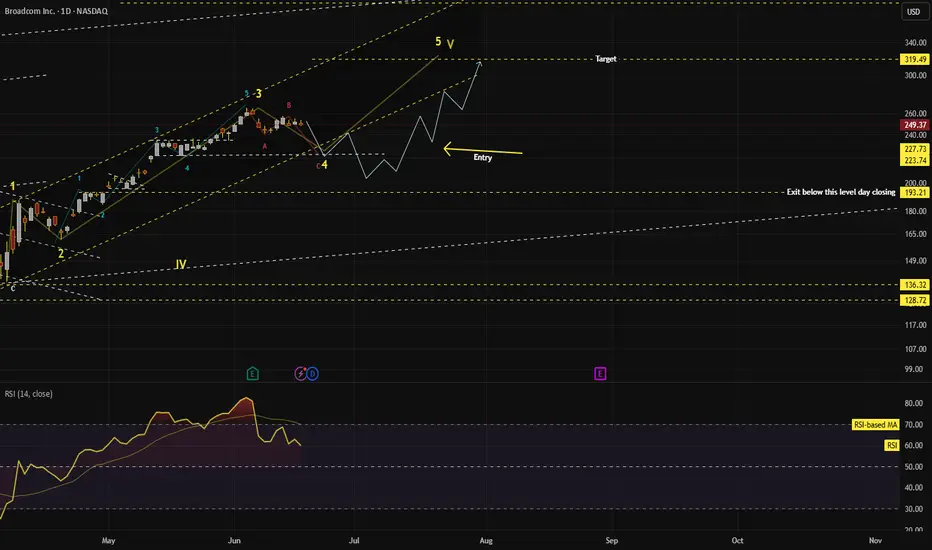
Broadcom (AVGO) can correct till 206, post that a target of 315 AVGO has completed its lower degree 5 waves and higher degree wave-3.
Currently it is correcting in ABC waves.
Blue line depicts probable path it may take correcting and then taking turn up towards a target of 315, which completes its higher degree Wave-5 and mostly larger Wave-5(Wave-V).
How can one enter ?
Wait for price to correct and make a entry pattern(as per Price action and RSI divergence)
Exit will be around 315 or any rule based system.
When this view will be negated:
If daily price closes below 193.25 above view gets negated.
AVGOC trade ideas
AVGO -Symmetrical triangle -Daily - Unusual volume **Broadcom Inc. (AVGO)** chart and presents a technical analysis of the stock on a daily timeframe.
Key highlights:
1. **Bullish Pattern**: The chart seems to show a series of bullish moves with higher highs and higher lows, which are connected by yellow lines. This pattern may be interpreted as an symmetrical triangle, a bullish continuation pattern.
2. **Breakout**: A breakout is indicated on the right side of the chart, which seems to have occurred on **high volume**, further supporting the bullish momentum.
Retested the breakout trendline and bounced.
3. **Measured Move Projection**: The breakout projection indicates a potential price target of **$227.78**, which is calculated from the height of the triangle (about $60.12 from the low). This is approximately **48.25%** higher than the start of the upward move.
4. **Stop-Loss (SL)**: A stop-loss level is mentioned around **$165**, to manage risk in case the breakout fails.
5. **Volume**: A significant increase in volume is noted at the breakout, which adds confidence to the strength of the move.
### Potential Scenario:
- If the breakout holds, the target of **$227.78** could be achieved in the next rally.
- However, a pullback or consolidation near **$165** could be possible before the price moves higher.


MATRIX portfolio AVGO/USD : Smart money levelsNo description needed.
I just spot where the value should be or where are the levels smart-money and institutionals traders and investors look for buy entry's, according to Fibonacci retracements.
NOT FINANCIAL ADVICE
MORPHEUS.
