HDFC BANK LTD PARALLEL CHANNEL BREAKOUTHDFC BANK was traded in channel from past few years and made a breakout with good volume. Entry price at ₹990, with a STOPLOSS ₹940 and TARGET ₹1,190
Trade ideas

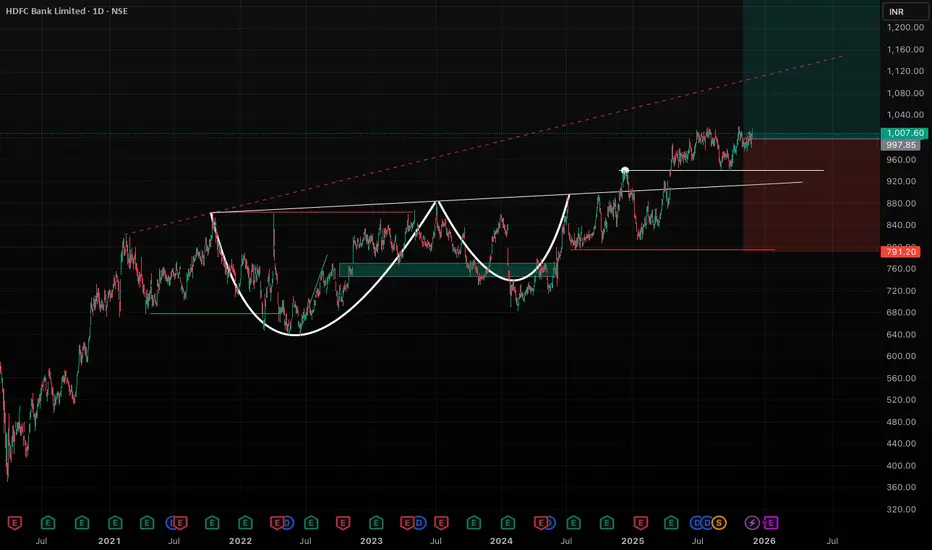
HDFC Bank: Massive Multi-Year Cup-and-Handle BreakoutHDFC Bank is showing a very bullish multi-year Cup-and-Handle breakout. Price has finally broken above the long-term horizontal resistance zone and is now retesting it as support. This stock is also in majority of mutual fund's top holdings, so this makes it a safer bet.
HDFC Bank is long consolidatingAbove 1415 if this share starts holding. We can target the resistance line for the first target. Other targets are open as the share has corrected a lot.

HDFCBANK 1 Week Time Frame 🔹 Quick Snapshot
1. The current share price is about ₹ 1,015.
2. 52‑week range: Low ≈ ₹ 812.15, High ≈ ₹ 1,020.50.
3. Recent weekly momentum and technicals appear neutral-to‑slightly bullish: short‑term indicator signals mostly “buy”, and momentum oscillators (like MACD) are supportive.
🔄 What to Watch: Scenarios for the Week
Bullish breakout: If HDFC Bank closes above ~₹ 1,011–₹ 1,013 with good volume, there’s potential to rally toward ₹ 1,025–₹ 1,038 in coming days.
Range‑bound / consolidation: If price hovers between ₹ 984–₹ 1,013, expect sideways action — possibly oscillating in that band.
Bearish breakdown: A decisive close below ₹ 984 may send it toward ₹ 970–₹ 956, increasing risk of deeper downside, especially if market sentiment turns weak.

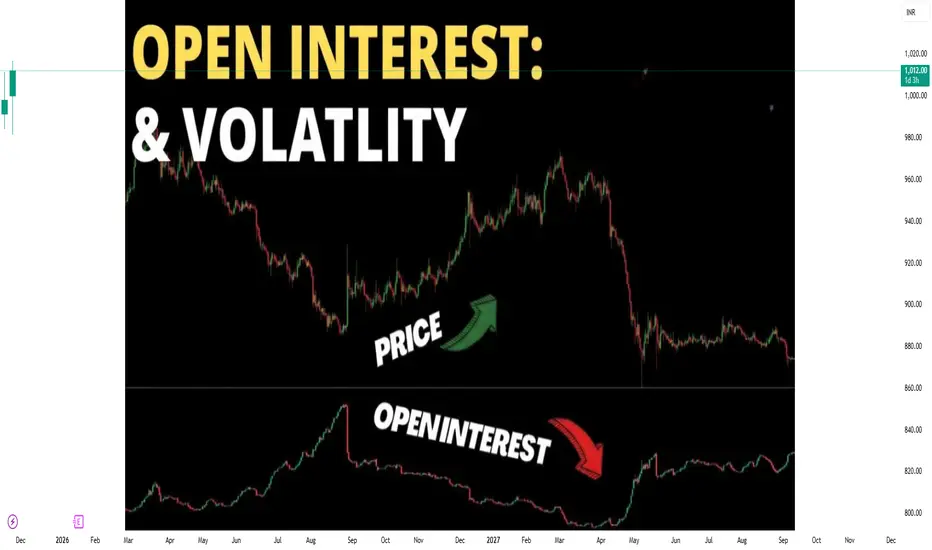
Relationship Between Open Interest and VolatilityIntroduction
In the world of derivatives trading, particularly in futures and options markets, understanding open interest and volatility is crucial for traders and investors. Both metrics provide critical insights into market sentiment, liquidity, and potential price movements. While open interest indicates the number of outstanding contracts, volatility reflects the degree of price fluctuations over time. The relationship between these two variables can reveal hidden trends, market momentum, and potential reversals, making them indispensable tools in trading strategies.
Understanding Open Interest
Open interest (OI) refers to the total number of outstanding contracts, either futures or options, that have not been settled or closed. Each open contract has a buyer and a seller, and OI increases when new positions are added to the market and decreases when positions are closed or exercised.
Key characteristics of open interest include:
Market Activity Indicator: Rising OI indicates the influx of new money and active participation in a particular contract.
Trend Confirmation Tool: Increasing OI along with rising prices generally indicates a strong bullish trend, whereas increasing OI with falling prices signals a strong bearish trend.
Liquidity Measure: Higher OI ensures better liquidity, tighter bid-ask spreads, and easier execution for traders.
Position Insight: OI can also help identify accumulation or distribution phases in the market.
For example, if a stock’s call options show rising OI while the underlying price rises, it may suggest that traders are bullish and expect further price gains. Conversely, rising OI in put options during a declining market may indicate growing bearish sentiment.
Understanding Volatility
Volatility represents the degree of variation in a security’s price over a specific period. It is a critical measure of market risk and uncertainty, and it directly impacts derivatives pricing, especially options.
Volatility can be classified as:
Historical Volatility (HV): Measures the past price fluctuations of an asset over a defined period.
Implied Volatility (IV): Reflects the market’s expectations of future price movements, derived from the prices of options.
Realized Volatility: Actual observed price movements over time.
High volatility indicates larger price swings and higher risk, whereas low volatility signals more stable price movement. Volatility affects traders’ decisions because it impacts potential profit and loss, option premiums, and hedging strategies.
Interplay Between Open Interest and Volatility
The relationship between open interest and volatility is complex and dynamic. Observing changes in OI alongside price movements can help traders interpret market behavior and anticipate potential trends.
Rising Open Interest with Rising Prices:
When both prices and OI increase, it usually indicates strong bullish momentum and higher trader confidence.
Increased participation can lead to higher liquidity, which may moderate volatility in the short term, as the market can absorb larger trades without drastic price swings.
Rising Open Interest with Falling Prices:
Rising OI amid falling prices suggests bearish sentiment is strengthening.
This can increase market volatility because more traders are actively participating in the trend, and any sudden news or market shock could amplify price swings.
Falling Open Interest with Rising Prices:
When OI declines as prices rise, it often signals short-covering or profit-taking.
This situation may lead to reduced volatility over time, as speculative positions are being closed, and fewer traders remain exposed to the market.
Falling Open Interest with Falling Prices:
Decreasing OI with declining prices typically indicates a liquidation phase where traders are exiting positions.
This can reduce market volatility, as downward movements are less fueled by speculative trading and more by position unwinding.
Open Interest as a Leading Indicator of Volatility
Open interest can act as a leading indicator for future volatility. Since OI reflects the number of active contracts and overall market participation, sudden spikes or drops in OI often precede changes in market volatility.
High Open Interest Levels:
When OI is unusually high, the market is crowded with positions.
Any unexpected news can trigger sharp price swings, increasing volatility, as traders rush to adjust or close positions.
Low Open Interest Levels:
Low OI indicates reduced market participation.
In such scenarios, even small trades can cause large price movements, resulting in high volatility despite low market participation.
Unwinding and Reversals:
A sudden decline in OI after a prolonged trend can hint at potential trend exhaustion.
Volatility often spikes during such reversals as traders adjust positions in anticipation of market corrections.
Practical Applications in Trading
Traders use the relationship between OI and volatility in multiple ways:
Trend Analysis:
Combining price trends with OI helps identify whether a market move is supported by new money or merely a short-covering rally.
For instance, a bullish trend with rising OI indicates genuine accumulation, while a bullish trend with falling OI may suggest the move is unsustainable.
Options Trading:
Implied volatility in options pricing is closely monitored alongside OI.
High OI in options, coupled with rising IV, often signals expectations of significant price movement, providing trading opportunities for straddles or strangles.
Risk Management:
Traders can use OI and volatility together to manage exposure.
For instance, high volatility with rising OI may warrant tighter stop-loss levels to protect against sudden adverse moves.
Liquidity Assessment:
OI levels indicate how easy it is to enter or exit positions.
High OI paired with moderate volatility ensures sufficient liquidity without excessive risk of large swings.
Limitations
While the relationship between OI and volatility is useful, traders should be aware of its limitations:
Lagging Nature: OI changes may not immediately reflect price reversals.
Market Manipulation: Large players can artificially inflate OI to mislead other traders.
External Factors: Macro events, earnings reports, geopolitical developments, and economic data can affect volatility independently of OI.
Thus, relying solely on OI and volatility without other technical or fundamental analysis can lead to misleading conclusions.
Conclusion
The relationship between open interest and volatility offers deep insights into market dynamics. Open interest measures trader participation and sentiment, while volatility quantifies market risk and price fluctuations. Together, they provide a framework for understanding trends, anticipating reversals, and making informed trading decisions. Rising OI often signals strong trends, while shifts in volatility highlight the market’s reaction to these trends. Traders who effectively combine these metrics with price analysis, market news, and other indicators can better navigate complex markets and optimize trading strategies.
In essence, open interest and volatility are intertwined indicators: OI reflects the quantity of market commitment, while volatility reflects the intensity of price reactions. Recognizing their interplay is essential for professional traders and retail investors alike, providing both predictive power and strategic guidance in derivatives markets.
Price Action Trading1. What is Price Action Trading?
Price action trading is the analysis of raw price movement on a chart. It involves studying candlestick patterns, support and resistance zones, trendlines, breakouts, volume behavior, and the psychology behind market participants’ actions. Instead of using lagging indicators, price action traders focus on:
Higher highs and higher lows
Support and resistance
Market structure
Trend strength
Candle patterns
Order flow concepts
Because price is immediate and reflects the most recent market decisions, price action helps traders stay aligned with real-time sentiment and avoids the delays of indicators.
2. Why Price Action Works
Price action works because it is rooted in the core principle of markets:
All buying and selling decisions are reflected in price.
Every candlestick tells a story:
A long wick shows rejection.
A big body shows strength.
A small range candle shows indecision.
A breakout candle signals aggression.
Unlike indicator-based trading, price action teaches traders to understand why something is happening, not just what is happening. This deeper understanding is why professional traders and institutional players rely heavily on price action.
3. Core Components of Price Action Trading
(A) Market Structure
Market structure is the backbone of price action. It tells you whether the market is trending, consolidating, or reversing.
Uptrend:
Higher Highs (HH)
Higher Lows (HL)
Downtrend:
Lower Highs (LH)
Lower Lows (LL)
Range:
Horizontal support and resistance
Equal highs and equal lows
Once you know the structure, you know the bias.
(B) Support and Resistance (S/R)
Support and Resistance are areas where price reacts repeatedly because buyers or sellers defend those levels. They are widely used in price action trading.
Support: A level where buying pressure exceeds selling pressure.
Resistance: A level where selling pressure exceeds buying pressure.
The strongest S/R zones have:
Multiple touches
Volume confirmation
Trend alignment
Psychological round numbers (like 100, 500, 1000)
(C) Candlestick Patterns
Candlesticks reflect market psychology and reveal what buyers and sellers are doing.
Key price action patterns include:
Pin Bar (Hammer / Shooting Star) – Strong rejection
Engulfing Pattern – Trend reversals or continuation
Inside Bar – Low volatility → breakout setup
Doji – Indecision
Marubozu – Strong directional momentum
Candlesticks are tools for confirming entries and exits.
(D) Breakouts and Fakeouts
Price often breaks above or below important levels. But not all breakouts sustain. Many fail — known as fakeouts.
A good price action trader learns to differentiate between:
True breakout: High volume, strong candle body, retest
False breakout: Wick break, low volume, immediate reversal
Fakeout trading is one of the most profitable techniques when mastered.
(E) Trendlines and Channels
Trendlines help visualize structure and momentum. Two or more touches create a valid trendline.
Channels (rising or falling) help traders locate:
Buying opportunities at lower boundary
Selling opportunities at upper boundary
Breakouts at structure collapse
Trendlines enhance clarity in volatile markets.
4. Price Action Entry Techniques
There are several reliable entry models:
(A) Breakout Entry
Traders enter when price breaks a major level:
Resistance breakout → Buy
Support breakout → Sell
Strong breakout confirmation includes:
Big-bodied candle
Volume increase
Retest of level
(B) Pullback Entry
This is the most common entry for professional traders.
Steps:
Identify trend
Wait for correction
Look for price action signal
Enter with trend continuation
Pullback entries offer high reward-to-risk ratios.
(C) Reversal Entry
Used at key S/R zones.
Signals include:
Pin Bar at resistance
Engulfing candle at support
Divergence between price and momentum
Reversal entries require patience and confirmation.
5. Price Action Exit Strategies
(A) Fixed Target Exit
Based on S/R levels, Fibonacci targets, or ATR projections.
(B) Trailing Stop Exit
Use structure-based trailing:
Swing high/lows
Trendline breaks
Moving average (optional)
(C) Partial Profit Booking
Sell half at first target, trail rest.
This reduces risk and increases consistency.
6. Risk Management in Price Action Trading
Risk management is inseparable from price action.
Key principles:
Risk 1–2% per trade
Use stop loss below/above structure
Never chase trades
Avoid overtrading
Trade high-probability zones
Maintain minimum 1:2 or 1:3 RR
Price action is powerful, but without risk control, even the best trades can fail.
7. Psychological Aspect of Price Action
Price action exposes traders to raw market volatility, so emotional discipline is essential.
Key psychological principles:
Stick to your plan
Don’t interpret noise as signals
Trust structure and patterns
Accept losing trades
Stay unbiased—trade what the chart shows
Avoid revenge trades
Markets reward disciplined behavior more than aggressive behavior.
8. Major Price Action Strategies
(A) Trend Following Strategy
Identify trend
Buy pullbacks in uptrend
Sell pullbacks in downtrend
Confirm with candle patterns
This is the most reliable and beginner-friendly approach.
(B) Reversal Trading Strategy
Look for reversal patterns at major S/R levels:
Pin bar reversal
Double top/bottom
Head and shoulders
Engulfing reversal
Reversal trading offers high RR but requires experience.
(C) Breakout and Retest Strategy
One of the cleanest setups:
Price breaks a strong level
Comes back to retest
Forms a bullish/bearish signal
Enter towards breakout direction
Institutional traders commonly use this.
(D) Range Trading Strategy
In a sideways market:
Buy support
Sell resistance
Wait for breakout to stop range trading
Ranges are predictable and profitable for price action traders.
9. Advantages of Price Action Trading
Works on all markets and timeframes
No dependency on indicators
Quick decision-making
Clears chart from clutter
Aligns with institutional trading
Easy to learn but deep to master
Works even in low-volume markets
10. Limitations of Price Action Trading
Requires screen time and practice
Highly subjective
Can generate false signals in choppy markets
Emotional discipline needed
News events can disrupt structure
Price action is powerful, but traders must combine it with risk management and emotional control.
Conclusion
Price Action Trading is a complete trading ecosystem—focused on understanding how price behaves, how market participants react, and how to trade based on pure market psychology. It eliminates reliance on lagging indicators and teaches traders to interpret structure, trends, reversals, breakouts, and raw candlestick signals. With practice, traders using price action gain clarity, develop confidence, and improve consistency across all market conditions.

A Comprehensive Guide to Managing Trading Risk1. Understanding Trading Risk
Trading risk refers to the possibility of losing part or all of the capital invested due to market movements, volatility, or other unforeseen events. Risk can be classified into different types:
Market Risk: The risk that market prices will move unfavorably.
Liquidity Risk: The inability to buy or sell an asset without causing significant price changes.
Credit Risk: The risk that a counterparty may fail to fulfill contractual obligations.
Operational Risk: Losses due to system failures, errors, or human mistakes.
Psychological Risk: Emotional decision-making leading to impulsive or irrational trades.
Understanding the type of risk you are exposed to is the first step toward controlling it.
2. Capital Allocation and Position Sizing
One of the most fundamental principles of risk management is controlling the amount of capital allocated to each trade. Traders often use position sizing to ensure that no single trade can significantly damage their portfolio.
Rule of Thumb: Risk no more than 1–2% of your total trading capital on a single trade. For example, if your capital is ₹1,00,000, your maximum loss per trade should be ₹1,000–₹2,000.
Position Size Formula: Position Size = (Capital at Risk) ÷ (Entry Price – Stop Loss Price). This ensures the risk is limited according to your strategy.
Proper capital allocation protects traders from catastrophic losses and allows them to stay in the game even during losing streaks.
3. Using Stop Losses
Stop-loss orders are essential tools for limiting losses. They automatically close a trade when the market moves against your position by a predetermined amount.
Fixed Stop Loss: A predetermined price level at which the trade will be closed.
Trailing Stop Loss: A dynamic stop loss that moves with favorable price movement, locking in profits while limiting downside.
Volatility-Based Stop Loss: Adjusts stop loss based on market volatility, often using indicators like Average True Range (ATR).
Stop losses remove the emotional component from trading decisions and prevent impulsive reactions during market swings.
4. Diversification
Diversification reduces the overall risk of a trading portfolio by spreading capital across multiple assets, sectors, or markets.
Asset Diversification: Trade in multiple asset classes like stocks, commodities, and forex.
Sector Diversification: Invest across different sectors (technology, healthcare, energy) to mitigate sector-specific risks.
Strategy Diversification: Use multiple trading strategies (trend-following, mean-reversion, scalping) to avoid over-reliance on a single approach.
Diversification reduces the probability that a single adverse market event will wipe out your capital.
5. Risk-Reward Ratio
Every trade carries both risk and potential reward. Maintaining a favorable risk-reward ratio is crucial for long-term profitability.
Definition: Risk-Reward Ratio = Potential Profit ÷ Potential Loss.
Recommended Ratio: Many professional traders aim for a minimum 1:2 ratio, meaning potential profit is at least twice the potential loss.
Even if a trader wins only 50% of trades, a favorable risk-reward ratio ensures profitability over time.
6. Use of Leverage with Caution
Leverage amplifies both gains and losses. While it allows traders to control large positions with limited capital, it can also lead to rapid account depletion if mismanaged.
Leverage Limits: Only use leverage that you can comfortably manage. Beginners should avoid high leverage entirely.
Margin Requirements: Always monitor margin requirements and avoid over-leveraging positions.
Responsible use of leverage is a critical aspect of risk management, especially in highly volatile markets like forex or derivatives.
7. Hedging Strategies
Hedging is a method of reducing exposure to adverse price movements by taking offsetting positions in correlated assets.
Options and Futures: Traders can hedge stock positions using put options or futures contracts.
Currency Hedging: Forex traders may hedge currency exposure to protect against exchange rate fluctuations.
Portfolio Hedging: Using ETFs or inverse instruments to mitigate overall portfolio risk.
While hedging can reduce risk, it also comes at a cost, so it should be applied judiciously.
8. Monitoring Market Conditions
Risk is not static—it fluctuates with market conditions. Traders should continuously monitor macroeconomic events, market news, and technical indicators to adjust their risk exposure.
Volatility Analysis: Use indicators like Bollinger Bands or ATR to measure market volatility.
Economic Events: Keep track of interest rate decisions, inflation data, earnings announcements, and geopolitical events.
Technical Signals: Use trendlines, moving averages, and support/resistance levels to identify potential risk zones.
Being proactive rather than reactive helps in managing risks more effectively.
9. Psychological Risk Management
Emotions can be a trader’s worst enemy. Fear and greed often lead to impulsive decisions that magnify risk.
Trading Plan: Have a detailed plan that includes entry, exit, and risk limits.
Discipline: Stick to your trading plan even during drawdowns.
Avoid Overtrading: Taking too many trades increases exposure to unnecessary risk.
Record Keeping: Maintain a trading journal to analyze mistakes and improve strategies.
Mental resilience and self-discipline are as important as technical risk controls.
10. Continuous Learning and Adaptation
Markets evolve, and strategies that worked in the past may not be effective in the future. Risk management requires constant learning and adaptation.
Backtesting: Test trading strategies on historical data to evaluate risk.
Simulation Trading: Practice with demo accounts to refine risk management without financial loss.
Stay Updated: Read financial news, follow market analysts, and keep learning about new risk management tools.
Continuous improvement ensures that traders adapt to changing market dynamics while protecting capital.
11. Emergency Risk Controls
Even with careful planning, unexpected events like market crashes, flash crashes, or broker failures can occur. Traders should implement emergency risk controls.
Circuit Breakers: Use automatic exit mechanisms during extreme volatility.
Diversified Brokers: Avoid keeping all funds with a single broker.
Insurance Products: Consider financial instruments or policies that protect against catastrophic losses.
Having contingency plans safeguards against black swan events and extreme losses.
Conclusion
Managing trading risk is not about eliminating it—it is about understanding, controlling, and mitigating it. Effective risk management allows traders to survive losing streaks, capitalize on opportunities, and maintain consistent growth. Key principles include prudent capital allocation, stop-loss usage, diversification, favorable risk-reward ratios, disciplined leverage, hedging, and psychological resilience. Continuous monitoring, adaptation, and emergency preparedness further enhance risk control.
Ultimately, the trader who masters risk management doesn’t merely seek profit but protects the most valuable asset: their capital. Profit is fleeting, but capital preservation ensures a seat at the market table for the long term. By integrating these principles into daily trading routines, traders can navigate the uncertain waters of financial markets with confidence and discipline.
Part 10 Trade Like Institutions Option Trading in India (NSE)
In India, the National Stock Exchange (NSE) is the largest options market globally in terms of contracts traded.
Features of Indian Options:
Cash-settled for indices (NIFTY, FINNIFTY, BANKNIFTY)
Stock options are physically settled
Weekly expiries every Thursday (for index)
Monthly expiries for stocks
Index options are preferred because they:
Have high liquidity
Offer tight spreads
Enable sophisticated strategies

Part 8 Trading Master Class With Experts Role of Volume & Open Interest
These indicators help understand market participation:
Volume shows activity
Open Interest shows fresh positions
Rising OI + rising price → strong trend
Rising OI + falling price → trend strength in opposite direction
Falling OI → position unwinding
Options with high OI often influence intraday support/resistance.

Smart Money Secrets1. The Psychology Behind Smart Money Movement
Smart money rarely buys at the top or sells at the bottom. Instead, institutions accumulate positions slowly during periods of low volatility and distribute them quietly near tops. The retail crowd does the opposite—buy at tops out of fear of missing out (FOMO) and sell at bottoms due to panic.
Institutions exploit this behavior by:
Creating liquidity traps
Triggering stop-loss hunts
Pushing the price into zones where retail traders enter in the wrong direction
Fading false breakouts
Their goal is simple: buy from emotional sellers, and sell to emotional buyers.
Understanding this psychology is crucial because following smart money usually leads to high-probability trades, while following retail noise often leads to losses.
2. Liquidity: The Fuel of Smart Money
A core smart money secret is that price moves where liquidity exists, not where emotions point. Liquidity refers to regions where many orders are present—like stop losses, pending orders, and institutional blocks.
Smart money actively targets:
Stop loss clusters
Liquidity pools above swing highs
Liquidity pools below swing lows
Areas of imbalance and inefficiency
Example:
When many retail traders place stop losses below a support level, institutions may deliberately push the price below that level to trigger those stops, collect liquidity, and then reverse the price upward.
This phenomenon is called a liquidity grab.
3. Market Structure and Smart Money
Institutions trade based on market structure, not indicators. They analyze:
Higher highs and higher lows
Break of structure (BOS)
Change of character (CHoCH)
Fair value gaps (FVG)
Order blocks (OB)
When smart money wants to reverse a trend, they leave signals through these structural changes. Traders who understand the smart money model (SMM) can identify early trend reversals long before retail indicators show them.
4. Order Blocks – Smart Money Entry Zones
An order block represents a candle or zone where institutions placed significant buy or sell orders. After these zones are formed, price often returns to them to “mitigate” or rebalance institutional positions.
Types of order blocks:
Bullish Order Block: Last down candle before an upward expansion
Bearish Order Block: Last up candle before a downward expansion
When price returns to an order block:
Institutions re-enter or add to positions
High-probability trades form
Retail traders are often on the wrong side
Order blocks are one of the strongest smart money signals for entries.
5. Fair Value Gaps – Imbalances in Price
Smart money often causes rapid price moves that leave gaps between candles. These are called Fair Value Gaps (FVGs) or imbalance zones.
Why they form:
Large institutions place massive orders
Market doesn’t have enough liquidity to fill all levels
Price “jumps” leaving an imbalance
Smart money expects price to return to fill these gaps because they represent inefficiencies in the market. Traders use these zones for entry confirmations and profit targets.
6. Stop Hunts and Liquidity Sweeps
One of the biggest secrets in smart money behavior is stop hunting—a deliberate attempt to trigger retail stop losses.
Reasons for stop hunts:
To collect liquidity for institutional entries
To trap retail traders in the wrong direction
To create volatility before the actual move
Common patterns:
Price dips below a major support and shoots up
Price wicks above a resistance and falls sharply
Long wick candles near order blocks
Retail traders often perceive these as breakouts, but smart money uses them for liquidity collection.
7. Inducement – The Trap Before the Real Move
Inducement is a clever technique used by smart money to lure traders into false setups.
Example:
Price approaches a resistance level multiple times, making retail traders think a breakout is coming. Just before the real move happens:
Price sweeps the liquidity above resistance
Then reverses back into smart money’s direction
Inducement helps institutions create liquidity for their own trades.
8. Volume as a Smart Money Indicator
While price can be manipulated, volume rarely lies. Smart money activity is marked by:
High-volume candles at turning points
Volume spikes during liquidity sweeps
Decreasing volume during pullbacks (institutional accumulation)
Volume Profile and VWAP are tools many traders use to detect institutional footprints.
9. Smart Money and Algorithmic Trading
Modern smart money behavior is driven by algorithms operated by major institutions. These algorithms:
Scan liquidity zones
Execute orders at optimal prices
Analyze price inefficiencies
Prevent slippage
Algorithms follow rules based on order flow, not indicators. This is why price often moves in patterns consistent with smart money concepts, such as BOS, CHoCH, FVGs, and OB mitigations.
10. How Retail Traders Can Use Smart Money Secrets
To trade like smart money, retail traders should:
1. Follow Liquidity, Not Emotions
Identify where liquidity rests:
Equal highs
Equal lows
Swing points
Consolidation zones
These are areas institutions target.
2. Identify BOS and CHoCH
Break of structure reveals trend continuation.
Change of character signals trend reversal.
3. Use Order Blocks and FVGs for Entries
These are high-probability institutional zones.
4. Avoid Trading Breakouts Blindly
Most breakouts are manipulations. Wait for liquidity sweeps.
5. Understand Timing
Smart money moves often occur during:
London Session Open
New York Session Open
Major economic news
Avoid trading in the dead zones between sessions.
6. Stop Using Too Many Indicators
Indicators lag behind price. Smart money trades price action and liquidity.
11. Why Smart Money Secrets Matter
Following smart money helps traders:
Avoid bull and bear traps
Enter trades at institutional pricing
Improve risk-reward ratios
Understand why price moves
Gain confidence through structure-based trading
Instead of being manipulated by market makers, traders learn to trade with them.
Conclusion
Smart money secrets revolve around understanding how institutions operate—where they enter, where they exit, and how they manipulate liquidity. By analyzing market structure, order blocks, liquidity zones, BOS/CHoCH signals, and fair value gaps, traders gain deep insight into true market behavior. While retail traders often trade based on indicators and emotions, smart money trades based on liquidity and structure. Learning these principles allows any trader to align with institutional order flow, trade high-probability setups, and avoid common retail pitfalls.
Smart Loss Management Guide in the Trading Market1. Why Loss Management Is More Important Than Profit-Making
Most new traders focus on making money and ignore risk control. But experienced traders know that your downside determines your survival. If capital is destroyed early, even a good trading system cannot help. Here’s why loss management matters:
Capital Preservation: If you lose 50% of your account, you need a 100% gain to recover. Avoiding deep drawdowns is essential.
Consistency Over Luck: A trader with average profits but disciplined risk control will outperform an aggressive trader without rules.
Uncertainty of Markets: Even the best strategies have losing streaks. Smart loss management keeps you disciplined during uncertain phases.
Simply put, losing small and winning medium-to-large is the essence of profitable trading.
2. Key Principles of Smart Loss Management
2.1 Risk Per Trade Rule
Professional traders follow a simple rule:
Risk only 1–2% of trading capital per trade.
This ensures that even after 10 losing trades in a row, your capital stays strong. A 1% rule means:
If your capital = ₹1,00,000
Max loss per trade = ₹1,000
This protects you from emotional decisions and ensures controlled drawdowns.
2.2 Position Sizing
Position size determines how much quantity you buy or sell. It must be based on:
Stop-loss distance
Capital
Risk per trade percentage
Formula:
Position Size = Risk Amount / Stop-Loss Distance
Example:
Capital = ₹1,00,000
Risk per trade = 1% = ₹1,000
Stop-loss = 5 points
Position size = 1000 / 5 = 200 quantity
This keeps your risk uniform across trades.
2.3 Placing Effective Stop-Loss Orders
Not all stop-losses are equal. Smart traders use:
Technical stop-loss: based on chart levels (support, resistance, swing high/low).
Volatility-based stop-loss: dynamic stops using ATR (Average True Range).
Time-based stop-loss: exit if trade doesn’t work within a fixed time window.
Avoid placing stops too close, which results in premature exits.
2.4 Avoiding Averaging Down
Many traders double their position when price goes against them thinking it will “bounce back”.
This is dangerous.
Averaging down increases exposure when your analysis is already wrong. Professional traders do the opposite—they scale out or exit.
2.5 Maintain Reward-to-Risk Ratio
Every trade must have a minimum Risk-to-Reward (RR) ratio of 1:2 or 1:3.
Example:
If risk = ₹1,000
Target should be ₹2,000 or ₹3,000
This ensures that even with a 40% win rate, you remain profitable.
3. Psychological Pillars of Smart Loss Management
Market losses are emotionally painful. Most poor decisions come from emotions like fear, hope, greed, and frustration. Smart traders master the psychology of loss.
3.1 Accept That Losses Are Normal
Every trader—beginner or expert—has losing trades. Accepting losses helps:
Reduce revenge trading
Maintain discipline
Focus on process, not outcome
3.2 Don’t Take Losses Personally
A losing trade is not a failure of your personality. It is simply part of the game. Traders who attach ego to trades often avoid closing losing positions, leading to bigger losses.
3.3 Control Overtrading
After a loss, many traders try to recover immediately. This emotional urge leads to irrational decisions. Smart loss management requires:
Stop trading after big loss
Follow pre-defined trade limits
Reset emotionally before next trade
3.4 Develop Emotional Discipline
The best loss management tool is self-control. This includes:
Sticking to stop-loss
Avoiding impulsive orders
Following a checklist before entering trades
Discipline converts a strategy into consistent profits.
4. Techniques for Smart Loss Management
4.1 Use Trailing Stop-Loss
Trailing stops help protect profits as the trade moves in your favor. For example:
If trade goes 20 points up, move stop-loss to breakeven
If trade goes 40 points up, trail stop to +20
This locks in gains and avoids giving back profits.
4.2 Hedging Positions
Advanced traders use hedging techniques like:
Options hedging (buying puts to protect long positions)
Futures hedging
Ratio spreads
Hedging reduces the impact of sudden volatility or news events.
4.3 Diversify Trades
Avoid putting all your capital into one trade or one sector. Diversification ensures:
Reduced exposure
Stable overall performance
Lower emotional pressure
But don't over-diversify; focus on 4–8 quality trades.
4.4 Use a Daily Loss Limit
Set a maximum daily loss that stops you from trading further.
Example:
Daily Max Loss = 3% of capital
If you hit that limit, stop trading for the day.
This prevents emotional breakdowns and unnecessary revenge trades.
4.5 Create a Trading Journal
Record:
Entry and exit
Stop-loss
Reason for trade
Emotional state
Reviewing your journal reveals patterns, mistakes, and ways to refine your strategy.
5. Common Mistakes to Avoid
5.1 Moving Stop-Loss Further Away
Traders sometimes shift stop-loss thinking the market will reverse. This is a mistake. A stop-loss must be respected at all times.
5.2 Trading Without a Defined Exit
A trade without a clear exit strategy becomes a gamble. Smart traders pre-plan both stop-loss and target.
5.3 Ignoring Market Conditions
A strategy that works in trending markets may fail in sideways markets. Loss management includes reducing position size during choppy or news-heavy environments.
5.4 Emotions-Based Position Sizing
Increasing lot size after a win or reducing after a loss emotionally disturbs risk management. Position size must always be formula-based.
6. Building Your Smart Loss Management System
Step 1: Define Your Risk Rules
Risk per trade, daily loss limit, maximum open trades.
Step 2: Create Position Sizing Formula
Based on stop-loss distance and capital.
Step 3: Pre-Plan Stop-Loss Levels
Technical, volatility-based, or time-based.
Step 4: Maintain a Journal
Track mistakes, patterns, and improvements.
Step 5: Maintain Emotional Discipline
Follow rules no matter what the market does.
7. Conclusion
Smart loss management is the foundation of profitable trading. Markets reward discipline, not emotion. By controlling risk, using effective stop-loss techniques, maintaining psychological discipline, and applying structured methods, traders protect their capital and grow consistently over time. Every successful trader understands that losses are unavoidable, but big losses are preventable. With a strong loss management system, you turn volatility from a threat into an opportunity and ensure you remain a long-term player in financial markets.
Advanced Candlestick Pattern AnalysisTypes of Candlestick Patterns
Candlestick patterns are broadly categorized into:
Single-candle patterns
Double-candle patterns
Triple-candle patterns
Complex multi-candle structures

Part 11 Trading Master Class With Experts What Are Options?
Options are financial contracts that give you the right, but not the obligation, to buy or sell an underlying asset (usually stocks, indices, or commodities) at a fixed price within a specific period.
There are two types of options:
Call Option – Gives the buyer the right to buy the asset at a pre-decided price (strike price).
Put Option – Gives the buyer the right to sell the asset at a pre-decided price.
Each option contract has three key components:
Strike Price – The fixed price at which you may buy or sell.
Premium – The price you pay to purchase the option.
Expiry Date – The date on which the option ceases to exist.
In India, options are cash-settled and expire weekly (for indices) or monthly (for stocks).

Intraday Trading vs. Swing Trading1. What Is Intraday Trading?
Intraday trading—also known as day trading—refers to buying and selling financial instruments within the same trading day. All positions are squared off before the market closes. The primary objective is to capitalize on small price movements during the day.
Key Characteristics of Intraday Trading
Time Horizon: A few minutes to a few hours.
Positions: Must close by the end of the session.
Frequency of Trades: High—sometimes dozens of trades per day.
Leverage: Often high, as brokers offer intraday margin.
Market Focus: Stock volatility, liquidity, volume spikes, and news events.
Tools: Charts with 1–15 minute timeframes, technical indicators like VWAP, RSI, MACD, moving averages, and candlestick patterns.
How Intraday Traders Operate
Day traders look for rapid moves caused by:
Opening volatility
Breakouts and breakdowns
Intraday trend reversals
News announcements or corporate actions
Market sentiment shifts
They aim for modest but repeated profits. For example, capturing 0.5%–1% price movements several times a day.
Pros of Intraday Trading
No overnight risk: Prices cannot gap up or down because positions close daily.
Quick profit potential: Traders can compound small gains.
High leverage availability: Amplifies profits (but also losses).
Opportunities daily: Markets always offer short-term moves.
Cons of Intraday Trading
High stress and emotional pressure.
Requires constant screen time (full-time commitment).
High transaction costs due to frequent trades.
Losses can accumulate quickly because of leverage.
It is suitable for traders who enjoy fast decision-making, market analysis, and disciplined risk management.
2. What Is Swing Trading?
Swing trading refers to holding positions for multiple days to a few weeks to capture medium-term price movements. It focuses on identifying “swings” or waves in the market trend.
Key Characteristics of Swing Trading
Time Horizon: 2–20 days typically.
Positions: Held overnight and sometimes over weekends.
Trade Frequency: Lower—maybe 2–10 trades per week.
Tools: 1-day, 4-hour, or hourly charts; indicators like moving averages, Fibonacci levels, RSI, stochastic oscillators, and chart patterns.
Market Focus: Broader market trend, news cycles, earnings impact.
How Swing Traders Operate
Swing traders identify the primary trend—uptrend, downtrend, or consolidation—and position themselves accordingly. They capture portions of bigger moves, such as:
3–10% swing in stocks
Trend continuation patterns like flags or triangles
Support/resistance rebounds
Moving average crossovers
Swing trading balances technical and fundamental analysis, especially when holding positions through news events or earnings announcements.
Pros of Swing Trading
Less screen time: Can be done alongside a full-time job.
Larger profit targets: 3–10% moves vs. small intraday scalps.
Lower stress: Fewer decisions per day.
Reduced transaction costs: Fewer trades → lower brokerage.
Cons of Swing Trading
Overnight risk: Gaps may lead to unexpected losses.
Requires patience and emotional control.
Positions may move slowly compared to intraday trades.
Wider stop losses needed due to longer timeframe volatility.
Swing trading suits individuals who prefer thoughtful, strategic decision-making rather than rapid reactions.
3. Key Differences: Intraday vs. Swing Trading
a. Time Commitment
Intraday: Requires monitoring markets from opening to closing.
Swing: Check markets occasionally—morning, evening, or alerts.
b. Risk Exposure
Intraday: No overnight risk, but higher exposure to rapid intraday volatility.
Swing: Overnight risk exists but overall volatility is smoother.
c. Trade Duration
Intraday: Seconds to hours.
Swing: Days to weeks.
d. Profit Potential
Intraday: Smaller gains per trade, high frequency.
Swing: Larger gains per trade, lower frequency.
e. Required Skills
Intraday: Quick reflexes, strong technical skills, mental stamina.
Swing: Trend analysis, patience, broader market understanding.
f. Leverage Use
Intraday: High leverage available; can increase returns but also risks.
Swing: Lower leverage, more stable risk control.
4. Psychology Behind the Two Styles
Intraday Requires:
Rapid decision making
Ability to stay calm under pressure
Strict discipline
Risk management on every trade
Emotional stability after losses
Because intraday trading involves many quick trades, emotional fatigue is common.
Swing Trading Requires:
Patience to let trades mature
Ability to hold through minor fluctuations
Avoiding fear from overnight gaps
Trust in analysis
Swing traders face psychological challenges when price moves against them temporarily.
5. Which One Is More Suitable for You?
Choose Intraday Trading If:
You can devote full time to monitoring markets.
You enjoy fast-paced trading.
You have high risk tolerance.
You can manage stress and stick to tight stop losses.
You want consistent, daily trading opportunities.
Choose Swing Trading If:
You want to trade part-time.
You prefer larger, less frequent trades.
You don't want constant screen time.
You are comfortable holding positions overnight.
You have a long-term view of market trends.
6. Which One is More Profitable?
Profitability depends on:
Strategy
Discipline
Risk management
Capital size
Consistency
Intraday can give fast profits but also fast losses. Swing trading offers more stability and can provide strong returns with fewer trades.
Many experienced traders prefer swing trading because it reduces emotional strain and trading costs while still delivering meaningful gains. But others achieve high success with intraday strategies by staying disciplined and using strict risk controls.
Conclusion
Intraday trading and swing trading represent two different philosophies of participating in financial markets. Intraday trading focuses on short bursts of volatility within a single trading session, requiring constant attention, sharp reflexes, and tight risk control. Swing trading, on the other hand, seeks to capture multi-day price swings, offering a more relaxed pace and potentially larger profits per trade but with overnight risks.
The better approach depends entirely on your personal style, time availability, risk appetite, and psychological comfort. By understanding their differences, traders can choose the method that fits their goals—and apply the right discipline, planning, and strategy to succeed.
Investing in Shares in the Indian Market1. Understanding the Indian Stock Market
India’s stock market is primarily operated through two major exchanges:
(a) National Stock Exchange (NSE)
The NSE is the largest exchange in terms of volume. It introduced electronic trading in India and is home to major indices such as Nifty 50, Nifty Bank, Nifty IT, and others.
(b) Bombay Stock Exchange (BSE)
One of the oldest exchanges in Asia, the BSE hosts indices like the Sensex, BSE Midcap, and BSE Smallcap.
Both exchanges are regulated by the Securities and Exchange Board of India (SEBI), which ensures transparency, investor protection, and fair trading practices.
2. What Are Shares?
Shares represent ownership in a company. When you invest in shares, you:
Become a part-owner of the business
Benefit from the company’s growth through capital appreciation
Receive dividends, if declared
Get voting rights in some cases
Share prices fluctuate due to demand and supply, economic conditions, company performance, global news, and market sentiment.
3. How to Start Investing in Shares in India
(a) Open a Demat Account
A Demat (Dematerialized) account stores your shares electronically. It is essential for buying and selling equities in India.
Major brokers include:
Zerodha
Groww
Angel One
Upstox
ICICI Direct
HDFC Securities
(b) Open a Trading Account
Connected to your Demat account, this is used to place buy/sell orders on the exchange.
(c) Link a Bank Account
Funds are transferred from your bank to the trading account to execute transactions.
(d) Complete KYC
AADHAR, PAN, mobile number verification, and e-signature are mandatory parts of the KYC process.
Once these steps are completed, you can begin investing through your broker’s app or platform.
4. Ways to Invest in the Indian Stock Market
(a) Direct Equity (Buying Individual Stocks)
This means selecting individual companies for long-term investment based on research.
(b) Mutual Funds / Equity SIPs
Investors who prefer passive management often choose mutual funds such as:
Large-cap funds
Mid-cap funds
Small-cap funds
Index funds
Thematic funds
SIP (Systematic Investment Plan) allows regular monthly investments.
(c) ETFs (Exchange-Traded Funds)
ETFs track an index like Nifty 50 and trade like stocks. They offer low costs and diversification.
(d) IPOs (Initial Public Offerings)
Investors can apply for shares of companies when they list for the first time.
5. Types of Shares in India
By Market Capitalization
Large-cap: Stable, established companies (Reliance, TCS, HDFC Bank)
Mid-cap: Growing companies with higher potential
Small-cap: High-risk, high-reward companies
By Sector
Banking and Finance
IT and Technology
Pharma
FMCG
Metal and Energy
Auto
Infrastructure
Telecom
Each sector performs differently depending on macroeconomic cycles.
6. Why Invest in Shares?
(a) Wealth Creation
Over long periods, equities offer the highest returns compared to gold, real estate, or fixed deposits. For example, Nifty 50 has delivered around 14–15% annualized returns over 20 years.
(b) Beat Inflation
Inflation reduces money’s purchasing power. Equity returns typically outpace inflation, helping preserve and grow wealth.
(c) Dividends and Bonuses
Investors may receive dividend income, bonus shares, and stock splits.
(d) Ownership and Transparency
India’s markets are well-regulated, ensuring transparent transactions and investor protection.
7. Risks of Investing in Shares
Stock investment is rewarding but comes with risks:
(a) Market Risk
Share prices move up and down due to market sentiment, global cues, and economic changes.
(b) Company-Specific Risk
Poor management, low earnings, fraud, or competition can affect a company's share price.
(c) Liquidity Risk
Some shares, especially small caps, may have fewer buyers, making it hard to sell quickly.
(d) Economic and Geopolitical Risk
Events like elections, wars, oil price fluctuations, and global recession impact Indian markets.
Managing risk through diversification and research is essential.
8. Fundamental vs. Technical Analysis
Investors use two main methods to pick stocks:
(a) Fundamental Analysis
Focuses on a company’s core financial health. This involves studying:
Revenue and earnings
Profit margins
Debt levels
Cash flow
Competitive advantage
Management quality
The goal is to buy companies undervalued relative to their intrinsic value.
(b) Technical Analysis
Helpful for short-term trading. It focuses on:
Price charts
Chart patterns
Support and resistance
Indicators like RSI, MACD, moving averages
Traders use technical analysis to time entry and exit points.
9. Long-Term vs. Short-Term Investing
Long-Term Investing (Wealth Building)
Investing with a 5–10+ year horizon helps benefit from compound returns. Historically, holding quality stocks over long periods reduces risk and maximizes growth.
Short-Term Trading
Includes intraday, swing trading, options trading, and futures. While it offers quick profits, it is high risk and requires discipline and advanced market knowledge.
10. Taxes on Shares in India
Short-Term Capital Gains (STCG)
15% tax if shares are sold within 1 year.
Long-Term Capital Gains (LTCG)
10% tax on gains above ₹1 lakh for shares held beyond 1 year.
Dividends
Taxed at the investor’s slab rate.
11. Key Tips for Stock Market Investors
✔ Invest regularly (SIP method)
✔ Diversify across sectors and market caps
✔ Focus on fundamentally strong companies
✔ Avoid panic selling during corrections
✔ Do not follow rumors or tips blindly
✔ Keep a long-term perspective
✔ Review your portfolio annually
✔ Understand risk appetite before investing
12. Common Mistakes to Avoid
Investing without research
Over-trading for quick profits
Lack of diversification
Emotional decisions
Ignoring risk management
Putting all savings into stocks
Conclusion
Investing in shares in the Indian market offers a powerful opportunity to build long-term wealth. With a robust regulatory framework, digital trading platforms, and a rapidly growing economy, India provides a fertile environment for equity investment. While market fluctuations and risks exist, informed decision-making, disciplined investing, and a long-term approach can significantly enhance the probability of success. Whether you are a beginner or an experienced investor, the key lies in continuous learning, patience, and choosing the right companies aligned with your financial goals.
PCR Trading Strategies The Role of Premium
The premium is the price you pay to buy the option.
Premium is influenced by:
Underlying price
Strike price
Time to expiry (more time = higher premium)
Volatility (higher volatility = higher premium)
Interest rates
Market demand
The buyer’s maximum loss is limited to the premium paid, but the seller’s risk can be much higher—sometimes unlimited.

Part 9 Trading Master Class With Experts What Are Options?
Options are financial contracts that give a trader the right, but not the obligation, to buy or sell an asset at a fixed price (called the strike price) before or on a specific date (called the expiry).
The underlying asset could be a stock, index, commodity, or currency.
Because options provide choice (whether to exercise or not), they are called “options.”
There are two main types:
Call Option – gives you the right to buy at a fixed price.
Put Option – gives you the right to sell at a fixed price.
In both cases, you pay a premium (price of the option). This is the maximum loss for option buyers.

Part 2 Understanding the Master Candle ConceptWhat Are Options?
Options are derivative instruments, meaning their value is derived from an underlying asset. The underlying asset can be a stock, index, commodity, or currency.
There are two types of options:
Call Option:
Gives the buyer the right to buy the underlying asset at a specific price (called the strike price) before the expiry date.
Put Option:
Gives the buyer the right to sell the underlying asset at a specific price before the expiry date.
For example:
If you buy a NIFTY 50 call option at a strike price of 22,000, you are betting that the NIFTY will rise above 22,000 before expiry. If it does, your call option increases in value.
If you buy a NIFTY put option at 22,000, you’re betting the index will fall below 22,000 — and the value of your put option will rise as the index drops.

Part 7 Trading Master Class Basics of Options in India
An option is a derivative contract that gives the holder the right but not the obligation to buy or sell an underlying asset (like Nifty, Bank Nifty, or a stock) at a predetermined price (called the strike price) before or on a specified date (expiry).
Call Option (CE): Gives the right to buy.
Put Option (PE): Gives the right to sell.
Traders use options for:
Hedging (protecting portfolio losses)
Speculation (betting on price movements)
Income generation (using premium decay)
In India, options are traded on exchanges like NSE and BSE, primarily on indices (Nifty, Bank Nifty, FinNifty) and individual stocks.

Part 1 Ride The Big Moves How Option Trading Works
Option trading involves four basic positions:
Buy Call (Long Call): The trader expects the underlying asset’s price to rise.
Sell Call (Short Call): The trader expects the price to stay the same or fall.
Buy Put (Long Put): The trader expects the underlying asset’s price to fall.
Sell Put (Short Put): The trader expects the price to stay the same or rise.
For example, if a trader buys a call option on a stock with a strike price of ₹100 and pays a premium of ₹5, they have the right to buy the stock at ₹100 even if it rises to ₹120. In this case, their profit per share would be ₹15 (₹120 - ₹100 - ₹5). However, if the stock remains below ₹100, they would not exercise the option and would lose only the premium of ₹5.

Why Market Rotations Matter for Every Trader and Investor1. What Is Market Rotation?
Market rotation refers to the flow of money between different sectors, asset classes, or investment themes over time. It happens as investors shift their capital based on changing economic conditions, interest rates, inflation expectations, or risk appetite.
For example, during periods of economic recovery, investors often move money into cyclical sectors like banking, manufacturing, and real estate. In contrast, when the economy slows, funds often rotate into defensive sectors like healthcare, consumer staples, or utilities that provide stable earnings regardless of the cycle.
At its core, market rotation is like a dance — money never leaves the market entirely; it simply moves to where it expects the best performance next.
2. The Economic Cycle and Its Impact
Market rotations are deeply connected to the economic cycle, which includes four major phases: expansion, peak, contraction, and recovery.
Expansion: When growth is strong and confidence is high, investors prefer cyclical stocks like autos, financials, and industrials.
Peak: As the economy overheats, inflation rises, and interest rates climb, investors start trimming exposure to growth-heavy stocks.
Contraction: During slowdowns or recessions, investors seek safety in defensive sectors such as utilities, FMCG, and healthcare.
Recovery: When conditions improve again, capital flows back into riskier assets, including technology and small caps.
Recognizing where we are in the economic cycle helps traders and investors anticipate which sectors will lead and which will lag, improving portfolio allocation and timing.
3. Sector Rotation – The Heart of Market Dynamics
Sector rotation is one of the most visible forms of market rotation. It reflects how investors reallocate funds among various industries to capture relative strength.
For example:
When interest rates rise, banks and financials tend to benefit from higher lending margins.
When commodity prices surge, energy and metal stocks often outperform.
When technology innovation dominates, IT and digital sectors lead the charge.
Smart investors track sector rotation through indicators like the Relative Strength Index (RSI), moving averages, or relative performance charts to identify which areas of the market are gaining momentum.
Understanding sector rotation allows traders to be “in the right place at the right time,” maximizing returns while minimizing exposure to lagging industries.
4. Style Rotation – Growth vs. Value
Market rotations don’t only happen between sectors; they also occur between investment styles — primarily growth and value.
Growth stocks (like tech companies) thrive when the economy is expanding and interest rates are low.
Value stocks (like traditional industrials or financials) perform better when inflation and interest rates rise.
During the 2010s, growth stocks led global markets as central banks kept interest rates near zero. However, as inflation spiked post-2020, value sectors like energy and banking began to outperform.
Recognizing when the market is shifting from growth to value (or vice versa) helps traders realign portfolios early and avoid being caught on the wrong side of market trends.
5. Asset Rotation – Beyond Stocks
Market rotation also extends across asset classes. Investors move funds between equities, bonds, commodities, and even cash depending on macroeconomic trends.
For example:
When inflation rises, money often flows out of bonds (which lose value as yields rise) and into commodities like gold or oil.
During uncertainty, capital moves out of equities and into safe-haven assets like the U.S. dollar or government bonds.
When global liquidity improves, funds rotate back into risk assets like emerging markets and small caps.
For traders, tracking these inter-asset flows provides early signals of broader market shifts and risk sentiment changes.
6. How Traders Can Profit from Market Rotations
For traders, identifying early signs of sector or asset rotation can open up opportunities for high-probability trades.
Use volume and price action to detect institutional money flow. Rising volume in a sector ETF or leading stock often indicates the start of a rotation.
Track leadership changes: If defensive sectors start outperforming, it may signal risk aversion and potential correction.
Combine technical and fundamental signals: For example, use breakout patterns along with macro cues like inflation data or rate hikes.
Rotations often begin before the broader market realizes it, so being early gives traders a decisive advantage.
7. Long-Term Investors: Why It Matters Even More
Long-term investors benefit immensely from recognizing market rotations. Allocating capital to leading sectors during each stage of the economic cycle can dramatically enhance portfolio returns and stability.
For instance:
During recoveries, investors can overweight cyclicals and small caps.
As the economy matures, shift to growth and technology.
During downturns, emphasize defensives and high-dividend stocks.
This proactive rebalancing approach not only boosts returns but also reduces drawdowns during turbulent markets. In short, understanding rotations leads to smarter asset allocation and compounding performance.
8. Tools and Indicators to Track Rotations
A few popular tools and indicators can help identify market rotations early:
Relative Rotation Graphs (RRG): Visually map sector momentum and relative strength.
ETF Flows: Track where institutional money is moving through sector ETFs.
Breadth Indicators: Monitor how many stocks are participating in rallies or declines.
Volume Profile & Market Structure: Analyze how institutional volume shifts across price levels and sectors.
By combining these tools with macro awareness, investors can stay aligned with the flow of capital — the real engine of market performance.
9. Common Mistakes Traders Make During Rotations
Many traders and investors fail to recognize market rotations until it’s too late. Here are common pitfalls:
Chasing past winners: Buying tech at the top while money rotates to energy or value stocks.
Ignoring macro trends: Overlooking interest rate changes or inflation data that trigger sector shifts.
Emotional bias: Staying loyal to a sector even when it loses relative strength.
Avoiding these mistakes requires discipline, regular analysis, and the flexibility to adapt your strategy when the market narrative changes.
10. The Bottom Line – Follow the Flow, Not the Noise
Market rotations aren’t just another trading concept — they are the heartbeat of market behavior. They reveal where big money is moving and why. Whether you’re managing a short-term portfolio or building long-term wealth, understanding rotations helps you:
Anticipate market trends
Position in leading sectors early
Manage risk more effectively
Capture outsized returns through strategic allocation
In the end, successful trading and investing come down to aligning with where capital is flowing next — not where it has been. By mastering market rotations, you move from reacting to trends to predicting and profiting from them.
Buy/Hold/Sell research report for HDFC Bank LimitedHDFC Bank is a fundamentally strong, fairly valued large-cap private sector bank. Technical breakout and upside to intrinsic value support a “Buy” for medium-term investors; passive holders can remain invested, while short-term traders should consider booking profits above ₹1,080. Target price: ₹1,080–₹1,120 in 3–6 months, long-term fair value ₹1,200..
HDFC Bank remains a leading performer with strong metrics, though ICICI Bank shows slightly better ROE and lower P/E.
Technical Analysis
Trend & Momentum: HDFC Bank has gained 3.7% over one month and 18.1% over one year, outperforming most private sector peers. The last quarter saw a price momentum shift upward, supported by strong volume (20-day average: ~21.6 million shares).
Support & Resistance: The stock currently trades at ₹1,002.55, with a 52-week high of ₹1,018.85 and a low of ₹812.15. Recent breakout above ₹995 level has triggered fresh buying, and seasonally, October is positive for HDFC Bank (11 out of 17 years ended higher; average October gain: 1.67%).
Volume & Liquidity: Large cap stock with healthy liquidity; delivery averages at 63.2%, indicating strong investor participation.
Fundamental Analysis
Valuation: P/E ratio at 21.82 and P/B at 2.97 are close to sector averages, indicating HDFC Bank is currently fairly valued (discount of 16% to intrinsic value).
Intrinsic Value: Median modeled intrinsic value is ₹1,199.82; current price offers a potential 20%+ upside to fair value.
Profitability: Robust Return on Equity (ROE) at 13.56%, year-on-year profit after tax growth of 9.32%, and NIM (Net Interest Margin) at 3.47%.
Balance Sheet Strength: Market Cap above ₹1.54 lakh crore; capital adequacy at 19.5% (well above regulatory requirements).
Dividend Yield: Attractive at 2.19%, contributing to total shareholder returns.
Governance: No pledged promoter shares; top-tier corporate governance.
Buy, Hold, Sell Assessment
Buy: Suitable for investors seeking exposure to stable, large private banks with high earnings quality. The breakout above ₹995 and momentum setup positions HDFC Bank well for a medium-term move toward intrinsic value.
Hold: Current holders can stay invested, benefiting from regular dividends, resilient earnings, and the expectation of sectoral re-rating.
Sell: For trading-only investors, if the price nears ₹1,050–₹1,080 in the coming months or if support at ₹985 fails, consider profit-booking or applying stop-loss management.
Disclaimer: lnkd.in

How to Trade Smart with Crypto1. Understand the Crypto Market Fundamentals
Before you can trade smart, you must understand what you’re trading. Cryptocurrencies are decentralized digital assets built on blockchain technology. Bitcoin (BTC), Ethereum (ETH), Solana (SOL), and thousands of others represent different projects, purposes, and technologies.
Key points to understand:
Bitcoin (BTC) is the first and most influential cryptocurrency, often seen as a digital store of value.
Altcoins like Ethereum, Binance Coin, and Cardano serve specific network functions (smart contracts, DeFi, etc.).
Stablecoins (like USDT, USDC) are pegged to fiat currencies and used for liquidity and hedging.
Tokens vs. Coins: Coins operate on their own blockchain (e.g., Bitcoin), while tokens are built on others (e.g., Uniswap token on Ethereum).
Understanding market structure—spot trading, futures, leverage, and decentralized exchanges (DEXs)—helps you make informed decisions rather than emotional ones.
2. Choose a Reliable Exchange and Secure Your Assets
Trading starts with choosing the right exchange. Reputable centralized exchanges like Binance, Coinbase, Kraken, or Bybit offer security, liquidity, and various tools. For advanced users, decentralized exchanges like Uniswap or PancakeSwap provide more control and privacy.
Smart traders prioritize security:
Use hardware wallets (Ledger, Trezor) for long-term storage.
Enable two-factor authentication (2FA) and strong passwords.
Avoid keeping large sums on exchanges; “not your keys, not your coins” is a golden rule.
A smart trader treats cybersecurity as seriously as trading strategy—because one mistake can mean total loss.
3. Learn Market Analysis: Fundamental vs. Technical
Two main forms of analysis drive smart trading: fundamental analysis (FA) and technical analysis (TA).
Fundamental Analysis
FA examines the intrinsic value of a crypto asset. Key factors include:
Project purpose – What problem does it solve?
Team and development – Are the developers credible?
Tokenomics – Supply, demand, and utility.
Adoption and partnerships – Who’s using or supporting it?
For example, Ethereum’s strength comes from its use in decentralized applications and DeFi, while meme coins often lack fundamentals and depend on hype.
Technical Analysis
TA studies price charts and patterns to forecast market behavior. Smart traders use indicators like:
Moving Averages (MA) – Identify trend direction.
Relative Strength Index (RSI) – Detect overbought or oversold conditions.
MACD – Reveal momentum shifts.
Support and Resistance – Predict entry and exit zones.
Combining FA and TA provides a balanced, data-driven approach instead of trading on speculation or emotion.
4. Develop a Clear Trading Strategy
A smart crypto trader never trades blindly. Instead, they follow predefined strategies based on risk appetite and time commitment.
Common strategies include:
a. Day Trading
Frequent trades within a day, taking advantage of volatility. It requires constant monitoring and fast decisions.
b. Swing Trading
Holding positions for days or weeks to capture medium-term price movements. It’s less stressful but demands chart analysis.
c. Scalping
High-frequency trading to profit from small price changes. This needs precision, low fees, and strong emotional control.
d. Position Trading
Long-term strategy based on major trends or fundamental belief in an asset’s future. Often used by Bitcoin or Ethereum holders.
e. Dollar-Cost Averaging (DCA)
Investing a fixed amount periodically regardless of price. It reduces emotional bias and smooths out volatility over time.
Choose a method that fits your lifestyle, time availability, and psychological comfort.
5. Manage Risk Like a Professional
Trading smart is not about maximizing profits—it’s about minimizing losses.
Risk management separates successful traders from gamblers.
Key principles include:
Never risk more than 1–2% of your capital per trade.
Set stop-loss orders to automatically limit downside.
Take-profit targets to secure gains.
Diversify: Don’t put all your money into one coin or project.
Use leverage cautiously: Leverage amplifies both gains and losses.
A disciplined trader thinks in probabilities, not certainties. Even the best setups can fail; risk management ensures you live to trade another day.
6. Keep Emotions in Check
The crypto market is extremely volatile—prices can move 20% in an hour. Greed and fear often drive traders to make impulsive decisions. Smart traders master their emotions by following a system, not feelings.
Avoid:
FOMO (Fear of Missing Out) – Chasing hype can lead to buying tops.
Panic Selling – Dumping assets during dips often locks in losses.
Overtrading – Too many trades increase fees and mistakes.
Build emotional discipline by keeping a trading journal—record why you entered and exited a trade. Reviewing patterns helps you identify emotional triggers.
7. Stay Updated and Adapt
Crypto evolves daily—new technologies, regulations, and narratives emerge constantly. Staying informed gives traders an edge.
Follow:
News platforms like CoinDesk, CoinTelegraph, and Decrypt.
Data tools like CoinMarketCap and Glassnode.
On-chain analytics for wallet movements and whale activity.
Social signals from Twitter, Reddit, and Discord (with caution).
Adaptability is essential. For instance, shifts like Ethereum’s “Merge,” Bitcoin halving cycles, or new layer-2 solutions can drastically impact market sentiment.
8. Understand Market Cycles and Sentiment
Crypto operates in cycles driven by liquidity, investor psychology, and Bitcoin halving events. Typically:
Bull Markets – Optimism and price surges.
Bear Markets – Pessimism, consolidation, and accumulation phases.
Smart traders use tools like the Fear & Greed Index or on-chain metrics (e.g., exchange inflows) to read sentiment and position accordingly. They accumulate during fear and take profits during euphoria—the opposite of the crowd.
9. Embrace Automation and Tools
Smart traders leverage technology:
Trading bots execute automated strategies using algorithms.
Portfolio trackers like CoinStats or Zapper monitor performance.
Alert tools like TradingView notify price movements.
DeFi protocols enable yield generation through staking or liquidity provision.
However, automation requires careful setup. Bots can fail in volatile markets, so human oversight remains critical.
10. Think Long-Term and Build Wealth Sustainably
The smartest crypto traders see the market not just as a casino, but as a wealth-building ecosystem. They combine trading with long-term investing, staking, and diversification across assets like NFTs, DeFi tokens, and Bitcoin.
Principles for long-term success:
Compound your gains instead of withdrawing impulsively.
Learn continuously through books, courses, and communities.
Protect capital—survival is the first step to profitability.
Have patience—crypto rewards those who endure cycles.
Remember: The most successful traders are not those who made one lucky trade but those who consistently manage risk and adapt over time.
Conclusion
Trading smart in crypto is a blend of knowledge, strategy, and discipline. It’s about understanding market behavior, applying data-driven decisions, managing emotions, and protecting capital. While the market offers immense opportunities, it equally demands respect for its volatility and unpredictability.
Smart crypto trading isn’t about predicting every move—it’s about building a system that survives and thrives across all conditions. Whether you’re a beginner or a seasoned trader, the path to success lies in continuous learning, emotional mastery, and a focus on long-term growth rather than short-term greed.
In the ever-changing world of digital assets, remember this timeless rule:
Trade with logic, not emotion. Plan every move, and let patience and discipline guide your profits.