Divergence Based TradingDivergence occurs when the stochastic oscillator's peaks or troughs disagree with the price. For instance, if the stochastic makes lower highs while the price is rising, it indicates a bearish divergence. Likewise, higher stochastic lows against lower price lows indicate a bullish divergence.
HDFC Bank Limited ADR
No trades
Trade ideas

Support and Resistance Part 2Support occurs at the point where a downtrend is expected to pause due to a concentration of demand. Resistance occurs at the point where an uptrend is expected to pause due to a concentration of supply. Support and resistance areas can be identified on charts using trendlines and moving averages.

Basic to Advance in TradingMake profits in intraday.
Stock market concepts and workings explained from very basic level.
Learn powerful day trading strategies.
Learn a step by step approach of how to trade in intraday.
Trend Following (Wealth Generation)
Learn the art of minimizing the risk and maximizing the return.

Management and PsychologyManagement psychology explores how psychological principles and theories can be applied to understand and improve organizational performance. It focuses on human behavior, motivation, and decision-making within a workplace context, helping managers develop more effective strategies for leading teams and achieving business goals.

Falling Wedge Breakout with Bullish Structure | 15-Min Chart🏦 HDFC BANK LTD – Falling Wedge Breakout with Bullish Structure | 15-Min Chart
📅 Date: April 25, 2025
📈 Timeframe: 15-Minute
🔍 Stock: HDFC Bank Ltd (NSE)
📌 Technical Overview:
HDFC Bank is showing signs of a potential bullish reversal on the 15-minute chart, forming a falling wedge pattern, which is typically known for reversal setups. Price action suggests a breakout from the wedge structure, with strong volume support.
🧩 Chart Pattern:
A clear Falling Wedge is identified using two converging trendlines (red).
Within the wedge, price completed a potential AB=CD harmonic structure, bottoming out near ₹1,891.
The breakout candle has closed above the upper trendline, signaling early strength.
🔍 Key Price Levels:
Support Zone: ₹1,891.80 (marked in red)
Immediate Resistance: ₹1,933.00 (green horizontal line)
CMP: ₹1,917.70
A sustained move above ₹1,933 may open room for further upside, potentially towards the ₹1,960–₹1,980 range as per the chart projection.
📊 Volume Analysis:
Noticeable pickup in green volume bars on the breakout candle.
This confirms growing interest and participation from the bulls.
🧠 Observational Bias:
As long as the price holds above ₹1,891 and sustains the breakout, the short-term trend appears to be tilting in favor of buyers. A retracement or retest of the wedge breakout zone may offer additional confirmation.

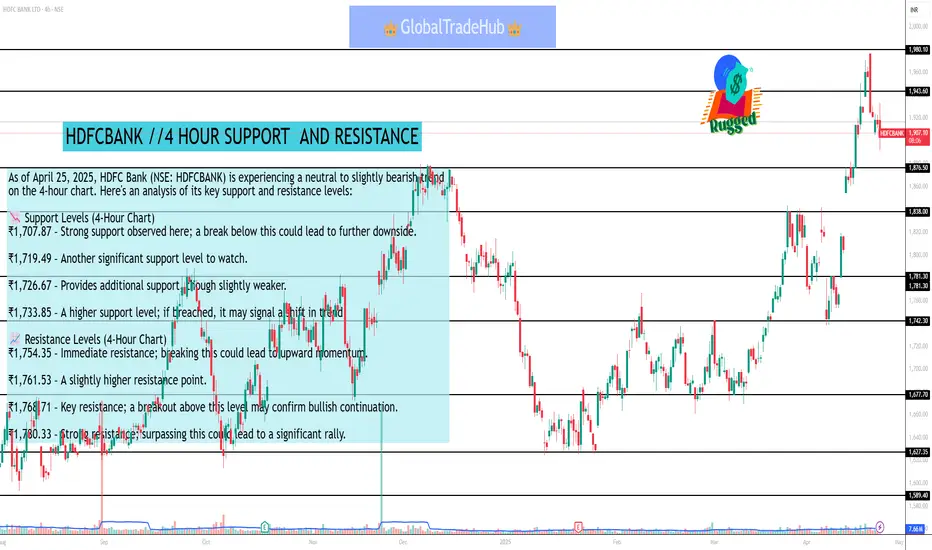
HDFCBANK //4 HOUR SUPPORT AND RESISTANCEAs of April 25, 2025, HDFC Bank (NSE: HDFCBANK) is experiencing a neutral to slightly bearish trend on the 4-hour chart. Here's an analysis of its key support and resistance levels:
📉 Support Levels (4-Hour Chart)
₹1,707.87 – Strong support observed here; a break below this could lead to further downside.
₹1,719.49 – Another significant support level to watch.
₹1,726.67 – Provides additional support, though slightly weaker.
₹1,733.85 – A higher support level; if breached, it may signal a shift in trend.
📈 Resistance Levels (4-Hour Chart)
₹1,754.35 – Immediate resistance; breaking this could lead to upward momentum.
₹1,761.53 – A slightly higher resistance point.
₹1,768.71 – Key resistance; a breakout above this level may confirm bullish continuation.
₹1,780.33 – Strong resistance; surpassing this could lead to a significant rally.
Technical TradingIn trading, "technical" refers to the practice of analyzing historical price and volume data to identify patterns and predict future price movements. This approach, called technical analysis, is a way to evaluate securities and forecast their behavior based on charts and statistical data.

Option Chain AnalysisAn option chain is a comprehensive list of all available option contracts for a specific underlying asset, typically a stock, index, or commodity. It's organized by strike price and expiration date, displaying both call and put options. Traders use this information to understand market sentiment, develop trading strategies, and manage risk.

HDFC BANK tgt 2119HDFC BANK Latest Quarter result is good and technical breakout previouse resistance and made new support was 1886, if buy this level tgt is 2119

HDFCBANK RESISTANCE TRENDLINE BREAKOUTHdfcbank breaking #resistance trendline weekly basis
good volume building up last few week
trading at new ATH,RSI bullish
trading above all key ema
#q4results are good
#niftybank trading at ATH
soon can touch #target 2000

Banks in focus, chart: 2 HDFCChart -> SBI Daily
All time high breakout with run-away gap.
CMP: 1906
Good Range to Buy: 1920 to 1880
Targets: 1985, 2036
SL: 1855 Daily Close
Disclaimer: This is for educational purposes only, not any recommendations to buy or sell. As I am not SEBI registered, please consult your financial advisor before taking any action.

HDFCBANK Brekout & Make New Life time High 19/04/2025 NSE INDIA , SYMBOL : HDFCBANK TIMEFRAME : DAILY : HDFCBANK breakout lifetime high on dated 5/12/2024 . Monday watch 1880 resistance important level . Hdfcbank may be retest the level & bullish rally may be continue

Technical TradingTechnical trading is a broader style that is not necessarily limited to trading. Generally, a technician uses historical patterns of trading data to predict what might happen to stocks in the future. This is the same method practiced by economists and meteorologists: looking to the past for insight into the future.

RSI ( Relative Strength Index)The Relative Strength Index (RSI) is a momentum oscillator used in technical analysis to measure the speed and change of price movements of an asset. It oscillates between 0 and 100 and is often used to identify potential overbought or oversold conditions. An RSI reading above 70 is generally considered overbought, while a reading below 30 suggests oversold conditions

Database Trading Part 3Trading data is a sub-category of financial market data. It provides real-time information about stock and market prices as well as historical trends for assets such as equities, fixed-income products, currencies and derivatives. Trading data also includes information about trades historically and over the course of a trading day, such as the latest bid, asking price and time of the last trade.

Another bank Break away gap...HDFC bank is showing Breakaway gap.
This is another bank which this pattern.
This means a good rally is brewing in this counter.
SL 1795 can be considered.

Candlesticks pattern part 2A daily candlestick represents a market's opening, high, low, and closing (OHLC) prices. The rectangular real body, or just body, is colored with a dark color (red or black) for a drop in price and a light color (green or white) for a price increase.

Candle sticks patternCandlestick patterns are technical trading tools that help traders predict price direction and market sentiment. They are based on past price movements and can help analysts identify shifts in supply and demand, which can aid in predicting trend reversals, continuations, and potential price levels.

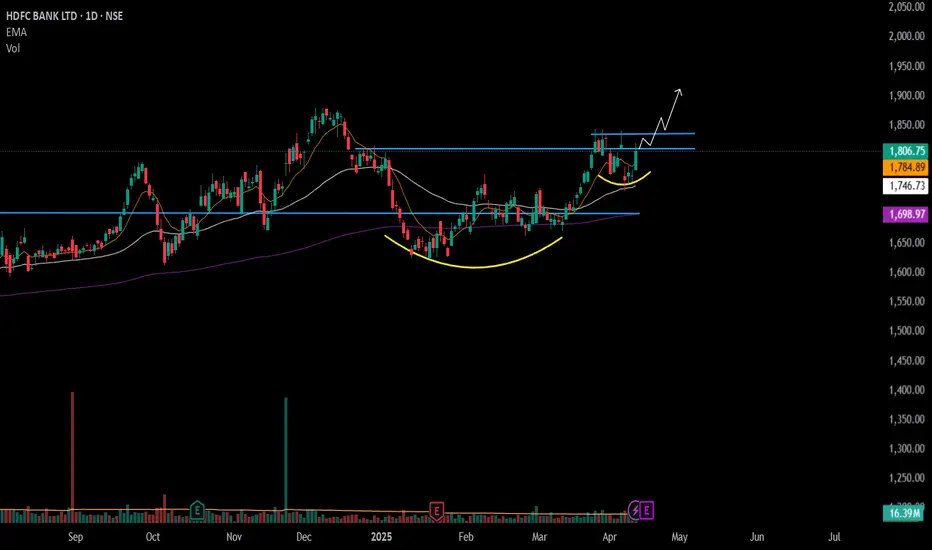
#HDFCBANK - Potential Breakout / Keep in WL 📊 Script: HDFCBANK
Key highlights: 💡⚡
📈 Cup & Handel Break Out in Daily Time Frame.
📈 Price consolidation near Resistance
📈 Enter only if Volume spike is seen.
📈 One can go for Swing Trade.
BUY ONLY ABOVE 1838 DCB
⏱️ C.M.P 📑💰- 1806
🟢 Target 🎯🏆 – NA%
⚠️ Stoploss ☠️🚫 – NA%
️⚠️ Important: Market conditions are bad, Position size 20% per Trade. Protect Capital Always
⚠️ Important: Always Exit the trade before any Event.
⚠️ Important: Always maintain your Risk:Reward Ratio as 1:2, with this RR, you only need a 33% win rate to Breakeven.
✅Like and follow to never miss a new idea!✅
Disclaimer: I am not SEBI Registered Advisor. My posts are purely for training and educational purposes.
Eat🍜 Sleep😴 TradingView📈 Repeat 🔁
Happy learning with MMT. Cheers!🥂
Database Trading Analysis Part 3Advanced database trading analysis combines powerful database technologies with sophisticated data analysis techniques to gain deeper insights into financial markets and improve trading strategies. This involves using techniques like data mining, OLAP, predictive modeling, and machine learning to analyze large datasets and make informed predictions. The goal is to identify patterns, trends, and anomalies that can be used to make profitable trading decisions.

MACD Analysis Part-2Moving average convergence/divergence (MACD) is a technical indicator to help investors identify price trends, measure trend momentum, and identify entry points for buying or selling. Moving average convergence/divergence (MACD) is a trend-following momentum indicator that shows the relationship between two exponential moving averages (EMAs) of a security’s price. MACD was developed in the 1970s by Gerald Appel, and is one of the most popular technical tools, readily available on most trading platforms offered by online stock brokers.

MACD TradingMoving average convergence/divergence (MACD) is a technical indicator to help investors identify entry points for buying or selling. The MACD line is calculated by subtracting the 26-period exponential moving average (EMA) from the 12-period EMA. The signal line is a nine-period EMA of the MACD line.

Explanation of RSIRSI is a tool that aids traders in capturing market momentum by measuring the fluctuation in prices. Traders rely on RSI to spot oversold and overbought markets and determine the right time to enter a trade. RSI helps traders identify whether a stock is either overbought or oversold.
