Meaning of Management and psychologyManagement is the process of planning, organizing, leading, and controlling resources to achieve organizational goals, while psychology is the scientific study of behavior and mental processes. Management psychology, also known as managerial psychology, applies psychological principles to understand and improve managerial practices and organizational behavior.
HDFC Bank Limited ADR
No trades
Trade ideas

Divergence SecretsDivergence is so effective because it reveals hidden shifts in market momentum before they show up on price charts. Here's why it's worth paying attention to: Early Signals: Divergences give you a head start by showing potential reversals before they happen.

Candle sticks pattern analysisA bullish candlestick is typically green or white and means the closing price is higher than the opening price, indicating upward momentum. Inversely, a bearish candlestick, generally red or black, signals that the closing price was lower than the opening price, reflecting downward pressure.
-If the upper wick on a red candle is short, then it indicates that the stock opened near the high of the day.
-On the other hand, if the upper wick on a green candle is short, then it indicates that the stock closed near the high of the day.

MACD trading techniquesThe Moving Average Convergence Divergence (MACD) is a technical analysis indicator used to identify potential buy and sell signals by analyzing the relationship between two exponential moving averages (EMAs) of a security's price, typically a 12-period and a 26-period EMA.

where should ur alarm bells ring?HDFC Bank CMP 1817
Volume - we see a huge surge in volumes since Mar-23. I have marked the same within a box. What this suggests is that people have moved to safety as this stock is very resilient. To me this is late entry from retail.
Oscillators - mind u this is monthly charts and both the composite and the RSI are still above their averages. This is giving it support.Also it is above 1780. Now look at the RSI, it has only managed to reach the bear zone while the stock is making new highs. This is bearish.
Elliott - I know the current rally is corrective and hence a healthy correction is on the way.
History - Once a bear zone , is always a bear zone. Hence the 1680 zone is the most critical zone as of now. And to me below this is where ur alarm bells should ring.
Conclusion - the steep fall in the US mkts is a precursor to what will happen here, and since HDFC bank and ICICI Bank together has more than 20% weight in Nifty, a close watch is required

ENTRY-ADD-EXIT IDEA for HDFCIt is a backtest about optimal entry-exit strategy for HDFC Bank on a long term basis. We consider the base formation after the 2008 crash, entry signals at new highs with large price-volume action, keep adding at newer highs in tranches and exit in 2020 during the pandemic crash based on PSar, EMA 21 indicators and when the LTP falls about 14% from the ATH. The RDX also adds conviction to it.
Can be re-entered as the market recovers in a V-Shape soon after.

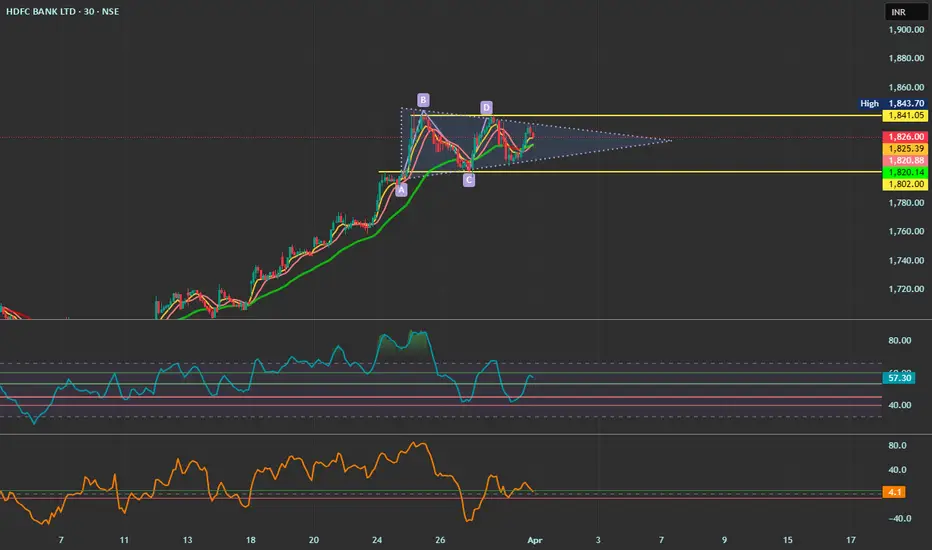
HDFC BANK CHART Analysis 01.04.2025hi, chart showing symmetrical triangle pattern ...
Do not ask for Buy or Sell tips in the channel.
I/We are not SEBI Registered Advisors. We don't provide any types of Buy/Sell signals. This is purely for educational and learning purposes. We shall not be responsible for your profit or loss. Please confirm with your financial advisor.
Hdfc Bank next 12% gain above 1880Hdfc Bank next 12% gain above 1880 closing, positional tgt 2100 good opportunity for investor buy above 1880, pls maintain risk reward ratio.

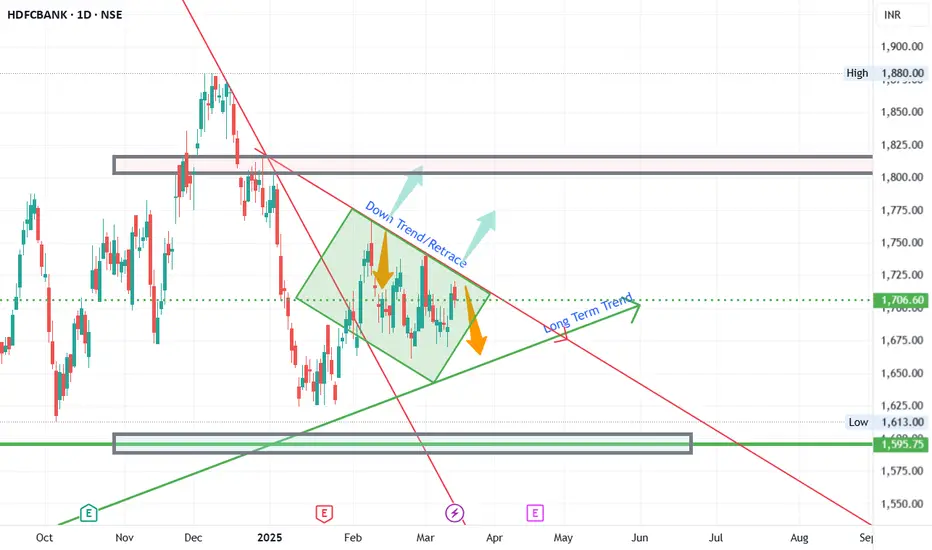
HDFC Bank - Long Term AnalysisFundamentals/Basis:
HDFC Bank is an important scrip that need to be monitored on long term basis, if we invest or not.
This is due to the fact, as a leader in the banking industry and a heavy weight company in the Nifty and bank nifty constituencies, HDFC bank provides clues to the overall market direction (most of the times)
This analysis is for Long term and if time permits, will keep updating throughout the year.
Technicals :
HDFC bank fell from its highs since end of 24 until jan. And had a retracement until approximately 1770 and formed a retracement trend direction.
Current range : 1600 to 1800 with 1700s as pivots.(Not formula but based on charts)
Trade Ideas :
If the price moves above the retracement line and sustains, go for long in the stock. Once it breaks lookout for confirmation at this trendline and also at the Long term trendlines for any retests.
Alternatively, if the price falls below the Long term trend direction, wait for confirmation on the bullishness.
Disclaimer : All the views and analysis provided are my personal analysis. Not a SEBI registered analyst. Plan and trade as per your analysis
If you Like the Analysis and agree with , Hit the Boost button and share your views agreements/constructive feedback in the comments.
Would you like me provide any of your favorite stocks analysis, let me know in the comment.
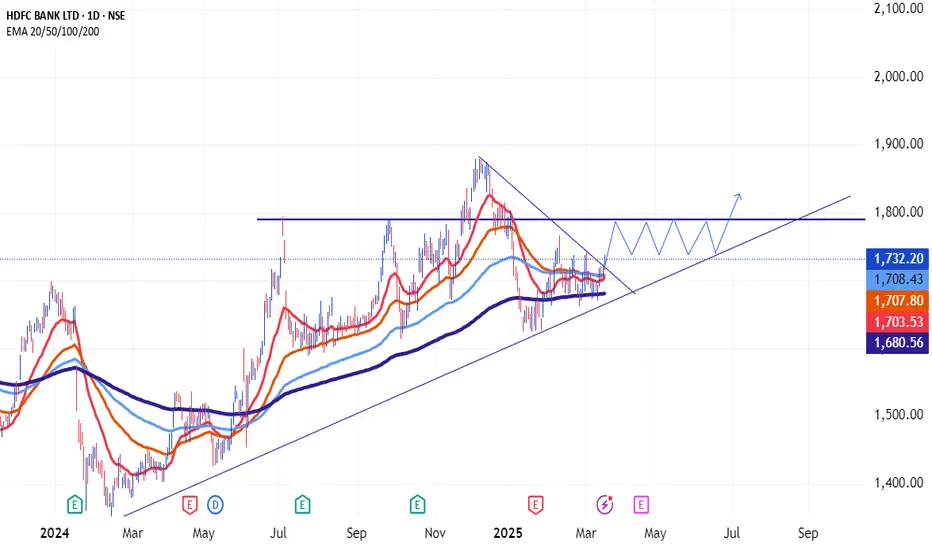
HDFC Bank - Swing Trade NSE:HDFCBANK is looking Super Strong on the Daily time frame after forming a perfect base today it broke out and closed significant levels with MACD and RSI Trending Upwards it Can retest its ATH Levels soon.
About:
NSE:HDFCBANK is an Indian banking and financial services company headquartered in Mumbai. It is India's largest private sector bank by assets and the world's tenth-largest bank by market capitalization as of May 2024.
As of April 2024, NSE:HDFCBANK has a market capitalization of $145 billion, making it the third-largest company on the Indian stock exchanges. It is India's one of 3 systemically important banks with a 15% market share in the banking sector’s advances and a 37% market share in the private sector banks’ advances as of FY24.
F&O Activity:
Short's Getting Covered in Futures with decreasing OI with 1740 CE OI covering Significantly.
Trade Setup:
Buy on Dips if Possible Near Base Levels or Start with a Few Qty to see the momentum if continues further Sharply or Consolidates.
Target(Take Profit):
Ideally around ATH Levels near 1860 to 1880 Levels
Stop Loss:
Entry Candle Low for Swing Traders and Swing Low Base Formed as Mentioned for Positional and Buy on Dips Traders.
📌Thank you for exploring my idea! I hope you found it valuable.
🙏FLLOW for more
👍BOOST if useful
✍️COMMENT Below your views.
Meanwhile, check out my other stock ideas on the right side until this trade is activated. I would love your feedback.
Disclaimer: "I am not SEBI REGISTERED RESEARCH ANALYST AND INVESTMENT ADVISER."
This analysis is intended solely for informational and educational purposes only and should not be interpreted as financial advice. It is advisable to consult a qualified financial advisor or conduct thorough research before making investment decisions.

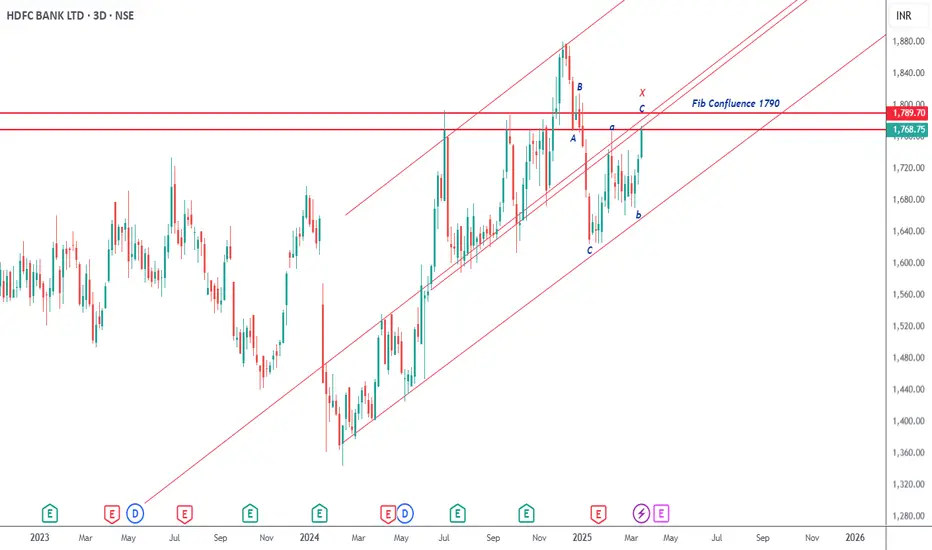
Another round of correction on the wayHDFC Bank CMP 1769
I had posted previously how this stock has turned negative on higher time frame charts. Now it is set on the daily charts as well.
Elliott- The first correction from the highs is a bullish zig zag. It is followed by another corrective pattern which is a bearish zig zag. Hence a fresh three wave fall ABC should begin from here.
Fibs- the current zone and the next at 1769 are both fib confluence zones and hence strong resistance.
Channel - the stock is also at channel resistance as well.
Conclusion - In my view it will break the 1600 zone this time around.
HDFC Bank Bullish View From Here HDFC Bank is one of the largest private sector banks in India. It offers a wide range of financial services, including retail banking, wholesale banking, credit cards, personal loans, home loans, and wealth management.
### **Key Facts:**
- **Founded:** August 1994
- **Headquarters:** Mumbai, Maharashtra, India
- **CEO:** Sashidhar Jagdishan
- **Parent Company:** Housing Development Finance Corporation (HDFC)
- **Stock Listing:** Listed on both the **NSE** and **BSE**
- **Merger:** Merged with HDFC Ltd (its parent company) in **July 2023**
### **Products & Services:**
- **Bank Accounts:** Savings, Current, Salary Accounts
- **Loans:** Personal, Home, Auto, Business, and Education Loans
- **Credit Cards:** Multiple options, including cashback, rewards, and co-branded cards
- **Investments:** Mutual Funds, Fixed Deposits, SIPs, Bonds
- **Digital Banking:** NetBanking, Mobile Banking, PayZapp
- **Insurance:** Life, Health, and General Insurance
overview of financial markets# **Overview of Financial Markets**
Financial markets facilitate the **buying, selling, and exchange of financial assets**, driving economic growth and investment opportunities.
## **1️⃣ Types of Financial Markets**
✅ **Stock Market:** Trading of company shares (e.g., NSE, BSE).
✅ **Bond Market:** Governments & corporations issue debt securities.
✅ **Forex Market:** Global currency trading with high liquidity.
✅ **Commodities Market:** Gold, oil, and agricultural products.
✅ **Derivatives Market:** Futures & options for hedging and speculation.
## **2️⃣ Key Functions**
✅ **Capital Formation:** Helps businesses raise funds.
✅ **Liquidity:** Ensures smooth asset transactions.
✅ **Risk Management:** Hedging through derivatives.
### **Conclusion**
Financial markets play a **crucial role in wealth creation, economic stability, and investment diversification**, making them essential for traders and investors. 🚀

Advance Divergnce Trading# **Advanced Divergence Trading**
Divergence occurs when **price action and indicators (RSI, MACD, etc.) move in opposite directions**, signaling potential reversals. **Advanced divergence strategies** help traders refine entries and exits.
## **1️⃣ Types of Advanced Divergence**
✅ **Regular Divergence (Reversal Signals):**
🔹 **Bullish:** Price makes **lower lows**, indicator makes **higher lows** → **Buy signal**.
🔹 **Bearish:** Price makes **higher highs**, indicator makes **lower highs** → **Sell signal**.
✅ **Hidden Divergence (Trend Continuation):**
🔹 **Bullish:** Price makes **higher lows**, indicator makes **lower lows** → **Trend continuation up**.
🔹 **Bearish:** Price makes **lower highs**, indicator makes **higher highs** → **Trend continuation down**.
## **2️⃣ Advanced Trading Strategies**
✅ **Multi-Timeframe Divergence:** Confirm signals across different timeframes.
✅ **Divergence with Volume & Price Action:** Stronger confirmation when paired with **support-resistance and breakout levels**.
✅ **Divergence with MACD Histogram:** Early momentum shift detection before major moves.
### **Conclusion**
Advanced divergence trading helps in **predicting reversals, trend continuations, and refining trade entries**, making it a powerful tool for traders. 🚀

MACD trading with histogram# **MACD Trading with Histogram**
The **MACD Histogram** helps traders visualize **momentum strength and trend shifts** by measuring the gap between the MACD Line and Signal Line.
## **1️⃣ Understanding the Histogram**
✅ **Positive Histogram:** Bars above zero → **Bullish momentum** (MACD above Signal Line).
✅ **Negative Histogram:** Bars below zero → **Bearish momentum** (MACD below Signal Line).
✅ **Expanding Bars:** Strengthening trend.
✅ **Shrinking Bars:** Weakening trend → **Possible reversal**.
## **2️⃣ Trading Strategies**
✅ **Histogram Crossover:**
🔹 **Bullish:** Histogram moves from negative to positive → Buy.
🔹 **Bearish:** Histogram moves from positive to negative → Sell.
✅ **Histogram Divergence:**
🔹 **Bullish Divergence:** Price makes lower lows, histogram forms higher lows → **Uptrend reversal**.
🔹 **Bearish Divergence:** Price makes higher highs, histogram forms lower highs → **Downtrend reversal**.
### **Conclusion**
Using the **MACD Histogram** with **trendlines and support-resistance levels** improves trade accuracy and **helps identify momentum shifts early**. 🚀

Why HDFC Bank not move in Two Day Rally HDFC Bank Limited is India's largest private sector bank by assets and market capitalization, headquartered in Mumbai. citeturn0search1 Established in August 1994, the bank commenced operations as a Scheduled Commercial Bank in January 1995. citeturn0search3 In July 2023, HDFC Bank merged with its parent company, HDFC Limited, India's premier housing finance company, further strengthening its position in the financial sector. citeturn0search7
The bank offers a comprehensive range of banking and financial services to individuals and businesses, including savings and current accounts, fixed and recurring deposits, loans, credit cards, investments, and insurance products. citeturn0search0 It operates internationally, with branches in Bahrain, Hong Kong, and Dubai. citeturn0search9
As of March 6, 2025, HDFC Bank's shares remained unchanged at ₹1,689.75 on the Bombay Stock Exchange (BSE), while the BSE SENSEX Index rose by 0.83% to 74,340.09. The bank's shares are currently 10.12% below their 52-week high of ₹1,880.00, reached on December 9, 2024. citeturn0news11
In recent developments, HDFC Bank plans to significantly expand its loan securitization business over the next few years to cater to rising investor demand and manage its balance sheet. This initiative aims to create space for new loans without increasing the balance sheet size. So far, the bank has sold ₹463 billion ($5.3 billion) in loans through securitization this financial year. citeturn0news12
For more information or to access their services, you can visit HDFC Bank's Website

Stood solid but its not showing weaknessHDFC Bank CMP 1690
In this entire period of brutal massacre this stock stood as a rock. I just dug a bit deeper here and found that the stock is now preparing to correct.
At channel resistance the RSI could only reach the bear zone and now it is also below its averages. Mind u this is the monthly chart and hence we need to give it the due respect.
Fib - on the weekly chart on the right the stock cannot rally beyond the 50 %, that's weakness. The composite and the RSI are absolutely positioned below their averages and are preparing for a fall.
Conclusion - to me this stock will correct minimum to 1380 which is the channel support as well as the Fib support. This is a good 22% from the current levels.

HDFCBANKMarket Position
The company is India's one of 3 systemically important banks with a 15% market share in the banking sector’s advances and a 37% market share in the private sector banks’ advances as of FY24. It is also the second-largest bank in India. It is among the top 3 Government Banks collecting direct and indirect taxes for the Government of India. It is a market leader in almost every asset category.
Right now Indian Market is not supporting any long position at this moment, but the HDFCBANK chat looks very attractive. Weekly 50 SMA 1650 level & Price above 50 SMA. CMP 1710. however I am sharing with you all. I hope you will like this publication. Thanks for watching & visiting again.

HDFC Bank on crucial Resistance HDFC Ban can be shorted @Rs.1717/- with a SL of Rs.1728/- with a target of Rs.1680/- As can be seen in Chart that upside has been rejected by Resistence by a strong Inverted Hammer on 30 Min Time Frame Chart

what is adx and how does it works ?**SkyTradingZone** is your go-to source for educational content on trading, covering market insights, strategies, and in-depth analysis. Our goal is to empower traders with knowledge to navigate the markets effectively.
---
# **What is ADX (Average Directional Index) and How Does It Work?**
## **1️⃣ What is ADX?**
The **Average Directional Index (ADX)** is a **trend strength indicator** developed by J. Welles Wilder. It helps traders measure the **strength of a trend** and determine whether the market is trending or consolidating.
📌 **ADX Components:**
- **ADX Line** → Measures trend strength (values from 0 to 100).
- **+DI (Positive Directional Indicator)** → Measures **bullish** strength.
- **-DI (Negative Directional Indicator)** → Measures **bearish** strength.
### **Formula for ADX Calculation**
1️⃣ Calculate **Directional Movement (DM)**
- **+DM** = Current High - Previous High (if positive)
- **-DM** = Previous Low - Current Low (if positive)
2️⃣ Calculate **True Range (TR)**
- TR = Highest of (Current High - Current Low, |Current High - Previous Close|, |Current Low - Previous Close|)
3️⃣ Calculate **Smoothed Moving Average of DM & TR**
4️⃣ Compute **DI+ and DI-**
- **+DI = (Smoothed +DM / Smoothed TR) × 100**
- **-DI = (Smoothed -DM / Smoothed TR) × 100**
5️⃣ Compute ADX using the difference between +DI and -DI.
---
## **2️⃣ How to Interpret ADX?**
📌 **ADX Trend Strength Scale:**
| **ADX Value** | **Trend Strength** |
|-------------|------------------|
| **0-20** | Weak or No Trend (Sideways Market) |
| **20-40** | Moderate Trend (Growing Momentum) |
| **40-60** | Strong Trend (Trending Market) |
| **60-100** | Extremely Strong Trend (Overheated Market) |
🔹 **Rising ADX** → **Trend is strengthening** (bullish or bearish).
🔹 **Falling ADX** → **Trend is weakening** (possible consolidation or reversal).
🔹 **ADX below 20** → **Sideways market, no clear trend**.
📌 **+DI vs. -DI Interpretation**
- If **+DI is above -DI**, the market is in an **uptrend**.
- If **-DI is above +DI**, the market is in a **downtrend**.
- If **ADX is below 20**, the market is in a **choppy range** → Avoid trend-based trades.
---
## **3️⃣ How to Use ADX in Trading?**
### 🔹 **1. Identifying Strong Trend Opportunities**
✅ **ADX Above 25** → Indicates a strong trend, traders can enter a trade in the trend’s direction.
✅ **ADX Below 20** → Market is ranging, avoid trend-based strategies.
📌 **Example:** If **ADX rises from 20 to 40**, it confirms an **ongoing strong trend** (either bullish or bearish).
### 🔹 **2. Trend Confirmation Strategy**
**Buy Setup:**
✅ **+DI crosses above -DI** → Bullish trend signal.
✅ **ADX above 20** → Confirms strength.
✅ Enter a **long position** when ADX rises above 25.
**Sell Setup:**
✅ **-DI crosses above +DI** → Bearish trend signal.
✅ **ADX above 20** → Confirms downtrend.
✅ Enter a **short position** when ADX rises above 25.
📌 **Example:** If **+DI crosses above -DI & ADX > 25**, enter a long trade.
### 🔹 **3. Combining ADX with Other Indicators**
📌 **Strategy 1: ADX + Moving Averages**
✅ Use **ADX > 25** to confirm a **moving average crossover signal**.
✅ **If ADX is below 20**, avoid moving average-based signals.
📌 **Strategy 2: ADX + RSI (Relative Strength Index)**
✅ **ADX above 25 & RSI above 50** → Strong uptrend (buy signal).
✅ **ADX above 25 & RSI below 50** → Strong downtrend (sell signal).
📌 **Strategy 3: ADX + Support & Resistance**
✅ If **ADX is rising near a breakout level**, it confirms a **trend continuation**.
✅ If **ADX is falling near support/resistance**, it signals **a possible reversal**.
---
## **4️⃣ Example: ADX Trading in Nifty 50**
| **Date** | **ADX Value** | **+DI** | **-DI** | **Market Condition** |
|---------|------------|------|------|----------------|
| Feb 15 | 18 | 23 | 21 | No Trend (Range-bound) |
| Feb 16 | 30 | 28 | 15 | Strong Uptrend (Buy Signal) |
| Feb 17 | 42 | 32 | 10 | Very Strong Uptrend |
| Feb 18 | 50 | 35 | 8 | Extremely Strong Trend (Watch for Reversal) |
📌 **Observation:**
- ADX **rising above 25** confirms a **strong bullish trend**.
- If ADX **peaks at 50+**, trend exhaustion may occur → **Reversal possible**.
---
## **5️⃣ Common Mistakes When Using ADX**
⚠️ **Misinterpreting Low ADX as a Bearish Signal** – Low ADX means **no trend**, not necessarily bearish.
⚠️ **Ignoring DI Crossovers** – ADX alone doesn’t indicate direction; **DI crossovers confirm bullish/bearish trends**.
⚠️ **Trading Every ADX Move** – ADX should be used **with trend-following indicators** like RSI or Moving Averages.
---
## **Conclusion**
The **ADX Indicator** is a **powerful tool** to measure **trend strength and confirm market direction**. By combining **ADX with DI crossovers and support/resistance levels**, traders can improve their accuracy in **trend-following strategies**.
In future lessons, we will cover:
✅ **Live Chart Examples of ADX Trading**
✅ **How to Combine ADX with Moving Averages for Stronger Entries**
✅ **Building a Trend-Following Strategy Using ADX**
Stay tuned for more insights!
---
🔹 **Disclaimer**: This content is for educational purposes only. *SkyTradingZone* is not SEBI registered, and we do not provide financial or investment advice. Please conduct your own research before making any trading decisions.

HDFC BANK LTD (NSE)📢 Smart Trading Opportunity – HDFC BANK LTD (NSE) 📢
🚀 Maximize Profits with a Strategic Approach! 🚀
Unlock potential trading opportunities with well-defined entry, target, and risk management strategies.
🔹 Bullish Pattern & Entry Plan
🔹 Entry Confirmation – Above Trendline Break
🔹 Target – ₹1,913.45 (Projected Upside)
🔹 Breaking Range – ₹1,804.40 (Key Resistance)
🔹 Risk-Reward Management – Optimize with stop-loss adjustments
🔻 Bearish Scenario & Downside Plan
🔻 Immediate Support – ₹1,625.45
🔻 Selling Target – ₹1,514.35 (Bearish Confirmation)
🔻 Entry for Strong Bearish Move – ₹1,482.40
📊 Key Trading Strategy 📊
✅ Swing Trading & Short-Term Holding Opportunities
✅ Price Action & Pattern-Based Entries
✅ Risk-Managed Approach – Protect your capital
✅ High Probability Trade Setup – Clear entry & exit points
⚠ Disclaimer: This is for educational purposes only, not a buy/sell recommendation. Trade responsibly and manage your risk!
Would you like me to include your logo and refine the design further? 🚀📈

What is volatility in trading and how to deal with it ?**Volatility** in trading refers to the degree of price fluctuations in a market or security over a specific period of time. It indicates how much and how quickly the price of an asset (like stocks, currencies, or commodities) can change. High volatility means large price movements, while low volatility suggests relatively stable prices.
### Key Aspects of Volatility:
1. **Price Fluctuations**: Volatility measures how much an asset's price increases or decreases. For example, if a stock moves 5% up and down within a day, it’s considered volatile.
2. **Market Sentiment**: Increased volatility often reflects uncertainty or strong emotions in the market, like fear, excitement, or speculation.
3. **Volatility Index (VIX)**: The **VIX** is a popular measure of market volatility, often referred to as the "fear index." It tracks expectations of future volatility based on S&P 500 index options.
### Types of Volatility:
1. **Historical Volatility**: Based on past price movements of an asset. It’s calculated by measuring the standard deviation of price changes over a defined period.
2. **Implied Volatility**: Derived from options prices, it reflects the market’s expectations of future volatility. High implied volatility often means the market anticipates large price moves.
### How to Deal with Volatility in Trading:
#### 1. **Risk Management**:
- **Set Stop-Loss Orders**: Protect yourself from large, unexpected price swings by placing stop-loss orders. This automatically sells your position if the price drops beyond a specified point.
- **Position Sizing**: Trade smaller positions when the market is highly volatile to limit potential losses.
- **Diversify**: Spreading your investments across different assets or markets can reduce overall portfolio volatility.
#### 2. **Use Volatility Indicators**:
- **Average True Range (ATR)**: This indicator measures market volatility by calculating the average range of price movement over a certain period. A higher ATR indicates more volatility.
- **Bollinger Bands**: These bands expand and contract based on volatility. When the market is more volatile, the bands widen; when it’s less volatile, the bands narrow. Traders use this to gauge price momentum and potential breakouts.
#### 3. **Trade with a Plan**:
- **Stay Disciplined**: Stick to your trading plan and avoid impulsive decisions. Volatile markets can lead to emotional trading, so having a well-defined plan helps you stay calm and make objective decisions.
- **Know Your Time Frame**: Volatility can affect short-term traders more dramatically than long-term investors. If you're a day trader, be prepared for fast changes, whereas long-term investors may benefit from ignoring short-term price swings.
#### 4. **Volatility Strategies**:
- **Straddle and Strangle (Options Trading)**: These strategies take advantage of expected high volatility. They involve buying both a call option (betting on a price increase) and a put option (betting on a price decrease). This way, you profit if the price moves significantly in either direction.
- **Scalping**: This strategy involves making numerous small trades throughout the day to capitalize on minor price movements. It requires quick decision-making and tight risk management.
#### 5. **Avoid Overtrading**:
- **Stay Calm**: High volatility can cause market noise, tempting traders to take excessive trades. Avoid overtrading by sticking to your strategy and waiting for clear opportunities.
- **Monitor News**: Volatility can be driven by news events, such as earnings reports or geopolitical events. Stay informed about potential sources of market-moving news and adjust your trading accordingly.
#### 6. **Hedging**:
- **Options and Futures**: Traders can hedge against volatility using options or futures contracts, which allow them to protect existing positions from adverse price movements. Hedging involves taking an opposite position to offset potential losses.
#### 7. **Adapt to Market Conditions**:
- Volatility can change over time, so it’s important to adjust your strategy to the current market environment. In highly volatile markets, it may be wise to use conservative strategies, while in calmer periods, more aggressive strategies could be appropriate.
---
### Summary:
Volatility is a natural part of financial markets, and while it can present both risks and opportunities, it requires careful management. By using tools like stop-loss orders, volatility indicators, and risk management strategies, traders can protect themselves from excessive losses while still capitalizing on market movements. Understanding volatility and adapting to it based on your trading style—whether you're a short-term trader or long-term investor—is key to managing it effectively.

Learn stock market from basic to advanceLearning the **stock market** from basic to advanced involves understanding the fundamental principles of how markets operate, how to evaluate stocks, the different types of trading strategies, and risk management techniques. Below is a structured guide to help you progress from beginner to advanced concepts in the stock market:
---
### **Stage 1: Stock Market Basics**
#### 1. **What is the Stock Market?**
- The **stock market** is a place where buyers and sellers trade stocks, which are shares of ownership in companies.
- It operates through exchanges like the **New York Stock Exchange (NYSE)** and **Nasdaq**.
- The market provides companies with a way to raise capital and gives investors a chance to earn returns on their investments.
#### 2. **Basic Terms You Should Know:**
- **Stock**: A share of ownership in a company.
- **Shareholder**: An individual or entity that owns shares in a company.
- **Dividend**: A payment made by a company to its shareholders, usually in cash or additional shares.
- **Ticker Symbol**: A unique identifier for a stock (e.g., **AAPL** for Apple).
- **Market Capitalization (Market Cap)**: The total value of a company’s shares (calculated by multiplying stock price by total shares outstanding).
- **Bull Market**: A market where stock prices are rising or expected to rise.
- **Bear Market**: A market where stock prices are falling or expected to fall.
#### 3. **How to Buy and Sell Stocks**:
- To trade stocks, you need a **brokerage account**. You can use traditional brokers or online brokerage platforms like **Robinhood**, **E*TRADE**, or **TD Ameritrade**.
- Learn the difference between **market orders** (buying/selling at current market prices) and **limit orders** (buying/selling at a specific price).
---
### **Stage 2: Intermediate Concepts**
#### 1. **Types of Stocks**:
- **Common Stocks**: Most common type of stock; provides voting rights and potential for dividends.
- **Preferred Stocks**: Offers dividends but usually no voting rights. Dividends are paid out before common stockholders.
- **Growth Stocks**: Stocks of companies expected to grow at an above-average rate.
- **Value Stocks**: Stocks that are considered undervalued compared to their earnings and growth prospects.
#### 2. **Stock Analysis**:
- **Fundamental Analysis**: Evaluating a company's financial health and growth prospects by looking at metrics like:
- **Earnings per Share (EPS)**: A company's profit divided by the number of outstanding shares.
- **Price-to-Earnings (P/E) Ratio**: A ratio that compares the stock price to the company's earnings.
- **Debt-to-Equity Ratio**: Measures a company's financial leverage.
- **Return on Equity (ROE)**: Measures a company’s profitability in relation to shareholders' equity.
- **Technical Analysis**: Analyzing historical price movements and volume to forecast future price trends using tools like charts and indicators (e.g., Moving Averages, RSI, MACD).
- Learn how to read stock **charts** and understand patterns like **head and shoulders**, **double tops**, and **flags**.
#### 3. **Types of Orders**:
- **Market Order**: Buy/sell at the best available current price.
- **Limit Order**: Buy/sell at a specified price or better.
- **Stop Loss Order**: Order to sell a stock if it reaches a certain price to limit losses.
- **Stop-Limit Order**: Combines a stop loss and a limit order.
#### 4. **Diversification**:
- Diversifying your portfolio means spreading investments across different sectors or asset classes (stocks, bonds, etc.) to reduce risk.
- **ETFs (Exchange-Traded Funds)** and **Mutual Funds** are good ways to diversify as they hold a basket of stocks from different sectors.
---
### **Stage 3: Advanced Concepts**
#### 1. **Advanced Stock Analysis**:
- **Valuation Models**: Understand advanced valuation methods like **Discounted Cash Flow (DCF)**, which estimates the value of a company based on its future cash flows.
- **Relative Valuation**: Comparing a company’s financial ratios to those of similar companies or industry averages.
#### 2. **Technical Analysis (Advanced)**:
- **Chart Patterns**: Dive deeper into chart patterns like **cup and handle**, **triangles**, and **channels**.
- **Candlestick Patterns**: Study candlestick formations like **doji**, **engulfing**, **hammer**, and **shooting star**, which can signal market reversals.
- **Indicators and Oscillators**:
- **Bollinger Bands**: Used to measure volatility and identify overbought/oversold conditions.
- **Moving Average Convergence Divergence (MACD)**: Helps identify potential buy and sell signals based on the convergence and divergence of moving averages.
- **Fibonacci Retracement**: A tool used to identify potential support and resistance levels based on the Fibonacci sequence.
#### 3. **Options Trading**:
- Learn about **call** and **put options**:
- **Call Options**: A contract that gives the holder the right (but not the obligation) to buy a stock at a certain price within a set period.
- **Put Options**: A contract that gives the holder the right to sell a stock at a certain price within a set period.
- Understand **options strategies** like:
- **Covered Calls**: Holding a stock and selling a call option on it.
- **Protective Puts**: Buying a put option to protect against a stock's potential decline.
- **Straddle**: Buying both a call and a put option on the same asset, betting on volatility.
- Study **implied volatility** and how it affects options prices.
#### 4. **Risk Management and Position Sizing**:
- Learn about the **Kelly Criterion**, **position sizing**, and the importance of **capital preservation**.
- **Stop Losses**: How to use stop losses effectively to limit your losses.
- **Risk-to-Reward Ratio**: Analyzing trades to ensure the potential reward justifies the risk.
#### 5. **Trading Psychology**:
- **Emotions and Biases**: Understand psychological factors like **fear**, **greed**, and **overconfidence**, which can affect trading decisions.
- Develop a **trading plan** and stick to it.
- Learn about **loss aversion**, where traders feel the pain of a loss more intensely than the joy of a gain, and how it affects decision-making.
#### 6. **Algorithmic and Quantitative Trading**:
- **Algorithmic trading** involves using computer programs to execute trades based on predefined criteria. Traders write algorithms that can trade at high speeds and execute complex strategies.
- **Quantitative trading** involves using mathematical models to identify trading opportunities based on historical data. This includes machine learning and AI.
---
### **Stage 4: Mastery & Continuous Learning**
#### 1. **Economic Indicators and Macro Trends**:
- Study how **economic data** (GDP, inflation, interest rates) and **central bank policies** (e.g., the Federal Reserve's decisions) impact the stock market.
- Learn about **global economic events** and their effect on domestic markets.
#### 2. **Hedging Strategies**:
- Learn how to **hedge** your portfolio using **options**, **futures contracts**, or other financial instruments to reduce risk.
#### 3. **Advanced Portfolio Management**:
- Build and manage a diversified portfolio using different asset classes (stocks, bonds, commodities, alternatives).
- Understand **Modern Portfolio Theory** and how to balance risk and reward across a portfolio.
#### 4. **Tax Efficiency and Financial Planning**:
- Learn about the tax implications of your trades (capital gains, dividends).
- Explore strategies to minimize tax liabilities, such as tax-loss harvesting.
#### 5. **Staying Updated**:
- Stay informed with **financial news**, **earnings reports**, and **company announcements**.
- Continuously backtest and optimize your strategies, refine your skills, and learn new market trends.
### **Additional Resources**:
- **Books**:
- "The Intelligent Investor" by Benjamin Graham
- "A Random Walk Down Wall Street" by Burton Malkiel
- "Market Wizards" by Jack Schwager
- "How to Make Money in Stocks" by William J. O'Neil
