Heikin Ashi Trading method**Heikin Ashi** is a type of charting technique used in technical analysis to help identify market trends and potential reversals with a smoother visual representation. It is often used by traders to reduce noise in the market and provide a clearer picture of price action. The term "Heikin Ashi" is Japanese for "average bar," which is fitting because it smooths price data to make trends easier to spot.
### How Heikin Ashi Charts Work:
Heikin Ashi charts are similar to traditional candlestick charts but differ in the way they calculate the open, high, low, and close prices. Instead of using the exact price data for each candle, Heikin Ashi uses a modified calculation that smooths out price action.
Here’s how Heikin Ashi candles are calculated:
1. **Heikin Ashi Close** = (Open + High + Low + Close) / 4
- This is the average price of the current period.
2. **Heikin Ashi Open** = (Previous Heikin Ashi Open + Previous Heikin Ashi Close) / 2
- This is the average of the open and close prices of the previous candle.
3. **Heikin Ashi High** = Maximum of (High, Heikin Ashi Open, Heikin Ashi Close)
- The highest price of the current period.
4. **Heikin Ashi Low** = Minimum of (Low, Heikin Ashi Open, Heikin Ashi Close)
- The lowest price of the current period.
### Key Features of Heikin Ashi Candles:
- **Smoothed appearance**: The Heikin Ashi method removes a lot of the "noise" that is present in traditional candlestick charts, making trends easier to spot.
- **Color-coded candles**:
- A **bullish candle** (usually green or white) indicates that the price is rising.
- A **bearish candle** (usually red or black) indicates that the price is falling.
- **Trend identification**: Heikin Ashi candles make it easier to identify the direction and strength of trends by showing sustained periods of one color (bullish or bearish). Conversely, when there is a mix of red and green candles, it could suggest a transition or indecision in the market.
### Interpreting Heikin Ashi Charts:
1. **Bullish Trends**:
- Look for **consecutive green (or white) candles** with **no lower shadows** or only very small shadows. This indicates strong buying momentum and suggests a continuation of the uptrend.
2. **Bearish Trends**:
- Look for **consecutive red (or black) candles** with **no upper shadows** or only very small shadows. This signals strong selling momentum and suggests a continuation of the downtrend.
3. **Reversals**:
- A **doji-like candle** (a candle with a small body and long wicks/shadows) can signal indecision and potential trend reversal.
- **Color changes**: If the color of the candles shifts from green to red (or from red to green), it may indicate that the trend is weakening or reversing.
- **Long upper and lower shadows**: This can indicate a potential reversal, especially when the trend has been strong. For example, if the price moves significantly in one direction but then closes near the opposite end, this could signal exhaustion and a possible reversal.
4. **Consolidation**:
- When you see candles with both long shadows (indicating price movement in both directions) and small bodies, it may indicate that the market is in a period of consolidation or indecision.
### How to Use Heikin Ashi for Trading:
1. **Trend Following Strategy**:
- **Buy Signal**: When you observe a series of green (bullish) Heikin Ashi candles with no or minimal lower shadows, it’s a sign of a strong uptrend. This is a potential signal to enter a long (buy) position.
- **Sell Signal**: When you observe a series of red (bearish) Heikin Ashi candles with no or minimal upper shadows, it’s a sign of a strong downtrend. This is a potential signal to enter a short (sell) position.
2. **Trend Reversal**:
- Look for a **color change** from green to red or red to green. A color change often indicates that the trend may be weakening or reversing, so it may be time to adjust your position accordingly.
- When the body of the candles shrinks (i.e., the distance between the open and close is small), and long shadows appear, this suggests that the trend is losing strength and a reversal might be coming.
3. **Support and Resistance**:
- Use **Heikin Ashi candles in conjunction with traditional support and resistance levels**. If the price is nearing a strong support or resistance level and you see a Heikin Ashi reversal candle (e.g., a doji or small-bodied candle), it may indicate a reversal in price.
4. **Combine with Other Indicators**:
- **Moving Averages**: Combine Heikin Ashi with a moving average (e.g., 50-period or 200-period moving average). When the price is above the moving average and Heikin Ashi candles are consistently bullish, it reinforces the trend.
- **RSI (Relative Strength Index)**: An overbought or oversold reading on the RSI, combined with a color change in Heikin Ashi candles, can give confirmation of a potential reversal.
- **MACD (Moving Average Convergence Divergence)**: Use MACD to confirm a Heikin Ashi trend. If both the Heikin Ashi candles and MACD indicate the same direction, it increases the confidence of your trade.
### Pros of Heikin Ashi Trading:
1. **Trend Clarity**: The smoothing effect makes it easier to identify trends and avoid market noise, helping traders stay in profitable trades longer.
2. **Reduced False Signals**: Heikin Ashi helps reduce false signals because it filters out a lot of the short-term price fluctuations that can lead to incorrect trade decisions.
3. **Clearer Trend Reversal Signals**: Heikin Ashi often signals trend changes earlier compared to traditional candlestick charts.
### Cons of Heikin Ashi Trading:
1. **Lagging Indicator**: Since Heikin Ashi is based on averaging previous price data, it can lag behind the actual price action. This can lead to delayed entry or exit signals.
2. **Less Precision**: The open, high, low, and close prices are not the actual prices from the market but are derived from averages. This can make it less precise for certain types of analysis (e.g., pinpointing exact price levels).
3. **Not Suitable for All Market Conditions**: Heikin Ashi works best in trending markets, but it may not be as effective in sideways or highly volatile markets where price action is erratic.
### Conclusion:
**Heikin Ashi** trading is a great tool for identifying trends and reversals with smoother, clearer visuals compared to traditional candlestick charts. By reducing market "noise," Heikin Ashi helps traders better spot trends and avoid choppy price action. However, it works best in trending markets and should ideally be combined with other technical indicators (like moving averages, RSI, or MACD) for confirmation. Like all tools, Heikin Ashi has its limitations, and it’s important to practice sound risk management and understand its nuances when integrating it into your trading strategy.
HDFC Bank Limited ADR
No trades
Trade ideas

HDFC - DIRT CHEAP BLUECHIP HDFC is down for unknown reasons. HDFC reported terrific quarterly numbers and is poised to hold no 1 position in the banking sector in India. Why i will heavily invest in HDFC at this price point:
the expected dividend income will beat the interest rates of FD done in the bank :)
The bank's EPS should grow appreciably in the large cap bucket as it will continue to generate more cash flows over time
Think this is a great time to buy for the long term. Have initiated bulk buys at this zone
Buy and forget!!

What is bollinger band and how to use it ?### **What is Bollinger Bands?**
**Bollinger Bands** is a technical analysis tool developed by John Bollinger in the 1980s. It consists of three lines (bands) that are plotted on a price chart:
1. **Middle Band (SMA)**: The middle band is typically a **20-period Simple Moving Average (SMA)** of the price. This acts as a baseline for the price trend.
2. **Upper Band**: The upper band is calculated by adding a set number of **standard deviations** (usually 2) to the middle band.
- **Upper Band = Middle Band + (2 × Standard Deviation)**
3. **Lower Band**: The lower band is calculated by subtracting a set number of standard deviations from the middle band.
- **Lower Band = Middle Band - (2 × Standard Deviation)**
These bands dynamically adjust to market volatility, expanding during periods of high volatility and contracting when the market is calmer.
### **How to Use Bollinger Bands**
Bollinger Bands are useful in several ways, primarily for identifying market volatility, overbought or oversold conditions, and potential price reversals.
#### 1. **Identifying Overbought and Oversold Conditions**
- **Overbought**: When the price moves toward the **upper band**, it could indicate that the asset is overbought, meaning that it may be due for a price pullback or reversal. However, the price can stay at or near the upper band for a while during strong trends, so caution is advised.
- **Oversold**: When the price moves toward the **lower band**, it could indicate that the asset is oversold, and a price bounce or reversal may be imminent. Again, prices can stay near the lower band for a while during strong downtrends.
#### 2. **Bollinger Band Squeeze**
- The **Bollinger Band Squeeze** occurs when the bands contract and come close together. This indicates low market volatility and suggests that a period of high volatility (and possibly a breakout) could be coming soon.
- A **squeeze** is often seen as a precursor to a big price movement, either upward or downward.
- Traders often look for breakouts from the squeeze, where the price moves above the upper band (bullish) or below the lower band (bearish).
#### 3. **Price Reversal Signals**
- **Price Touching or Breaking the Upper Band**: If the price breaks above the upper band, it may signal a **bullish** continuation in a strong uptrend, or a potential reversal if the price moves too far above the band.
- **Price Touching or Breaking the Lower Band**: If the price breaks below the lower band, it may signal a **bearish** continuation in a downtrend or a potential reversal if the price moves too far below the band.
#### 4. **Double Bottoms and Tops**
- **Double Bottoms**: When the price touches the lower band twice, and then begins to move back up, it may signal a potential **bullish reversal**.
- **Double Tops**: When the price touches the upper band twice, and then starts to pull back, it may signal a potential **bearish reversal**.
#### 5. **Trend Continuation**
- In a **strong trending market**, prices may consistently touch or stay near the upper or lower band for extended periods.
- In an uptrend, prices may touch or ride the upper band, indicating that momentum is strong.
- In a downtrend, prices may stay near the lower band, indicating that the downtrend is in control.
#### 6. **Bollinger Bands with Other Indicators**
Bollinger Bands are often used in combination with other indicators to confirm trade signals:
- **RSI (Relative Strength Index)**: You can use the **RSI** to confirm overbought or oversold conditions. For example, if the price touches the upper band, and the RSI shows overbought (above 70), it could strengthen the signal that a reversal is coming.
- **MACD (Moving Average Convergence Divergence)**: If the price is at an extreme (upper or lower band) and the MACD shows divergence (e.g., the price is going higher, but MACD is going lower), it could suggest a potential trend reversal.
### **Practical Example of Using Bollinger Bands**
1. **Market in a Range (Sideways Movement)**:
- When the price is moving within a range, and the bands are close together (indicating low volatility), a squeeze may occur. Traders might anticipate a breakout when the price moves above the upper band or below the lower band.
2. **Trending Market**:
- In a strong uptrend, prices often touch the upper band and may even trade above it for a while. If the price breaks above the upper band, it suggests that the trend is strong and might continue.
- In a strong downtrend, prices often touch the lower band and may even trade below it. If the price breaks below the lower band, it signals that the trend may persist.
3. **Reversal Signal**:
- If the price touches the upper band but then begins to move lower, it may signal a reversal or weakening of the uptrend (especially if confirmed by other indicators).
- Similarly, if the price touches the lower band but then starts to rise, it could signal a reversal or weakening of the downtrend.
### **Limitations of Bollinger Bands**
- **Not a Standalone Tool**: Bollinger Bands are best used in conjunction with other indicators and analysis tools. By themselves, they can give false signals, especially in choppy or sideways markets.
- **Lagging Indicator**: Like all technical indicators, Bollinger Bands are based on historical price data. They will not predict future price movements but only reflect current market conditions.
### **Conclusion**
Bollinger Bands are a versatile tool that can help you identify market volatility, overbought and oversold conditions, potential breakouts, and reversals. While they are useful for many traders, it's important to combine them with other technical analysis tools (like RSI, MACD, or trend lines) to get more reliable signals.
To use Bollinger Bands effectively:
- Look for **squeeze patterns** (tightening bands), indicating that a breakout might be imminent.
- Use the **upper and lower bands** to spot overbought or oversold conditions.
- Combine **Bollinger Bands** with other indicators and tools to confirm signals and improve the accuracy of your trades.
With consistent practice and experience, you’ll become better at interpreting Bollinger Bands and integrating them into your trading strategy.

Learning database trading with skytradingzone **What is Database Trading?**
Database trading involves using **databases** filled with historical and real-time market data to design trading strategies. You’ll analyze things like stock prices, trading volumes, and other financial indicators to spot patterns that might suggest future price movements.
Think of it as using **data** to inform your trades rather than just relying on intuition or news. You’re letting the **numbers speak** for themselves.
**How Does It Work?**
1. **Collect Data**:
You gather huge amounts of **historical market data** (like stock prices, volumes, economic indicators, etc.) and **real-time data** (like live stock prices and news updates). This data forms your **database**.
2. **Store Data in Databases**:
You store this data in databases that allow for **quick retrieval and analysis**. Popular databases used in trading include **SQL databases**, **NoSQL**, and **data warehouses**.
3. **Data Analysis**:
Traders use tools and algorithms to **analyze** this data. They look for patterns, correlations, or trends that can indicate when a stock is likely to go up or down.
4. **Backtesting**:
Once you’ve analyzed the data and developed a strategy, you can **backtest** it. Backtesting means running your trading strategy on historical data to see if it would have worked in the past. If the strategy performs well historically, it may be worth trying in real-life trading.
5. **Automated Trading**:
The real magic happens when you combine database trading with **algorithmic trading**. This means creating an **automated system** that places trades based on the data analysis. For example, the system could automatically buy a stock when certain conditions are met (like when a stock’s price is below its moving average).
**Key Components of Database Trading**
1. **Data Collection**
- You need access to reliable market data, like stock prices, volume, indicators, news, etc.
- **API (Application Programming Interface)**: APIs are commonly used to pull live data from sources like **Yahoo Finance**, **Quandl**, or even stock exchanges.
2. **Data Storage and Management**
- You need a structured way to **store and manage** this data. Databases help with storing large amounts of information, and tools like **SQL** or **Python libraries (e.g., pandas)** can help manipulate and analyze the data.
3. **Data Analysis and Algorithm Development**
- Once the data is collected, it’s all about **finding patterns** or correlations. Traders can use machine learning, statistical analysis, or even AI to make predictions based on historical trends.
- **Popular analysis tools**: **Python**, **R**, and **Matlab** are widely used for analysis. They help you build models that predict market trends or identify arbitrage opportunities.
4. **Backtesting**
- Before going live with your strategy, you backtest it against historical data to ensure it’s profitable and safe. This helps you see whether your algorithm works in different market conditions (bullish, bearish, or sideways).
5. **Automated Trading Systems**
- Once you're confident with the strategy, you can use automated trading systems or **bots**. These systems can automatically place trades based on the rules you’ve programmed.
**Why is Database Trading Important?**
1. **Speed and Efficiency**:
Database trading allows you to make **faster decisions** than a human trader could, especially when combined with automated trading. The system can analyze data and execute trades in milliseconds.
2. **Data-Driven Decisions**:
Instead of relying on guesses or emotions, you’re making decisions based on hard data. This increases your **chances of success** and helps you avoid costly mistakes.
3. **Backtesting and Optimization**:
You can backtest your strategies, meaning you can test them on historical data before using real money. This gives you a lot of confidence in the strategy.
4. **Scalability**:
Once you’ve developed a successful database trading strategy, you can scale it easily. You can start trading small amounts, and as you gain experience, increase your trading volume with minimal risk.
**Example of a Simple Database Trading Strategy**
Let’s say you want to create a strategy that buys a stock if:
1. The stock price is above its **200-day moving average** (indicating it’s in an uptrend).
2. The **relative strength index (RSI)** is below 30 (indicating it might be oversold and due for a bounce).
You would:
1. **Collect historical stock price data** for the last year.
2. Use **SQL** or a **Python script** to compute the 200-day moving average and the RSI for each stock.
3. **Backtest** the strategy to see if it would have worked in the past.
4. Once you’re confident it’s a solid strategy, you can **automate** it to trade for you.
**Tools Used in Database Trading**
- **Databases**: SQL, NoSQL, MongoDB
- **Programming Languages**: Python, R, JavaScript
- **Libraries/Frameworks**: Pandas, NumPy, TensorFlow (for machine learning), scikit-learn
- **Backtesting Platforms**: QuantConnect, Backtrader
- **Automated Trading Platforms**: MetaTrader, Interactive Brokers API
**Conclusion**
Database trading allows you to make **data-driven** decisions rather than relying on gut feelings. By leveraging data analysis, backtesting, and automated trading systems, you can develop strategies that are more **efficient** and **profitable**.

Mastering the Double Top Pattern: A Guide to Profitable Trades!Hello everyone! I hope you're all doing great in life and in your trading journey. Today, I bring an educational post on Double Top Pattern —a crucial chart pattern that every trader must understand. Whether the market is rising or falling, recognizing key patterns like the Double Top can make all the difference in your trading success. Let’s break down how to spot it, trade it, and the opportunities it provides!
What is the Double Top Pattern?
Double Top is a bearish reversal pattern that typically forms after an uptrend. It consists of two distinct peaks at roughly the same price level, followed by a decline as the price fails to break through resistance. This is your cue that the market could be ready for a downtrend.
Identifying the Double Top Pattern
Peak 1 & Peak 2:
The first and second peaks should be nearly identical in price, signaling that the market is struggling to break through a certain resistance level.
Neckline:
The line connecting the lowest point between the two peaks. This is crucial because once the price breaks this level, the Double Top pattern is confirmed.
Volume Analysis:
Watch for decreasing volume during the formation of the second top and an increase in volume when the price breaks the neckline. This volume confirmation is key to spotting a reliable breakout.
How to Trade the Double Top?
Entry Point:
Once the price breaks below the neckline (support), this signals the start of the downtrend, making it the ideal point to enter a short position.
Stop Loss:
Protect yourself by placing a stop loss just above the second peak. This will shield you from potential false breakouts and unexpected reversals.
Target 1 (First Target):
Measure the distance between the peaks and the neckline. The same distance can be projected downward from the breakout point to estimate the first price target.
Target 2 (Second Target):
A secondary target can be calculated by extending the projection of the first target or using additional tools like Fibonacci retracements to set more precise exit points.
Key Takeaways for Success:
Volume Matters: A valid Double Top pattern is confirmed when the price breaks the neckline with strong volume.
Don’t Ignore Confirmation: Use indicators like RSI or MACD to back up the pattern. A confirmed downtrend ensures higher chances of success.
Trend Context is Crucial: Double Tops are most effective after a strong uptrend. The market's general trend should support a bearish reversal for the pattern to be reliable.
Example: A Double Top in Action
In the chart above, we can see a textbook example of the Double Top pattern. The price hits resistance twice and then breaks the neckline, signaling a potential bearish move. Keep an eye on the volume spikes and adjust your entry/exit strategy accordingly.
Ready to Trade the Double Top?
Make sure to look for the right conditions, and practice your strategy with a demo account before trading live. The Double Top can be a highly profitable setup when traded with patience and discipline!
If you found this post helpful, don’t forget to hit the like button!
Feel free to drop a comment with your thoughts or experiences regarding the Double Top pattern. Have you traded it before? How did it work for you? Let’s discuss and share insights!

what is database trading and how to do it ???Trading data is a sub-category of financial market data. It provides real-time information about stock and market prices as well as historical trends for assets such as equities, fixed-income products, currencies and derivatives.
A Proven Process for Trading Economic Data
Step 1: Establishing the Baseline. Start by understanding the macroeconomic context. ...
Step 2: Analyzing the Surprise Factor. Beyond median forecasts, consider the range of expectations. ...
Step 3: Considering Pre-Positioning and the Bigger Picture.

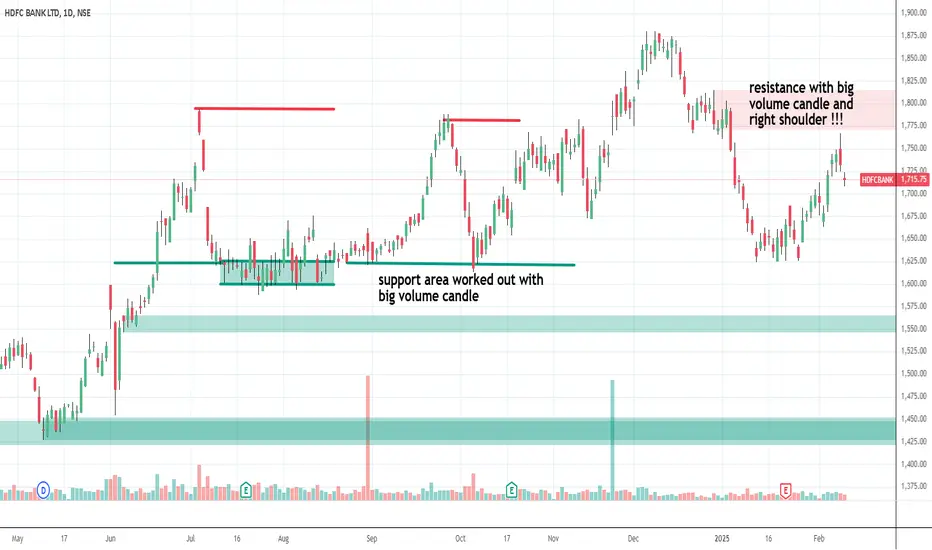
HDFC Bank - Exit with profitsHDFC bank was number 1 safe investments with sure profits due to MSCI money flow, It worked out well. support area with big volume candle given second opportunity to enter long. But now price is forming right shoulder for head and shoulder pattern and price is below resistance area with same big volume candle indicating bearish view now. It might re test support and based on action at previous support only we can say will price rise or not again. so its better to book profits and stay away from HDFC for now.
HDFC BANK LIMITED set to move upHDFC bank limited is having support at multiple timeframe and consolidating for some time.
looks good to buy cmp with sl below 1600.

HDFC BANK 7% gain in next 2,months,if hdfc March qtr result is good compare to Dec qtr, hdfc will move for 7% gain

HDFC Bank target 2000?HDFC Bank trading in a channel
Price bounce from lower channel
RSI Bullish divergence at support/demand level
Daily RSI crosses 50
ADX suggesting bullish strength
In case RBI policy announces Interest Rates cuts, HDFC is expected to benefit and do well.

MACD Trading #Technical AnalysisMACD measures the relationship between two EMAs to indicate momentum and potential trade reversals, while the RSI seeks out overbought and oversold conditions by evaluating recent price action. These indicators are often used together to give analysts a more complete technical picture.
The MACD is a technical indicator designed to help traders and investors identify and time potential buy and sell opportunities. The MACD displays moving averages and a histogram to identify trends and measure their momentum.

Database TradingIt comes with limited downside risk, making it a safer investment than futures or margin trading. In addition, option trading can be more complex than other financial instruments, as it requires traders to have a good understanding of the underlying asset and market conditions.
Yes, you can make a lot of money, or lose a lot of money, trading options. Options provide a leveraged payoff on some underlying asset, such a stock. Below are the basics and some points to be aware of. The prices of options are based on the movement of some underlying asset, often stocks.

Database Option Trading Options are highly sensitive to market volatility. Significant price swings can lead to substantial gains or losses. A trader might buy a put option expecting a stock to drop. If the stock instead surges in price due to unforeseen events, the value of the put option plummets.
Call options give buyers the right, but not the obligation, to buy a stock for a fixed price, on or before some date. Buying call options on a stock can be more profitable — but also more risky in percentage-change terms — than buying that stock itself.

TradingOne of the most effective ways of studying is to carve space out between sessions. If you break up your study load over several days, you'll retain information far more readily than if you crammed it into your head during one long session.
Day trading and swing trading are two very different approaches to short-term investing. If you're more interested in an exciting, higher-risk environment that requires greater attention, day trading is better for you. Otherwise, the slower, more methodical path of swing trading might be a better option.

"HDFC Bank: Holding Steady in a Rangebound Market"If HDFC Bank's price stays between ₹1622 and ₹1688, it's in a rangebound phase.
Break above ₹1688? Enter a long trade.
Still within the range? Wait for a clear breakout.
By
Financialsako〽️

Hdfc BankFor ItechnIndia more than anyone else....... Before you type or suggest to anyone..... ensure you have your RIDERS ready with you..... From the High of 1880 odd to the Low of 1624..... marks a complete wave, wherein..... from high to low does not mean you BUY for Gods sake.... you 1st let it sustain above 50% retracement atleast. The damn price has'nt even crossed above 1684 which is the minimum 23.6% retracement from high to low .............. AND YOU WANT PEOPLE TO BUY ??????????????????????????? WHAT IS THE BASIS OF SUCH ANALYSIS ??????

Lecture For Option Trader or Intraday TraderIntraday trading, also known as day trading, means buying and selling stocks on the same day to profit from price changes. Traders need to close their trades before the market closes. If not, the broker might automatically close them or turn them into regular trades.
Yes, profits from intraday trading are considered business income and taxed according to your income tax slab. How is intraday trading taxed? Intraday trading profits are treated as short-term capital gains, added to taxable income, and taxed based on applicable slab rates.

27/01/2025 HDFCBank ON Support LineFirst time 10/01/2025 hit this support line . last 15 dayes hdfcbank trade support line near
today also no brekdown .

HDFC Bank Oversold with Strong Support Levels Topic Statement: HDFC Bank's 3% QoQ profit growth has been overshadowed by its oversold stock price, which is under the 180-day moving average but has found strong support at the 50% retracement level and the critical ₹1600 mark.
Key Points:
1. Reported a profit growth of 3% QoQ.
2. Price has received decisive support at the 50% retracement level.
3. The price point of ₹1600 is a critical support level.
4. Stock is trading below the 180-day moving average, making it oversold.

HDFC stock Buy Sell or Hold ? HDFC Bank Stock: Is It Better to Buy Before or After the Union Budget
Support and Resistance Levels for HDFC Bank Stock
Support Level:
The major support for HDFC Bank is around ₹1550.
Until the Union Budget 2025, the market and HDFC Bank stock may show some upward momentum.
For now, you can consider buying the stock with ₹1600 as a support level.
Resistance Level:
The major resistance is at ₹1770.
There is a possibility of reaching this target near the resistance level.
If a weekly candle closes above ₹1770, the stock could gain further momentum.
Post the Union Budget, if HDFC Bank holds above the major support, the stock can be held for the long term. Keep a close watch on HDFC Bank and track these critical levels.
Why Buy Before the Budget?
Chance to Gain Early: Stocks often go up before the budget due to positive market sentiment.
Why Buy After the Budget?
Better Deals: If the stock price drops after the budget, you can buy at a lower price.
#HDFCBank #StockMarket #SupportResistance #UnionBudget2025 #InvestmentTips

HDFC BANK results are out. Will this change market sentiment?The most awaited results of this earning season are here. The heavyweight HDFC Bank has announced its results and there is a clear growth seen in YoY no.s - total income, net income, net profit and PAT.
That said, there is a miss on one front. Will street ignore it or take it as a reason to continue the fall? Watch the video to find out.

view on HDFC BANKNo buy/sell reco!!
Just for education purpose!
View on HDFC BANK, trade with caution.
can consolidate in 1628-1654 range and move
upside to 1710
below 1610 target 1580-1550

hdfc bank view HDFC Bank, one of India's leading private sector banks, was established in 1994. Its origins and development reflect the transformation of India's banking sector during the 1990s, following the liberalization of the Indian economy.
### Key Milestones in HDFC Bank's History:
#### 1. **Foundation and Early Years (1994-1999)**
- **Incorporation**: HDFC Bank was incorporated in August 1994 in Mumbai, Maharashtra. It was promoted by the Housing Development Finance Corporation Limited (HDFC), India's premier housing finance company.
- **Banking License**: In January 1995, the Reserve Bank of India (RBI) granted HDFC Bank a banking license, allowing it to operate as a scheduled commercial bank.
- **IPO Launch**: In 1995, HDFC Bank went public, listing its shares on the Bombay Stock Exchange (BSE) and the National Stock Exchange (NSE). The IPO was well-received, reflecting investor confidence.
- **Early Operations**: The bank initially focused on corporate banking, capitalizing on the growing demand for professional banking services.
#### 2. **Expansion and Growth (2000-2010)**
- **Branch Network**: HDFC Bank aggressively expanded its branch network across India, establishing a strong presence in urban and semi-urban areas.
- **Technological Leadership**: The bank was among the pioneers in adopting advanced technology, offering internet banking, phone banking, and ATMs for customer convenience.
- **Merger with Times Bank**: In 2000, HDFC Bank merged with Times Bank, the first merger in the private banking sector in India. This significantly boosted its customer base and geographical reach.
- **Retail Banking Growth**: The bank expanded its focus to include retail banking, offering personal loans, credit cards, and savings accounts, gaining a diverse customer base.
#### 3. **Dominance and Diversification (2011-2020)**
- **Leadership**: Under the leadership of Aditya Puri, HDFC Bank became synonymous with stability, efficiency, and innovation. Puri served as the Managing Director from its inception until October 2020, making him the longest-serving CEO of any private bank in India.
- **Digital Transformation**: The bank introduced mobile banking apps and enhanced its digital offerings, positioning itself as a leader in digital banking.
- **Market Capitalization**: By 2020, HDFC Bank became the largest private sector bank in India by market capitalization.
#### 4. **Recent Developments (2020-Present)**
- **Leadership Change**: In 2020, Sashidhar Jagdishan succeeded Aditya Puri as the Managing Director and CEO.
- **Technological Challenges**: Despite its technological edge, the bank faced some issues with outages in digital services, prompting RBI to impose temporary restrictions on new digital launches.
- **Merger with HDFC Ltd**: In April 2022, HDFC Ltd announced a merger with HDFC Bank. This landmark deal, finalized in 2023, combined the strengths of the two entities, creating a financial services powerhouse.
### Current Status:
As of today, HDFC Bank is one of the most trusted banks in India, known for its robust financial performance, customer-centric approach, and innovative services. It operates a widespread network of branches and ATMs and continues to play a pivotal role in India's economic growth.
