Midcap & Smallcap Index Volatility1. Understanding Midcap and Smallcap Indices
Before diving into volatility, it’s important to understand what midcap and smallcap indices represent.
Nifty Midcap 100 Index: This tracks the performance of the top 100 mid-sized companies listed on NSE, ranked from 101 to 200 by full market capitalization.
Nifty Smallcap 100 Index: This tracks the next 100 companies, ranked from 201 to 300 by market capitalization.
These indices help investors monitor the performance of mid- and small-sized businesses in India — companies that are neither as large nor as stable as blue-chip giants, but often more dynamic, growing, and entrepreneurial in nature.
2. What Is Volatility?
Volatility is a measure of how much and how quickly the price of a stock or index moves over a period of time. In simple words, it reflects the degree of price fluctuation.
High volatility: Prices move sharply up or down within short periods.
Low volatility: Prices move gradually or remain relatively stable.
For example, if the Nifty Midcap 100 rises 2% one day, falls 3% the next, and rises 4% the following day, it’s showing high volatility. In contrast, the Nifty 50 (large-cap) might move only ±0.5% on average during the same period.
Volatility can be historical (based on past price movements) or implied (based on expectations embedded in options pricing). In this explanation, we focus mainly on historical and structural volatility of midcap and smallcap indices.
3. Why Midcap and Smallcap Indices Are More Volatile
There are several reasons why these segments show higher volatility than large caps:
(a) Liquidity Constraints
Midcap and smallcap stocks are often less liquid, meaning fewer buyers and sellers trade them compared to large caps. As a result, even small trading volumes can lead to large price swings.
For instance, a ₹10 crore order might barely move Reliance Industries’ price but can cause a 5–10% jump or fall in a smallcap company.
(b) Limited Institutional Participation
Large-cap stocks attract foreign institutional investors (FIIs) and domestic mutual funds due to their size, governance, and liquidity. Midcaps and smallcaps, however, often have limited institutional coverage.
This means retail sentiment can heavily influence prices, increasing volatility.
(c) Business Fragility
Smaller companies generally face higher business risks — such as dependence on fewer products, markets, or clients. During economic slowdowns, their earnings can decline sharply, which directly reflects in stock prices.
(d) Information Asymmetry
Midcap and smallcap companies often have limited analyst coverage, and information about their operations, financials, or management decisions may not be widely available.
This creates uncertainty, and uncertainty breeds volatility.
(e) Retail and Momentum Trading
Retail traders dominate the smallcap segment, and many of them chase momentum rather than fundamentals. When stocks rally, more traders jump in, fueling a sharp rise; when prices fall, panic selling intensifies — both driving up volatility.
4. Historical Perspective of Midcap & Smallcap Volatility
Over the past decade, Indian midcap and smallcap indices have displayed cycles of extreme outperformance followed by deep corrections. Let’s look at key phases:
(i) 2014–2017: The Bull Run
Post the 2014 general elections, midcaps and smallcaps experienced a historic rally.
Economic optimism, policy reforms, and liquidity inflows lifted investor confidence.
Between 2014 and 2017, the Nifty Midcap 100 delivered over 100% returns, and the Smallcap 100 gained more than 120%.
However, this sharp rise came with high volatility — daily swings of 1.5–3% were common.
(ii) 2018–2019: Sharp Correction
After years of outperformance, valuations became stretched.
Rising interest rates, liquidity concerns, and corporate defaults triggered a massive correction.
The Smallcap index fell over 30–40% from its peak, while the Midcap index dropped around 25–30%.
This period highlighted the downside volatility risk of small companies.
(iii) 2020: Pandemic Crash and Recovery
The COVID-19 crash in March 2020 wiped out years of gains in weeks. The Smallcap index fell over 45% in less than a month.
However, when liquidity flooded the market later in 2020–21, these same indices rebounded dramatically — doubling or tripling in value.
This shows how midcap and smallcap volatility cuts both ways — losses and gains.
(iv) 2023–2024: New Volatility Phase
Post-2023, the Indian smallcap and midcap segments once again became hot due to strong retail inflows, mutual fund SIPs, and manufacturing revival themes.
But by mid-2024, SEBI and AMFI began cautioning investors about overheated valuations, leading to bouts of profit booking and corrections — clear signs of rising volatility again.
5. Measuring Volatility
Volatility can be quantified using several metrics:
(a) Standard Deviation
It measures how much daily returns deviate from the average return.
A higher standard deviation means higher volatility.
For example:
Nifty 50 annualized volatility: around 10–12%
Nifty Midcap 100: around 18–22%
Nifty Smallcap 100: around 24–30%
(b) Beta (β)
Beta measures how much an index moves relative to a benchmark (like Nifty 50).
Midcap index beta ≈ 1.3–1.5
Smallcap index beta ≈ 1.6–1.8
This means smallcaps move almost 1.8 times more than large caps on average.
(c) India VIX vs. Segment Volatility
While India VIX reflects volatility expectations of the Nifty 50, the implied volatility for smallcap/midcap stocks tends to be higher during uncertain or speculative phases.
6. Factors Influencing Volatility in Midcaps & Smallcaps
(a) Economic Conditions
Mid- and small-sized companies are highly sensitive to economic cycles.
When GDP growth slows or interest rates rise, these businesses often suffer earlier than large caps.
(b) Liquidity Flow
Mutual fund and retail inflows can fuel rallies; sudden outflows can trigger steep declines.
(c) Corporate Earnings
Since many midcap and smallcap companies have small profit bases, even small fluctuations in earnings can lead to big price changes.
(d) Market Sentiment
These indices are more sentiment-driven. Positive narratives like “Make in India,” “Renewable Energy,” or “Defence Manufacturing” often create sharp thematic rallies.
(e) Global Triggers
Although midcap and smallcap companies are mostly domestic-focused, global events (like oil price spikes, US Fed rate hikes, or geopolitical tensions) can still affect them via liquidity or risk appetite channels.
7. The Double-Edged Sword of Volatility
Volatility in midcap and smallcap indices isn’t inherently bad — it’s a double-edged sword.
For traders, volatility provides opportunities for quick profits. Price swings mean frequent entry and exit points.
For investors, it offers chances to buy quality companies at lower valuations during corrections.
However, volatility also brings emotional stress and the risk of large losses if one chases momentum blindly.
8. Managing Volatility – Risk Control Strategies
Here’s how traders and investors can handle volatility in midcap and smallcap segments:
(a) Diversification
Avoid concentrating too much capital in a few small stocks. Spread exposure across sectors to reduce specific risk.
(b) Staggered Investment
Use Systematic Investment Plans (SIPs) or phased buying instead of lump-sum entries to average out volatility.
(c) Quality Filter
Focus on companies with:
Strong balance sheets
Consistent earnings
Low debt-to-equity ratios
Credible management
Not all smallcaps are speculative — many future large-caps emerge from this space.
(d) Technical & Volume Analysis
Traders can use volume profile, moving averages, and support-resistance levels to gauge strength and avoid entering during euphoria or exhaustion phases.
(e) Stop-Loss Discipline
Always use predefined stop-loss levels to protect against deep drawdowns.
(f) Macro Monitoring
Keep an eye on:
RBI’s monetary policy
Inflation trends
FIIs’ flow data
Fiscal deficit
as these macro factors influence liquidity and sentiment — the lifeblood of mid/smallcap rallies.
9. Psychological Aspect of Volatility
Volatility tests not just portfolios but also patience and psychology.
When prices fall sharply, retail investors often panic and sell at lows. Conversely, when prices surge, they chase high-flying stocks at inflated valuations.
Successful participants in midcap/smallcap segments are those who:
Think long-term
Avoid herd mentality
Use volatility as a friend, not an enemy
Remember Warren Buffett’s words:
“Be fearful when others are greedy, and greedy when others are fearful.”
That advice fits midcap and smallcap investing perfectly.
10. Current Scenario (2025 Outlook)
As of late 2025, volatility in midcap and smallcap indices remains elevated due to multiple factors:
Concerns over stretched valuations
Shifts in interest rate expectations
Sector rotations between infrastructure, renewables, and financials
Heavy retail participation via smallcap mutual funds and direct trading
Regulatory bodies like SEBI and AMFI continue monitoring fund inflows to ensure stability. Meanwhile, many analysts suggest stock-specific investing instead of chasing the broader index, as valuations in some pockets remain high.
In short:
Volatility = Opportunity + Risk
Selectivity = Survival
11. Conclusion
Midcap and smallcap indices are the heartbeat of India’s growth story. They represent emerging leaders, innovative businesses, and fast-expanding industries. However, with high potential comes high volatility.
Key takeaways:
Midcaps and smallcaps are structurally more volatile than large caps due to liquidity, size, and sentiment factors.
Their volatility can amplify both bullish rallies and bearish corrections.
Understanding volatility helps traders time entries better and helps investors hold quality names with conviction.
Risk management, diversification, and patience are essential tools for navigating this roller coaster.
In essence, midcap and smallcap volatility is not something to fear — it’s something to respect and manage. For those who understand its rhythm, volatility becomes a powerful ally in building long-term wealth.
Trade ideas

Part 1 Candle Stick PatternOption Greeks – Measuring Risk Factors
Option traders use Greeks to analyze the sensitivity of an option’s price to various factors:
Delta: Measures the rate of change of option price relative to the underlying asset.
Gamma: Measures the rate of change of Delta itself.
Theta: Measures time decay — how much value the option loses as expiry nears.
Vega: Measures sensitivity to volatility.
Rho: Measures sensitivity to interest rates.
Understanding Greeks helps traders manage their portfolio risk effectively.

Essential Infrastructure Investment The Foundation of Sustainable Growth
Infrastructure is the backbone of any modern economy. It encompasses the fundamental systems and facilities that support a nation's economic and social well-being, such as transportation networks, energy grids, communication systems, water supply, and social amenities like healthcare and education. Investment in essential infrastructure is not merely a financial commitment; it is an investment in the future prosperity, resilience, and inclusivity of a society. In the 21st century, as global economies face the challenges of urbanization, climate change, technological transformation, and population growth, infrastructure investment has become more crucial than ever.
1. Understanding Essential Infrastructure Investment
Essential infrastructure investment refers to the allocation of capital and resources toward the development, maintenance, and modernization of basic systems that ensure the smooth functioning of an economy. These investments can be made by governments, private entities, or through public-private partnerships (PPPs). The goal is to provide long-term value by improving efficiency, connectivity, productivity, and quality of life.
Infrastructure investment can be divided into several categories:
Economic Infrastructure – Transport (roads, railways, ports, airports), energy (power plants, transmission grids), telecommunications, and water management.
Social Infrastructure – Education facilities, healthcare systems, housing, and public safety institutions.
Digital Infrastructure – Internet connectivity, data centers, cybersecurity systems, and smart city frameworks.
Green Infrastructure – Renewable energy installations, sustainable waste management, and climate-resilient urban planning.
Each category plays a vital role in creating a foundation upon which economies can grow and societies can thrive.
2. The Importance of Infrastructure Investment
The significance of investing in infrastructure can be seen from multiple dimensions — economic, social, and environmental.
a. Economic Growth and Productivity
Infrastructure fuels economic expansion by facilitating trade, mobility, and industrial development. Efficient transportation systems reduce logistics costs and time, while reliable energy supply enhances industrial output. The World Bank estimates that every 1% increase in infrastructure spending can increase GDP growth by up to 2%. Moreover, infrastructure investments generate employment opportunities during both construction and operational phases, creating a multiplier effect across various sectors.
b. Enhancing Competitiveness
Nations with advanced infrastructure attract more domestic and foreign investments. Investors are drawn to regions with reliable electricity, transport connectivity, and digital systems. For instance, well-developed logistics networks lower production costs, improving global competitiveness. This is why emerging economies like India, Indonesia, and Vietnam have prioritized infrastructure modernization to attract manufacturing and service industries.
c. Reducing Regional Inequality
Infrastructure investments can bridge regional development gaps. By improving access to transportation, communication, and education, remote areas can become economically viable. This inclusivity promotes social stability and reduces urban overcrowding. For example, rural electrification projects in Africa and Asia have dramatically improved agricultural productivity and small business growth.
d. Promoting Environmental Sustainability
Green infrastructure investments in renewable energy, waste management, and sustainable transport reduce carbon emissions and combat climate change. Building climate-resilient infrastructure — such as flood-resistant roads or water recycling systems — ensures long-term sustainability. The global push for “net-zero” emissions has made green infrastructure an essential pillar of modern economic strategy.
e. Enhancing Quality of Life
Reliable infrastructure ensures access to clean water, healthcare, and education — fundamental human rights that underpin a decent standard of living. Smart city initiatives and digital infrastructure enhance safety, convenience, and access to public services, improving the overall quality of life.
3. Key Sectors of Essential Infrastructure Investment
a. Transportation Infrastructure
Transportation is the lifeblood of commerce. Roads, highways, ports, airports, and railways connect producers to markets and people to opportunities. Countries that invest in integrated transport systems experience enhanced trade efficiency and reduced costs. For instance, China’s Belt and Road Initiative (BRI) demonstrates how massive transport infrastructure investments can foster international connectivity and trade growth.
b. Energy Infrastructure
Energy is critical for industrial development, urbanization, and modern living. Investment in power generation, transmission, and distribution systems ensures reliable access to electricity. With the shift toward renewable energy sources like solar, wind, and hydroelectric power, the energy sector has become a hotspot for sustainable infrastructure investment. Smart grids and battery storage technologies are transforming how energy is produced, stored, and consumed.
c. Water and Sanitation Systems
Water infrastructure ensures the availability and quality of water for consumption, agriculture, and industry. Investments in desalination plants, irrigation networks, and wastewater treatment facilities improve public health and agricultural productivity. Poor water infrastructure, conversely, can lead to water scarcity, disease outbreaks, and economic inefficiencies.
d. Digital Infrastructure
In the digital era, connectivity is as crucial as physical roads and bridges. High-speed internet, 5G networks, data centers, and cybersecurity systems form the backbone of digital economies. Nations investing in digital infrastructure experience exponential growth in e-commerce, fintech, and information technology sectors. For example, the expansion of broadband networks in India has empowered millions of small businesses and enabled remote education and telemedicine services.
e. Social Infrastructure
Education and healthcare facilities form the foundation of human capital development. Investments in schools, universities, and hospitals ensure a healthy, skilled workforce capable of sustaining long-term economic growth. Modern social infrastructure integrates technology — such as telehealth and online learning platforms — to increase access and efficiency.
4. Funding Models for Infrastructure Investment
Infrastructure projects require massive capital outlays, often running into billions of dollars. Several funding models exist to mobilize these resources:
Public Financing: Governments allocate budgetary resources or issue bonds to finance infrastructure projects. This model ensures public ownership but can strain fiscal budgets.
Public-Private Partnerships (PPPs): A collaborative model where private investors finance, build, and operate infrastructure projects while sharing risks and returns with the government. PPPs have been widely successful in transport and energy projects worldwide.
Private Financing: Large institutional investors, such as pension funds and sovereign wealth funds, often invest in infrastructure for long-term stable returns.
Multilateral and Development Banks: Institutions like the World Bank, Asian Infrastructure Investment Bank (AIIB), and IMF provide financing, guarantees, and technical assistance for infrastructure development in emerging economies.
5. Challenges in Infrastructure Investment
Despite its importance, infrastructure investment faces several challenges:
a. Financing Gaps
The global infrastructure financing gap is estimated at over $15 trillion by 2040. Many developing nations struggle to attract sufficient capital due to fiscal constraints, political instability, or lack of investor confidence.
b. Regulatory and Bureaucratic Hurdles
Complex approval processes, land acquisition disputes, and corruption can delay projects and escalate costs. Transparent governance and streamlined regulatory frameworks are essential for project success.
c. Technological Obsolescence
With rapid technological advancement, infrastructure systems can quickly become outdated. Therefore, investments must incorporate flexibility and scalability to adapt to new technologies.
d. Environmental and Social Concerns
Large infrastructure projects can have negative environmental and social impacts, such as displacement, deforestation, or pollution. Sustainable and inclusive planning is necessary to minimize such effects.
e. Maintenance and Lifecycle Costs
Many countries focus on building new infrastructure but neglect maintenance, leading to deterioration and inefficiency. Regular upkeep and modernization are vital to maximize the lifespan of assets.
6. Emerging Trends in Infrastructure Investment
a. Green and Sustainable Infrastructure
Governments and investors are increasingly prioritizing projects that align with environmental, social, and governance (ESG) principles. Renewable energy, electric vehicle infrastructure, and sustainable housing are at the forefront of this shift.
b. Smart Infrastructure
Integration of technology such as AI, IoT, and big data enables “smart” infrastructure — intelligent systems that monitor, manage, and optimize resources in real time. Smart grids, smart transportation systems, and smart cities represent the future of infrastructure investment.
c. Resilient Infrastructure
With climate risks on the rise, resilience has become a key investment criterion. Infrastructure must withstand extreme weather events, earthquakes, and other disruptions to ensure continuity of essential services.
d. Inclusive and Equitable Infrastructure
There is growing recognition of the need for infrastructure that benefits all citizens, including marginalized and rural populations. Inclusive planning ensures equal access and opportunity, supporting social cohesion.
e. Digital Transformation
Digitalization is redefining infrastructure priorities. Governments are investing in 5G, cloud computing, and cybersecurity to build the foundation for data-driven economies.
7. Case Studies: Successful Infrastructure Investments
a. Singapore
Singapore’s meticulous planning and heavy investment in infrastructure have made it one of the most efficient and competitive economies in the world. Its integrated transport systems, advanced digital infrastructure, and world-class port facilities are models for global best practices.
b. India’s Infrastructure Push
India’s National Infrastructure Pipeline (NIP) and initiatives like Gati Shakti aim to modernize transportation, logistics, and energy networks. The focus on renewable energy, highways, and digital connectivity has significantly improved economic efficiency.
c. Europe’s Green Deal
The European Union’s Green Deal allocates billions toward clean energy, sustainable transport, and digital transformation. This initiative exemplifies how infrastructure investment can drive both economic growth and environmental protection.
8. The Future of Infrastructure Investment
The future of infrastructure investment lies in integration, innovation, and inclusivity. As the world becomes more interconnected, the boundaries between physical and digital infrastructure are blurring. Future investments will emphasize:
Carbon-neutral projects and green financing,
AI-driven urban management systems,
Sustainable public transport and energy systems,
Cross-border infrastructure cooperation.
Governments, investors, and international institutions must collaborate to close the global infrastructure gap while ensuring social and environmental responsibility.
9. Conclusion
Essential infrastructure investment is more than building roads, bridges, or power plants — it is about constructing the framework for human progress. It fosters economic growth, reduces inequality, enhances resilience, and improves quality of life. As the world faces mounting challenges from climate change, digital disruption, and population pressures, strategic and sustainable infrastructure investment will determine which nations thrive in the decades ahead.
In essence, investing in infrastructure is investing in the foundation of civilization itself — ensuring that societies remain connected, productive, and prepared for the future.
Primary Market vs. Secondary Market in Indian Trading1. Introduction
Financial markets can broadly be divided into two categories: the primary market and the secondary market. These markets facilitate the trading of financial instruments such as equities, bonds, and derivatives. The primary market is the venue for raising new capital, whereas the secondary market is where existing securities are traded among investors. Both markets collectively ensure liquidity, capital formation, and price discovery in the Indian economy.
2. Primary Market
2.1 Definition
The primary market, also called the new issue market, is where companies raise capital directly from investors for the first time. This market deals with newly issued securities such as initial public offerings (IPOs), follow-on public offers (FPOs), private placements, and rights issues.
In India, the primary market is regulated by the Securities and Exchange Board of India (SEBI) to ensure transparency and protect investors’ interests.
2.2 Instruments in the Primary Market
Initial Public Offerings (IPOs)
Companies issue shares to the public for the first time to raise capital. For instance, Reliance Industries and Paytm used IPOs to generate significant funds.
Follow-on Public Offers (FPOs)
Companies that are already listed may issue additional shares to raise more capital.
Private Placements
Companies may issue securities to select institutional investors rather than the public.
Rights Issues
Existing shareholders are offered the right to purchase additional shares at a discounted price.
Debentures and Bonds
Debt instruments issued by companies or the government to raise funds for infrastructure, expansion, or operational purposes.
2.3 Functions of the Primary Market
Capital Formation
The primary market enables companies to raise funds for growth, expansion, or new projects.
Investment Opportunities
It provides investors with a chance to invest in new and potentially high-growth companies.
Economic Growth
By facilitating capital flow into productive sectors, the primary market contributes to industrial and economic development.
Government Financing
Government bonds issued in the primary market help fund public projects such as roads, hospitals, and infrastructure.
2.4 Process of Primary Market Transactions
Company Decision: The company decides to raise funds.
Appointment of Intermediaries: Merchant bankers, underwriters, and registrars are appointed.
Drafting Prospectus: A document outlining financials, risks, and objectives is prepared.
SEBI Approval: SEBI reviews the prospectus to ensure compliance.
Marketing and Subscription: Investors apply for securities through brokers or online platforms.
Allotment: Securities are allocated, and funds are transferred to the company.
Example: The 2023 IPO of Nykaa, a prominent e-commerce platform in India, followed this exact process to raise funds from retail and institutional investors.
2.5 Advantages of the Primary Market
Direct funding for companies without depending on loans.
Offers investors early-stage opportunities.
Encourages entrepreneurship and innovation.
Helps governments fund public projects efficiently.
2.6 Disadvantages of the Primary Market
Investment risk is higher due to uncertainty about new companies’ performance.
Time-consuming regulatory procedures.
Limited liquidity until shares are listed on a secondary market.
3. Secondary Market
3.1 Definition
The secondary market is where previously issued securities are traded between investors. Companies do not receive funds in this market; instead, it provides liquidity and enables price discovery for existing shares, bonds, or other financial instruments.
In India, secondary markets include stock exchanges like the NSE (National Stock Exchange) and BSE (Bombay Stock Exchange), where millions of investors trade daily.
3.2 Instruments in the Secondary Market
Equities (Shares of listed companies)
Debentures (Corporate and government bonds)
Mutual Funds
Derivatives (Options, futures, swaps)
Exchange-Traded Funds (ETFs)
3.3 Functions of the Secondary Market
Liquidity
Investors can easily buy and sell securities, providing an exit route from investments made in the primary market.
Price Discovery
Market forces of demand and supply determine the price of securities.
Investor Confidence
A transparent and regulated secondary market builds trust, encouraging more investment in the primary market.
Economic Indicator
The performance of stock exchanges reflects the economic health of the country.
3.4 Participants in the Secondary Market
Retail Investors
Individual investors trading through brokers or online platforms.
Institutional Investors
Mutual funds, insurance companies, banks, and foreign institutional investors (FIIs).
Brokers and Dealers
Facilitate trading and provide liquidity to the market.
Market Makers
Ensure constant buying and selling of securities to stabilize markets.
3.5 Advantages of the Secondary Market
Provides liquidity and flexibility to investors.
Encourages wider participation in capital markets.
Helps companies monitor investor sentiment.
Supports fair pricing of securities through continuous trading.
3.6 Disadvantages of the Secondary Market
Market volatility can lead to financial loss.
Prices may be influenced by speculation rather than fundamentals.
Requires active monitoring and knowledge to trade effectively.
4. Interaction Between Primary and Secondary Markets
The two markets are complementary. Funds raised in the primary market are invested in productive assets, while the secondary market ensures liquidity and provides investors with an avenue to exit their investments. A well-functioning secondary market encourages more participation in IPOs and other primary market instruments, creating a virtuous cycle of investment and growth.
Example in India: The IPO of Zomato in 2021 saw significant investor interest because investors knew they could sell shares on the NSE or BSE after listing.
5. Regulatory Framework in India
SEBI (Securities and Exchange Board of India) regulates both markets. Its responsibilities include:
Ensuring transparency and disclosure.
Protecting investors’ interests.
Approving IPOs and monitoring listings.
Regulating trading practices in the secondary market.
The Companies Act 2013 also governs corporate governance and disclosure norms for firms raising capital.
6. Current Trends in Indian Markets
Digital Platforms: Online trading and mobile apps have increased retail participation in both markets.
IPO Frenzy: High-growth startups are increasingly opting for public listings to raise funds.
Institutional Dominance: FIIs and domestic institutional investors drive volumes in secondary markets.
Derivatives Growth: Futures and options trading have become significant in India’s NSE and BSE markets.
Conclusion
The primary and secondary markets are essential pillars of the Indian financial system. The primary market enables companies to raise capital and supports economic growth, while the secondary market provides liquidity, facilitates price discovery, and instills investor confidence. Both markets are interconnected, and their smooth functioning is crucial for the stability and development of India’s capital market.
A robust understanding of these markets helps investors make informed decisions and allows companies to leverage capital efficiently, driving India toward sustained financial and economic growth.

Part 11 Trading Master ClassRisks in Option Trading
While options offer opportunities, they also carry risks:
Time Decay: The value of options reduces as expiry approaches.
Complexity: Requires good understanding and experience.
Unlimited Loss Potential (for Sellers): Option writers can face huge losses if the market moves against them.
Volatility Risk: Sudden market changes can make options lose value quickly.

HDFCBANKWhen you work on the candles of the time cycle , you will understand the why price action and support resistance not work every time.
And whenever you see support and resistance or price action forming on the time cycle candle, you start to feel dizzy. What amazing thing are you seeing? This is the beauty of Time cycle Candle.
I have told many times that a time cycle is created by taking a high to high, low to low, or high to low and low to high. This means that as soon as a cycle ends, a reversal is possible.
But this doesn't happen all the time.
Today I am presenting before you the HDFC Bank chart with its time cycle.(69 Bar/98 Days)
You all know how important HDFC Bank is for Bank Nifty, if you want you can use in the same time cycle Bank Nifty also.
Oh yes, don't forget to give feedback.

Positional Trading vs Swing Trading in India1. Definition and Core Concept
Positional Trading:
Positional trading, also known as position trading, is a medium-to-long-term trading strategy where traders hold securities for weeks, months, or even years. The core idea behind positional trading is to capitalize on major market trends rather than short-term price fluctuations. Traders analyze fundamental and technical aspects of a stock, commodity, or index to make decisions. Once a position is established, it is maintained until the market trend reverses or the target price is reached.
Swing Trading:
Swing trading, in contrast, is a short-to-medium-term strategy that focuses on capturing price “swings” within an overall trend. Swing traders typically hold positions for several days to a few weeks. The goal is to exploit market momentum and short-term price patterns using technical analysis, chart patterns, and indicators. Swing trading sits between intraday trading, which operates within a single day, and positional trading, offering a balance between time commitment and potential profitability.
2. Time Horizon
Time horizon is one of the defining differences between these two strategies.
Positional Trading: Positions are held for weeks, months, or even years. For example, a positional trader may buy shares of Reliance Industries based on its long-term growth prospects and hold until a significant price target is achieved or the fundamentals deteriorate.
Swing Trading: Positions are generally held from a few days to several weeks. For instance, a swing trader may capitalize on a bullish breakout in Tata Motors over the next 10–15 days and exit once the swing completes or momentum wanes.
In India, positional trading is ideal for investors who cannot monitor markets daily but want to benefit from long-term trends. Swing trading suits those who can check charts and news frequently but do not wish to engage in the daily grind of intraday trading.
3. Analytical Approach
The analytical methods used in these strategies differ significantly.
Positional Traders often rely on:
Fundamental Analysis: Evaluating financial statements, earnings growth, macroeconomic factors, and industry performance to determine long-term potential. For example, analyzing HDFC Bank’s balance sheet and loan portfolio to decide on a multi-month investment.
Technical Analysis: Using daily, weekly, and monthly charts to identify long-term trends, support/resistance levels, and moving averages. Indicators like MACD, RSI, and trendlines help in deciding entry and exit points.
Economic Indicators: Considering inflation, GDP growth, RBI monetary policies, and global factors influencing Indian markets.
Swing Traders primarily focus on:
Technical Patterns: Identifying chart formations like flags, triangles, head-and-shoulders, and double tops/bottoms that indicate potential price swings.
Momentum Indicators: Using RSI, stochastic oscillators, and MACD to time entries and exits.
Volume Analysis: Recognizing breakout points or reversals by tracking trading volumes.
News Catalysts: Reacting to quarterly earnings, policy announcements, or corporate developments that can trigger short-term price movements.
4. Risk and Reward Profile
Risk management varies with timeframes.
Positional Trading:
Pros: Reduced impact of daily volatility; focus on long-term trends often aligns with fundamental growth; lower trading costs due to fewer transactions.
Cons: Requires patience; positions can be exposed to overnight or gap-up/down risk; capital may be locked for extended periods.
Risk Management: Stop-loss levels are usually wider, placed beyond typical market noise, to avoid premature exits. Risk-reward ratios are typically 1:3 or higher, emphasizing substantial profit potential.
Swing Trading:
Pros: Potentially higher returns in shorter periods; more flexibility to adjust positions based on market movement; capital turnover is faster.
Cons: More frequent monitoring is required; exposure to short-term volatility and false breakouts; trading costs can accumulate due to frequent transactions.
Risk Management: Tighter stop-loss orders are essential; traders often employ risk-reward ratios of 1:2 or 1:3. Trailing stops are frequently used to lock in profits during upward swings.
5. Capital and Margin Requirements
Positional Trading: Typically requires higher capital per trade due to holding larger positions for extended periods. Brokers may allow delivery-based buying on margin, reducing the need for full upfront capital.
Swing Trading: Requires moderate capital since trades are shorter and can be leveraged via intraday or short-term derivative positions in Nifty, Bank Nifty, or stock futures. This can amplify both profits and losses.
In India, retail traders often use equity delivery for positional trades and equity derivatives or cash segments for swing trades to optimize returns.
6. Trading Frequency and Transaction Costs
Transaction costs influence net profitability in both strategies:
Positional Trading: Lower trading frequency reduces brokerage and taxes. Long-term capital gains (LTCG) tax in India applies if shares are held over a year, currently at 10% on gains exceeding ₹1 lakh, making it tax-efficient.
Swing Trading: Frequent trading attracts higher brokerage and short-term capital gains (STCG) tax at 15%, increasing the need for disciplined risk management to maintain net profitability.
7. Tools and Platforms
Both strategies benefit from advanced trading platforms and research tools:
Positional Trading: Traders rely on fundamental research portals like Moneycontrol, Screener.in, or brokerage research reports for stock selection. Charting platforms like TradingView, Zerodha Kite, or Upstox Pro assist with technical analysis.
Swing Trading: Swing traders focus heavily on real-time charts, pattern recognition tools, and intraday momentum indicators. Brokers providing robust charting, market scanners, and alerts, like Zerodha, Angel One, and Sharekhan, are preferred.
Automation through alerts and conditional orders can also benefit swing traders in executing trades at precise levels without constant screen monitoring.
8. Psychological and Emotional Considerations
Positional Trading: Requires patience and discipline to withstand short-term volatility. Traders must trust their analysis and avoid reacting impulsively to market noise. Psychological stress is lower due to longer decision intervals.
Swing Trading: Demands quicker decision-making, adaptability, and the ability to handle frequent market fluctuations. Emotional control is critical to prevent losses from panic exits or impulsive trades.
9. Market Conditions Favoring Each Strategy
Positional Trading: Works well in trending markets where the overall direction aligns with fundamental or technical signals. In India, sectors like IT, FMCG, and Banking often present long-term opportunities.
Swing Trading: Performs best in volatile or range-bound markets where short-term price swings are prominent. Momentum-driven stocks, commodities like crude oil, and indices such as Nifty or Bank Nifty are popular for swing trades.
10. Examples in Indian Markets
Positional Trade Example:
Buying Infosys shares in anticipation of long-term IT sector growth post-digitalization trends. Holding over 6–12 months allows traders to capture earnings-driven appreciation.
Swing Trade Example:
A trader identifies a bullish breakout in Tata Steel over 5–10 trading sessions based on volume surge and MACD crossover, aiming for quick gains before short-term resistance levels are hit.
These examples highlight how the strategies adapt to different risk profiles and investment horizons.
11. Combining Both Strategies
Many Indian traders combine positional and swing trading to diversify strategies:
Core-Portfolio (Positional): Long-term holdings in fundamentally strong companies for steady wealth creation.
Satellite-Portfolio (Swing): Short-term trades in volatile stocks or derivatives to boost overall returns.
This approach balances the stability of long-term investing with the agility of short-term opportunities.
12. Conclusion
In India, both positional and swing trading have unique advantages and challenges. Positional trading suits investors seeking long-term wealth creation, less daily stress, and reliance on fundamentals. Swing trading appeals to active traders aiming to capitalize on short-term price movements and market momentum.
Key differences can be summarized as follows:
Feature Positional Trading Swing Trading
Time Horizon Weeks to years Days to weeks
Analysis Fundamental + Technical Primarily Technical
Risk Exposure Moderate, long-term trends Higher, short-term volatility
Capital Requirement Higher, larger positions Moderate, frequent turnover
Transaction Costs Lower Higher
Emotional Stress Lower Higher
Ideal Market Trending markets Volatile/range-bound markets
Successful traders in India often tailor strategies to their risk tolerance, time availability, and market conditions. Positional trading provides stability and capital growth, while swing trading offers flexibility and rapid returns. Understanding both strategies allows traders to navigate the dynamic Indian market effectively, optimize profits, and manage risk efficiently.
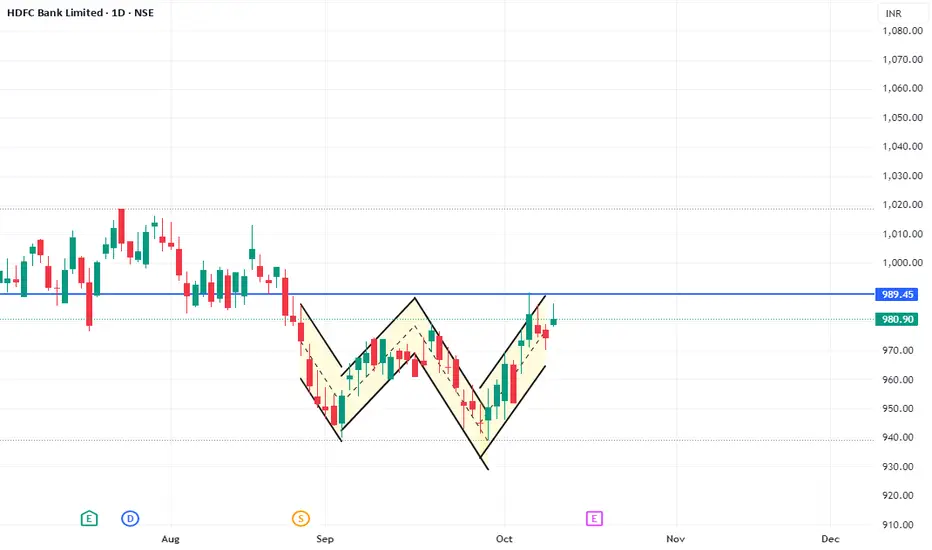
HDFC BANK Structure Analysis & Trade PlanThe chart for HDFC Bank Ltd. (HDFCBANK) on the Daily timeframe exhibits a clear "W" formation, which is a classic Double Bottom Reversal Pattern. This pattern suggests that the prior downtrend, which led to the two bottoms, is likely to reverse to an uptrend.
Pattern: Double Bottom / 'W' Pattern.
Timeframe: Daily.
Confirmation Level (Neckline): The crucial confirmation level, or Neckline, is around the ₹989.45 mark (indicated by the blue horizontal line). This is the highest point between the two bottoms.
Market Structure Shift (MSS): A confirmed Market Structure Shift (MSS) to the upside would occur upon a decisive close and sustained breakout above the Neckline of ₹989.45. This breakout would validate the reversal pattern.
Price Action: The price has successfully formed the second trough and has now rallied back up to test the Neckline.
Setup
Bullish Breakout of Double Bottom Pattern
Entry Condition (Long)
A confirmed closing candle (Daily) ABOVE the Neckline at ₹989.45. A re-test of the broken Neckline after the close offers a potentially safer entry.
Confirmation Level (MSS)
₹989.45
Stop Loss (SL)
Place the stop loss below a recent swing low or the midpoint of the last leg up. A good conservative level would be just below the high of the 'M' peak of the second bottom's rise, potentially around ₹975 or a more aggressive placement just under the recent swing low before the neckline challenge.
Target 1 (T1)
The minimum measured move is equal to the distance from the bottoms to the neckline, projected upwards.
Target 1 Calculation
Neckline (₹989.45) - Lowest Bottom (approx. ₹935) = ₹54.45
Target 1 = ₹989.45 + ₹54.45 = ₹1044
Target 2 (T2)
Look towards the previous swing highs around ₹1020 - ₹1030 as an intermediate zone, and then the top of the range before the current pattern started, around ₹1060 for the second target.
Risk Management & Caveats
False Breakout: Wait for a clear daily closing price above ₹989.45. A quick wick above the level that closes below it is a potential trap.
Volume Confirmation: Ideal confirmation should be accompanied by higher-than-average volume during the breakout, signifying strong institutional interest.
Failure: If the price rejects the Neckline severely and breaks below the second bottom's low (around ₹935), the bullish pattern is invalidated, and the downtrend would likely resume.
HDFC Bank: Expanded Flat Unfolding Near Double-Top ZoneAfter a clean five-wave advance from ₹681.80 to ₹1,018.85, HDFC Bank appears to be tracing a textbook expanded flat correction.
Wave Structure
Wave 4 unfolded as a triangle, setting the stage for a channeled Wave 5 that topped at ₹1,018.85.
The subsequent decline to ₹940 formed Wave A, and the sharp rebound to ₹1,020 marks a classic B-wave retest of the prior high — effectively a double-top zone.
Wave C could now stretch toward the 0.5–0.618 retracement cluster (₹850–₹810) — an area also highlighted by the Visible Range Volume Profile (VRVP) as the highest liquidity pocket.
Volume Check & Market Tone
The VRVP shows thinning participation above ₹940 and a heavy node between ₹850–₹810 — implying that the real acceptance zone lies lower. This adds weight to the bearish bias for Wave C.
Fundamental Backdrop
Interestingly, the company reported a 10 % rise in Q2 profit, yet the stock closed flat near ₹1,003. While the headline looked positive, reported EPS (₹6.82) missed analyst expectations (₹11.29) by a wide margin, tempering sentiment. The price action reflects that disconnect — optimism capped by underwhelming earnings quality.
Summary
Expanded flat unfolding near a double-top zone, with price likely gravitating toward the ₹850–₹810 confluence before any meaningful base formation.
Disclaimer: This analysis is for educational purposes only and does not constitute investment advice. Please do your own research (DYOR) before making any trading decisions.

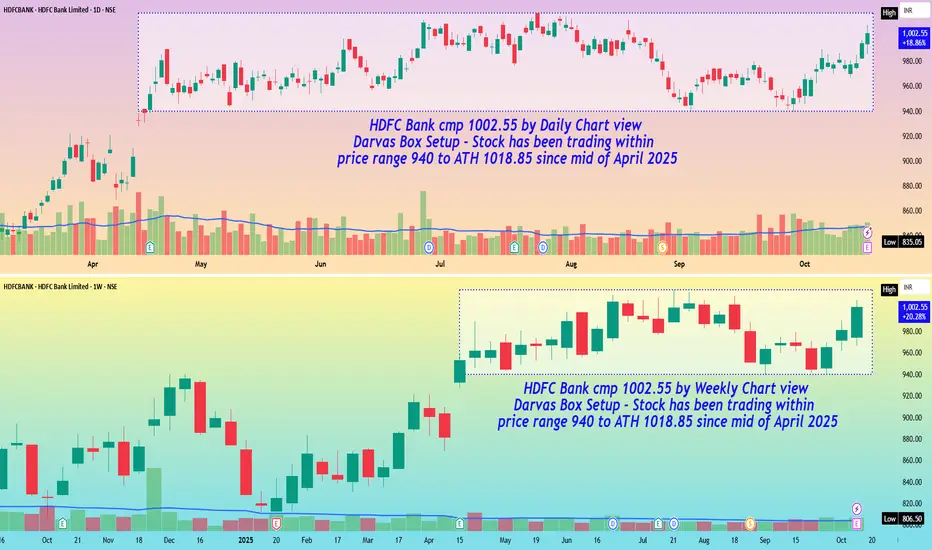
HDFC Bank cmp 1002.55 by Daily and Weekly Chart viewHDFC Bank cmp 1002.55 by Daily and Weekly Chart view
- Darvas Box Setup : Stock has been trading within price range 940 to ATH 1018.85 since mid of April 2025
- Stock chart has made Bullish Rounding Bottoms on both timeframes providing a technically logical upside target of +/- 1100 in the near future
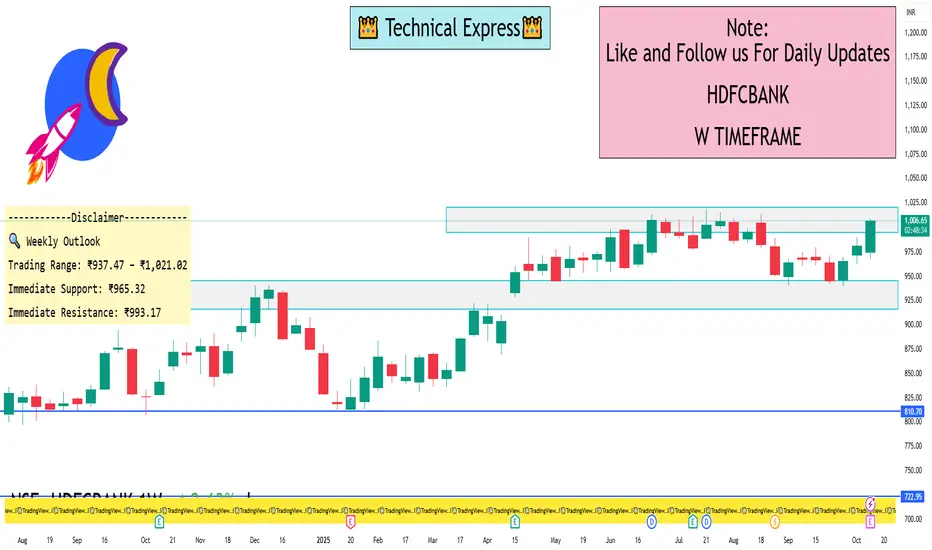
HDFC Bank 1 Week View 📈 Key Technical Levels for the Week
Resistance Levels:
R1: ₹1,005.43
R2: ₹1,021.02
R3: ₹1,034.00
Support Levels:
S1: ₹965.32
S2: ₹949.73
S3: ₹937.47
A close above ₹1,005.43 could indicate a breakout, while a drop below ₹965.32 may signal a potential reversal.
📊 Technical Indicators
RSI (14): 77.88 — Overbought, suggesting potential for a pullback.
MACD: Positive, indicating bullish momentum.
CCI: 202.29 — Overbought, aligning with the RSI reading.
ADX: 32.18 — Bullish trend strength.
The stock is trading above its 20-day and 50-day moving averages, indicating a bullish trend.
🔍 Weekly Outlook
Trading Range: ₹937.47 – ₹1,021.02
Immediate Support: ₹965.32
Immediate Resistance: ₹993.17
A close above ₹1,005.43 could lead to further gains, while a close below ₹965.32 may suggest a bearish reversal.
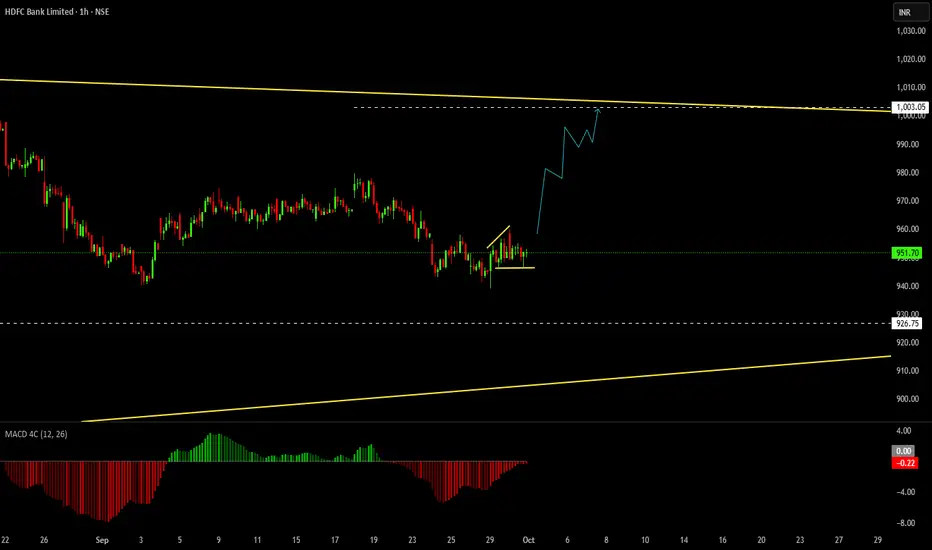
Trade Set UpThe pattern visible suggests , its heading for one more move up
This forecast is based on 3 Stroke Move ,
This is education content
Good luck
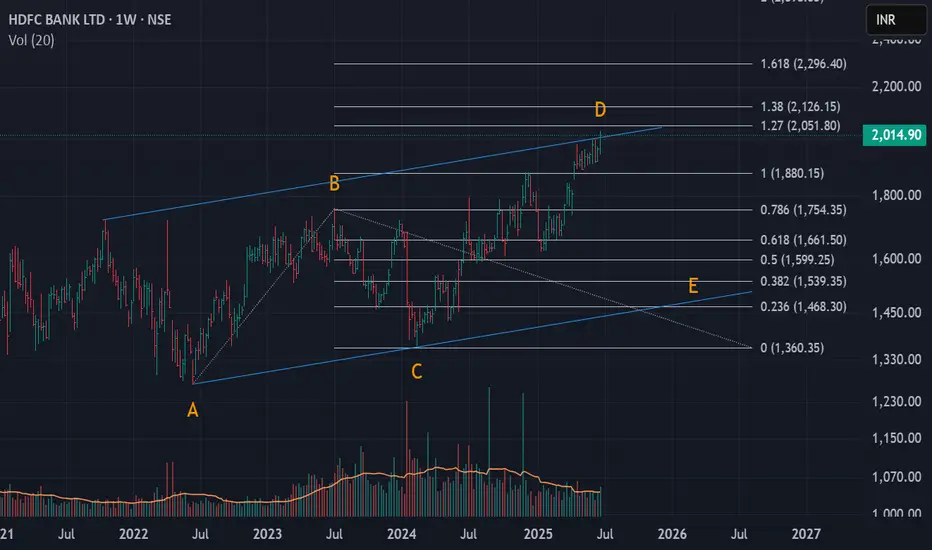
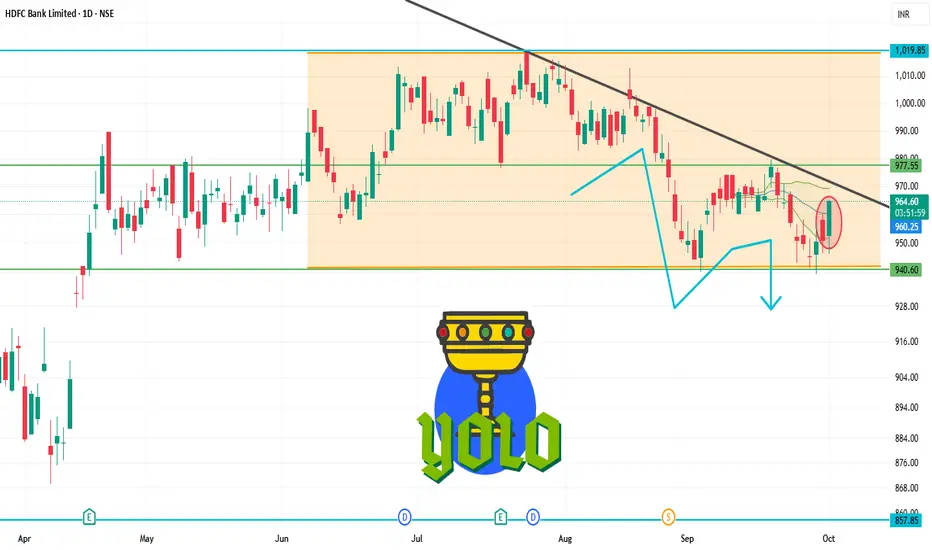
HDFCBANK | Entering Downwards correctionHDFCBANK seems to be completing wave D.
After that wave E will follow on the downside.
Will keep you guys posted once we have entered Wave E
PCR Trading StrategiesPricing and Premiums:
The price of an option, called the premium, is influenced by several factors: the underlying asset’s price, the strike price, time until expiration, volatility, and interest rates. Options with a longer duration or higher volatility generally have higher premiums. The premium is essentially the cost of controlling the asset without owning it outright. For buyers, the premium is the maximum potential loss, while sellers (writers) collect it as income but take on potentially unlimited risk. Understanding how premiums change with market conditions is crucial for traders to time entries and exits effectively.

Part 6 Learn Institutional Trading Key Terminology in Option Trading
Before diving deeper, let’s understand some crucial terms used in options:
Underlying Asset: The financial instrument (like a stock, index, or commodity) on which the option is based.
Strike Price (Exercise Price): The price at which the underlying asset can be bought (for a call) or sold (for a put).
Expiration Date: The date when the option contract ends. After this date, the option becomes worthless if not exercised.
Option Premium: The price paid by the buyer to the seller for acquiring the option.
Intrinsic Value: The amount by which an option is in profit if exercised immediately.
Time Value: The extra value in the option premium due to time left before expiration.
In-the-Money (ITM): When the option already has intrinsic value (profitable if exercised now).
Out-of-the-Money (OTM): When the option has no intrinsic value.
At-the-Money (ATM): When the strike price equals the current market price of the underlying.
Example:
If a stock is trading at ₹1000 and you buy a call option with a strike price of ₹950, your option is in the money.
If you buy a call with a strike price of ₹1050, it’s out of the money.

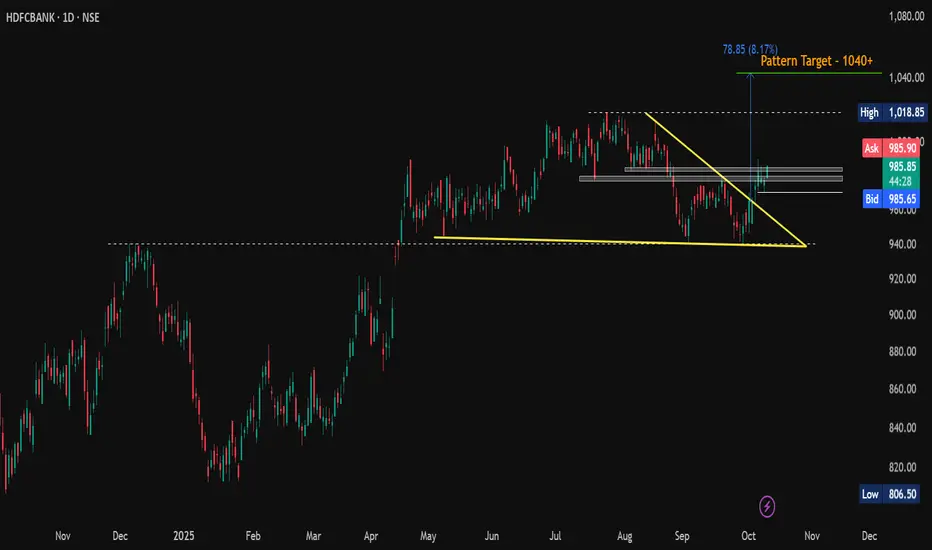
HDFCBANK | Falling Wedge BreakoutCMP: 985
HDFCBANK has broken out of a falling wedge on the daily chart - a classic bullish reversal setup!
🔹 Chart Pattern: Falling Wedge Breakout
🔹 Breakout Confirmation: Price has decisively broken above the upper trendline
🔹 Retest Zone: Price is consolidating near the breakout zone (977 – 980), showing strength
🔹 Pattern Target: 1040+
🔹 Immediate Resistance: 985
🔹 Support Zones: 977 & 970
📈 A Daily Close Above 985 (DCB) can fuel momentum towards the wedge breakout target of 1040+ .
#HDFCBANK | #BreakoutStocks | #FallingWedge | #ChartPatterns | #TechnicalAnalysis | #SwingTrading | #BullishBreakout
📌 Disclaimer: This analysis is shared for educational purposes only. It is not a buy/sell recommendation. Please do your own research before making any trading decisions.
Crypto Asset SecretsUnlocking the Hidden Opportunities in Digital Wealth.
1. Understanding Crypto Assets: Beyond Bitcoin
At the heart of the crypto revolution is Bitcoin, introduced in 2009 by the mysterious Satoshi Nakamoto. However, the crypto universe has grown exponentially to include thousands of digital assets, each with unique functions and investment profiles.
Crypto assets can generally be categorized into three main types:
Cryptocurrencies: Digital currencies like Bitcoin (BTC) and Litecoin (LTC) primarily function as stores of value and mediums of exchange.
Utility Tokens: These tokens power decentralized applications (dApps) and provide access to services within blockchain ecosystems. Examples include Ethereum (ETH) and Chainlink (LINK).
Security Tokens: Represent ownership in traditional assets like equities or real estate, but in digital form, regulated under security laws.
Secret #1: Understanding the specific type of crypto asset is crucial. Investors often make the mistake of treating all digital assets as interchangeable, but their underlying purposes, risk profiles, and regulatory status can vary dramatically.
2. Blockchain Technology: The Foundation of Crypto Assets
The real innovation behind crypto assets is blockchain technology, a decentralized ledger system that allows transparent, secure, and tamper-proof recording of transactions.
Key aspects include:
Decentralization: Eliminates the need for central authorities, reducing the risk of manipulation.
Transparency: Every transaction is recorded on a public ledger, fostering accountability.
Security: Cryptography ensures data integrity, preventing unauthorized changes.
Secret #2: Mastery of blockchain fundamentals provides a competitive advantage. Knowing how blockchain networks operate, their consensus mechanisms (Proof of Work, Proof of Stake), and smart contract functionalities allows investors to assess the true potential and limitations of a crypto asset.
3. The Psychology of Crypto Markets
Crypto markets are notoriously volatile, influenced by a mixture of technological developments, investor sentiment, regulatory announcements, and macroeconomic trends. Unlike traditional markets, crypto often experiences rapid price swings, which can be both an opportunity and a risk.
Secret #3: Emotional discipline is a hidden asset in crypto trading. Market hype can lead to FOMO (Fear of Missing Out), while panic-selling may cause unnecessary losses. Successful investors rely on strategic planning, risk management, and long-term vision rather than impulsive reactions.
4. Advanced Crypto Investment Strategies
While buying and holding popular cryptocurrencies is common, there are several sophisticated strategies to leverage crypto assets:
4.1 Staking and Yield Farming
Many blockchains allow holders to stake their coins, helping to secure the network in exchange for rewards. Yield farming involves providing liquidity to decentralized finance (DeFi) protocols, earning interest or additional tokens.
Secret #4: Staking and yield farming can turn idle assets into income-generating tools, but they carry smart contract and liquidity risks.
4.2 Crypto Arbitrage
Crypto prices can differ across exchanges, creating opportunities for arbitrage trading. Skilled traders exploit these differences to earn profits with minimal market exposure.
Secret #5: Arbitrage requires speed, technical infrastructure, and awareness of transaction fees, making it a secret weapon for professional traders.
4.3 Diversification Across Assets
Unlike traditional portfolios, crypto investors can diversify across various blockchain networks, tokens, and use cases. Balancing between high-risk altcoins and stablecoins can optimize growth while managing volatility.
Secret #6: Diversification in crypto isn’t just about quantity—it’s about understanding the function and ecosystem of each asset, which many retail investors overlook.
5. Security and Custody Secrets
One of the biggest pitfalls for crypto investors is security risk. Unlike banks, cryptocurrency wallets are self-custodied, and loss of private keys means loss of access to funds.
Key security practices include:
Hardware Wallets: Offline storage that prevents hacks.
Multi-Signature Wallets: Require multiple approvals for transactions, enhancing security.
Regular Updates and Vigilance: Phishing attacks, malware, and scams are common.
Secret #7: Knowledge of security practices is as valuable as market knowledge. Investors who neglect custody measures risk losing everything in an instant.
6. Regulatory Landscape: The Hidden Rules
Crypto regulation varies widely across countries, affecting taxation, legality, and trading possibilities. Some regions encourage crypto innovation, while others impose strict restrictions.
Secret #8: Awareness of regulatory shifts is critical. A promising investment in one jurisdiction could face sudden legal constraints in another. Understanding KYC/AML requirements, tax obligations, and cross-border laws is part of long-term crypto strategy.
7. DeFi, NFTs, and Emerging Crypto Opportunities
Beyond traditional cryptocurrencies, the crypto world hosts DeFi (Decentralized Finance), NFTs (Non-Fungible Tokens), and other innovative structures. These ecosystems offer unique ways to create value and income:
DeFi Lending and Borrowing: Earn interest or borrow assets without intermediaries.
NFTs and Digital Collectibles: Represent digital ownership and can appreciate significantly.
Cross-Chain Projects: Enable interoperability between different blockchains, expanding opportunities.
Secret #9: Understanding these emerging sectors allows investors to spot early trends before they hit mainstream attention.
8. Market Analysis Tools and Metrics
Knowledge of market analysis is essential for making informed decisions. Key indicators include:
On-Chain Metrics: Number of active addresses, transaction volume, and token supply data.
Technical Analysis: Chart patterns, moving averages, RSI, and volume trends.
Sentiment Analysis: Social media, news trends, and community activity can predict price movements.
Secret #10: Combining quantitative data with qualitative insights gives investors an edge in anticipating market behavior.
9. Common Mistakes and How to Avoid Them
Even experienced investors fall into traps:
Chasing Hype: Buying based on social media trends rather than fundamentals.
Neglecting Research: Ignoring the technology, team, and roadmap of a project.
Over-Leverage: Using borrowed funds recklessly, which can amplify losses.
Secret #11: A disciplined approach, informed by research and risk management, is what separates successful crypto investors from the majority who fail.
10. The Future of Crypto Assets
The crypto landscape is still evolving. Some of the likely trends include:
Central Bank Digital Currencies (CBDCs): Governments exploring digital fiat currencies.
Institutional Adoption: Greater participation from banks, hedge funds, and corporations.
Integration with Traditional Finance: More bridges between DeFi and conventional markets.
Enhanced Privacy Solutions: Technologies like zero-knowledge proofs improving anonymity.
Secret #12: Staying ahead of the curve requires continuous learning, technical understanding, and strategic foresight. The most profitable opportunities often lie where the market is least developed.
Conclusion
Crypto assets are more than just speculative instruments—they are a new class of digital wealth with enormous potential, hidden risks, and untapped opportunities. By understanding their underlying technology, market psychology, investment strategies, and regulatory landscape, investors can unlock the “secrets” that separate successful participants from those who fail.
The ultimate secret of crypto assets isn’t just knowing which coins to buy—it’s mastering knowledge, discipline, security, and foresight. Those who embrace these principles are the ones who can navigate this volatile, exciting, and revolutionary market with confidence and success.
HDFCBANK 1 Month Time Frame 📊 1-Month Technical Outlook
Technical Rating: Strong Buy
Pivot Points:
Classic: Pivot: ₹960.28 | Support: ₹937.03, ₹951.12 | Resistance: ₹974.37, ₹983.53, ₹997.62
Fibonacci: Pivot: ₹960.28 | Support: ₹945.91, ₹951.40 | Resistance: ₹974.65, ₹983.53
Camarilla: Pivot: ₹961.30 | Support: ₹961.09, ₹963.80 | Resistance: ₹967.85, ₹969.21
Moving Averages:
Short-Term (MA5, MA10, MA20): Buy
Medium-Term (MA50): Sell
Long-Term (MA100, MA200): Buy
Relative Strength Index (RSI): 50.54 (Neutral)
MACD: -4.82 (Sell)
Average True Range (ATR): 13.27 (Moderate Volatility)
ADX (Trend Strength): 19.12 (Weak Trend)
Williams %R: -36.70 (Buy)
Commodity Channel Index (CCI): -13.66 (Neutral)
Rate of Change (ROC): -0.22 (Sell)
🔍 Summary
HDFC Bank's stock shows a bullish trend over the past month, with positive technical indicators and a strong buy signal. However, the neutral RSI and sell signal from the MACD suggest caution. Investors should monitor these indicators closely for potential shifts in market sentiment.
HDFC BANKThere is double bottom pattern formation in HDFC Bank. Closing above 980-985 will be breakout confirmation. One can go long with stop loss below 960 for the target of 1020. Quarterly updates suggests HDFC Bank result will be better this quarter.

HDFC Bank Ltd (HDFCBANK)- Analysis Trend is bullish however if you wish to maximize the profit Any bounce in the stock will be a good opportunity to book the profit in the stock and wait for it to come around 842 to 816 price for better entry price. If it comes around 735 to 635 would be the best price with Stop loss of 600
Targets can be around 1200 to 1300 for
Above 980 bullish and below 923 bearish
If it comes around 1030 to 1070 consider booking profit
Rest of the levels are marked on chart.
**Consider some Points buffer in above levels
**Disclaimer -
I am not a SEBI registered analyst or advisor. I does not represent or endorse the accuracy or reliability of any information, conversation, or content. Stock trading is inherently risky and the users agree to assume complete and full responsibility for the outcomes of all trading decisions that they make, including but not limited to loss of capital. None of these communications should be construed as an offer to buy or sell securities, nor advice to do so. The users understands and acknowledges that there is a very high risk involved in trading securities. By using this information, the user agrees that use of this information is entirely at their own risk.
Thank you.

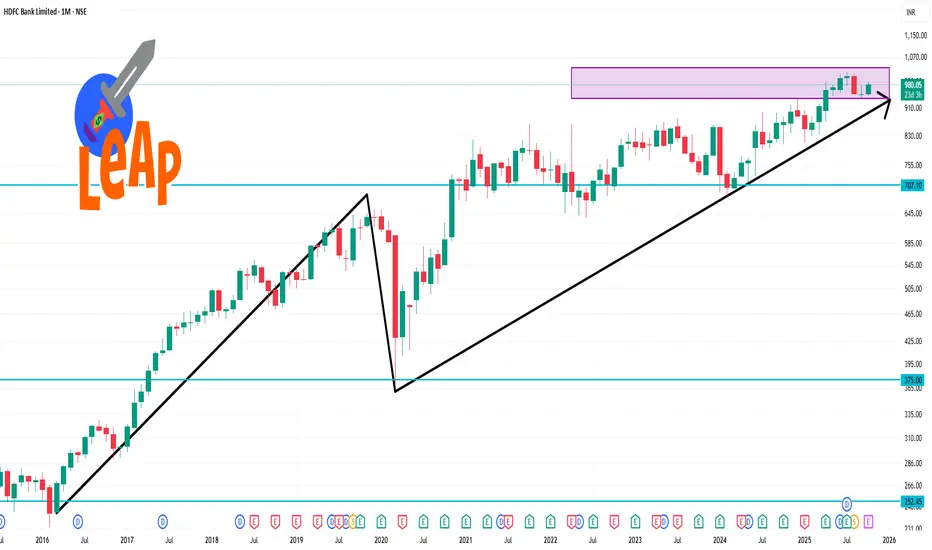
HDFC Bank: Three Decades of Excellence ContinuesTechnical Analysis
HDFC Bank represents one of the most remarkable wealth creation stories in Indian equity markets. The stock has delivered an extraordinary super bullish rally over three decades, transforming from ₹1 to the current trading level of ₹955 - representing an astounding 955x growth over 30 years.
Currently, the stock is taking strong support in the ₹935-₹945 zone, which has acted as a crucial demand area. This support zone has been tested multiple times and held firm, indicating institutional accumulation at these levels.
If the three-decade bullish rally continues from current support levels, the technical setup favors resumption of the uptrend. The stock is well-positioned for the next leg of growth from the established support zone.
Entry Strategy: Accumulate in the ₹935-₹955 range with strong support confirmation.
🎯Targets:
Target 1: ₹980
Target 2: ₹1,000
Target 3: ₹1,020
Stop Losses:
Minor Support: ₹850 (intermediate demand zone)
Major Support: ₹650 (strong long-term support)
If ₹650 level breaks down, no more expectations on this stock.
FY25 Financial Highlights (vs FY24 & FY23)
Total Income: ₹3,36,367 Cr (↑ +19% YoY from ₹2,83,649 Cr; ↑ +97% from FY23 ₹1,70,754 Cr)
Total Expenses: ₹1,86,974 Cr (↑ +7% YoY from ₹1,74,196 Cr; ↑ +197% from FY23 ₹63,042 Cr)
Financing Profit: ₹-34,501 Cr (Improved from ₹-44,685 Cr in FY24)
Profit Before Tax: ₹96,242 Cr (↑ +26% YoY from ₹76,569 Cr; ↑ +57% from FY23 ₹61,498 Cr)
Profit After Tax: ₹73,440 Cr (↑ +12% YoY from ₹65,446 Cr; ↑ +59% from FY23 ₹46,149 Cr)
Diluted EPS: ₹46.26 (↑ +10% YoY from ₹42.16; ↑ +12% from FY23 ₹41.22)
Fundamental Highlights
HDFC Bank delivered strong FY25 performance with consolidated PAT growing 12% YoY to ₹73,440 crore, supported by robust 19% revenue growth to ₹3,36,367 crore. The bank declared ₹22 dividend reflecting confidence in sustained profitability.
Market cap stands at ₹14,51,630 crore (up 7.84% in 1 year) with stock trading at 2.77 times book value. Total revenue for FY25 reached ₹3,42,193 crore with profit of ₹73,343 crore, demonstrating consistent financial strength.
Q4 FY25 standalone net profit grew 6.7% YoY to ₹17,616 crore, with net interest income (NII) increasing 10.3% YoY to ₹32,070 crore. Net interest margin (NIM) stood at 3.54% on total assets, reflecting stable spreads despite competitive environment.
Asset quality remains robust with gross NPAs at 1.36% and net NPAs at 0.33% of net advances. Average deposits for Q4 FY25 grew 15.8% YoY to ₹25,280 billion, while CASA deposits grew 5.7% YoY to ₹8,289 billion, maintaining stable share in deposit mix.
The bank is strategically managing its credit-deposit (CD) ratio and planning measured loan growth in FY26 to maintain balance sheet quality. Strong subsidiary performance and digital banking initiatives continue to drive franchise value.
Conclusion
HDFC Bank's remarkable 30-year journey from ₹1 to ₹955, backed by strong FY25 fundamentals showing 12% PAT growth and ₹22 dividend declaration, validates the long-term investment thesis. The ₹935-₹945 support zone offers attractive accumulation opportunity for targeting ₹1,020+ levels. Robust asset quality with 1.36% gross NPA, 15.8% deposit growth, and stable 3.54% NIM demonstrate operational excellence. The stock remains a core banking sector holding with multiple support levels providing risk management framework.
Disclaimer: tinyurl.com

HDFCBANK 1D Time frameOpening Price: ₹950.30
Closing Price: ₹960.45
Day Range: ₹946.00 – ₹961.40
Previous Close: ₹950.30
🧠 Price Action Insights
The stock is trading below key moving averages, confirming the bearish trend.
No significant reversal pattern has formed, suggesting the downtrend may continue.
Watch for a breakout above ₹970.00 for a potential trend reversal.
Intraday and Swing Trading1. Intraday Trading
1.1 Definition
Intraday trading is the practice of buying and selling securities within a single trading day. Traders aim to profit from short-term price fluctuations and must close all positions before the market closes. The key feature of intraday trading is its very short time frame, which can range from a few minutes to several hours within the same day.
1.2 Objectives of Intraday Trading
Profit from Volatility: Intraday traders capitalize on small price movements and volatility within the day.
Avoid Overnight Risk: By closing positions before the market closes, traders avoid risks associated with overnight events like news releases, economic announcements, or geopolitical developments.
Liquidity Utilization: Intraday traders prefer highly liquid stocks and indices to ensure easy entry and exit at favorable prices.
1.3 Key Characteristics
Short Time Horizon: Trades last minutes to hours, rarely overnight.
High Frequency: Traders often execute multiple trades in a single day.
Leverage Usage: Intraday trading often involves leverage to amplify returns, increasing both potential gains and risks.
Technical Analysis Oriented: Decisions rely heavily on charts, patterns, and indicators rather than fundamental analysis.
Rapid Decision-Making: Traders must react quickly to market movements to avoid losses.
1.4 Tools and Techniques
Intraday trading relies heavily on technical analysis, which includes chart patterns, technical indicators, and market data. Key tools include:
Candlestick Charts: Provide visual representation of price movements and patterns like Doji, Hammer, or Engulfing patterns.
Moving Averages (MA): Help identify trends and dynamic support/resistance levels.
Relative Strength Index (RSI): Measures momentum and helps identify overbought or oversold conditions.
Bollinger Bands: Highlight price volatility and potential reversal points.
Volume Analysis: Confirms the strength of price movements and breakouts.
1.5 Common Intraday Trading Strategies
Scalping: Making multiple trades to capture small price movements.
Momentum Trading: Buying or selling based on strong price trends and momentum indicators.
Breakout Trading: Entering positions when prices break significant support or resistance levels.
Reversal Trading: Identifying trend exhaustion points to profit from price reversals.
1.6 Risk Management in Intraday Trading
Risk management is crucial in intraday trading due to high volatility and leverage. Key principles include:
Stop-Loss Orders: Predefined exit points to limit losses.
Position Sizing: Allocating a small percentage of capital to each trade.
Risk-Reward Ratio: Ensuring potential profits outweigh potential losses.
Avoiding Emotional Decisions: Relying on pre-planned strategies instead of reacting impulsively.
1.7 Advantages of Intraday Trading
High Profit Potential: Quick gains from small price movements.
No Overnight Risk: Trades are closed within the day, reducing exposure to unexpected events.
Learning Experience: Offers fast feedback for traders to refine skills.
1.8 Disadvantages of Intraday Trading
High Stress: Requires constant attention and quick decision-making.
High Transaction Costs: Frequent trades increase brokerage and other fees.
Potential for Large Losses: Leverage and volatility can amplify losses.
2. Swing Trading
2.1 Definition
Swing trading is a trading style that seeks to capture medium-term price moves, typically over a few days to several weeks. Swing traders aim to identify trends or “swings” in the market and enter trades to profit from upward or downward price movements.
2.2 Objectives of Swing Trading
Profit from Trends: Swing traders capitalize on market trends that develop over days or weeks.
Flexibility: Trades do not require constant monitoring, unlike intraday trading.
Balanced Risk Exposure: Exposure to overnight market risk is managed with proper risk management techniques.
2.3 Key Characteristics
Medium-Term Time Horizon: Trades last days to weeks, sometimes months.
Fewer Trades: Swing traders make fewer trades but aim for higher gains per trade.
Combination of Technical and Fundamental Analysis: Uses charts and indicators, along with news and company fundamentals.
Trend-Focused: Focuses on capturing price swings within an overall trend.
2.4 Tools and Techniques
Swing trading combines technical analysis and market sentiment indicators to make decisions:
Trend Lines and Channels: Identify the direction of the trend and potential entry/exit points.
Moving Averages: Used for trend confirmation and dynamic support/resistance.
Fibonacci Retracements: Identify potential reversal levels within a trend.
MACD (Moving Average Convergence Divergence): Helps confirm trend direction and momentum.
Candlestick Patterns: Used to anticipate reversals or continuation of trends.
2.5 Common Swing Trading Strategies
Trend Trading: Entering trades in the direction of the overall trend and holding until signs of reversal.
Pullback Trading: Buying during short-term price dips in an uptrend or selling during short-term rallies in a downtrend.
Breakout Trading: Entering positions when prices break key support or resistance levels with significant volume.
Reversal Trading: Identifying market tops or bottoms to trade against short-term exhaustion.
2.6 Risk Management in Swing Trading
Swing trading requires risk management techniques due to exposure to overnight and weekend market events:
Stop-Loss Placement: Protects against unexpected price reversals.
Diversification: Reduces risk by trading multiple instruments.
Position Sizing: Controls risk per trade based on portfolio size.
Monitoring Market News: Stay informed about events that could impact open positions.
2.7 Advantages of Swing Trading
Less Stressful: Does not require constant monitoring of markets.
Higher Profit Potential per Trade: Captures larger price movements than intraday trading.
Flexibility: Trades can be managed alongside other work or activities.
2.8 Disadvantages of Swing Trading
Overnight Risk: Exposure to events outside market hours.
Patience Required: Trades may take days or weeks to develop.
Moderate Capital Requirement: Larger stop-losses may require higher capital per trade.
3. Intraday Trading vs Swing Trading
Feature Intraday Trading Swing Trading
Time Horizon Minutes to hours Days to weeks
Frequency of Trades High Moderate
Profit per Trade Small Moderate to large
Risk Exposure Low overnight risk High overnight risk
Stress Level High Moderate
Tools Used Technical indicators, charts Technical + fundamental analysis
Leverage Usage Commonly used Rarely used
Key Insight: Intraday trading suits those who can devote time and handle fast-paced markets. Swing trading suits traders who prefer medium-term opportunities and can tolerate overnight risk.
4. Psychological Aspects
Trading, whether intraday or swing, is as much about psychology as strategy. Key psychological aspects include:
Discipline: Following rules and strategies consistently.
Patience: Swing traders must wait for the right opportunities.
Emotional Control: Avoiding impulsive decisions due to fear or greed.
Adaptability: Markets are dynamic, and traders must adjust strategies as conditions change.
5. Choosing the Right Approach
Selecting between intraday and swing trading depends on multiple factors:
Time Availability: Intraday trading requires active monitoring, while swing trading is more flexible.
Risk Appetite: Intraday traders tolerate frequent small losses; swing traders accept occasional larger losses.
Capital Requirements: Intraday trading often requires less capital but higher leverage; swing trading may require larger capital due to bigger stop-losses.
Personality: Intraday trading suits fast decision-makers; swing trading suits patient, analytical individuals.
6. Tips for Successful Trading
Develop a trading plan and stick to it.
Use technical indicators wisely; avoid indicator overload.
Practice risk management: never risk more than 1–2% of capital per trade.
Keep a trading journal: record strategies, trades, emotions, and results.
Continuously learn and adapt: market conditions evolve, so must your strategies.
7. Conclusion
Both intraday and swing trading offer unique opportunities and challenges in the financial markets. Intraday trading suits active traders seeking quick profits and dynamic engagement, while swing trading appeals to those who prefer medium-term trends and a more relaxed pace. Mastery of either strategy requires strong technical skills, disciplined risk management, emotional control, and continuous learning.
By understanding the nuances of each approach, traders can align their strategies with their financial goals, risk tolerance, and lifestyle, ultimately improving their chances of consistent profitability in the financial markets.