HDFC BANK 18 March 2024 UpdateDisclaimers:-
The information provided on this channel is strictly for Educational purposes only & is not to be an advice or recommendation of any kind whatsoever. Anyone who wishes to apply concepts & ideas contained in this channel takes full responsibility for their own actions. Viewer should always do their own due diligence on any information perceived from this channel, to form their own opinions & best judgements. The author accepts no liability for any damages arising directly or indirectly on account of any actions taken based on the information provided in this channel. I am not a SEBI registered.
HDFC Bank Limited ADR
No trades
Trade ideas

HDFC bank - 15 min Analysis buy only above 1460 - candle closinHDFC bank - 15 min Analysis
buy only above 1460 - candle closing basis ( 15 min)
Target 1480- 1499- 1520- 1550-1590-1650-1690+
SL below 1440 candle closing basis
time frame 1-2 week holding

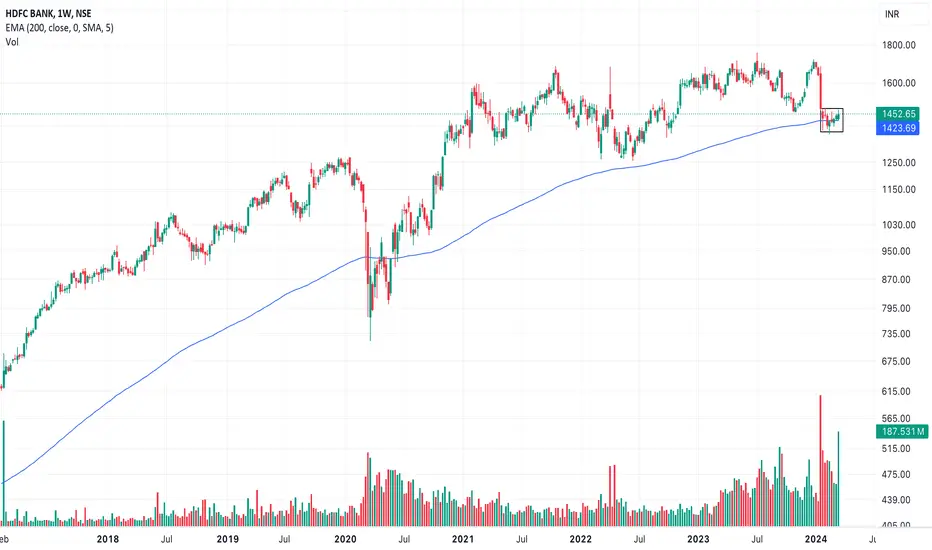
HDFC BANK - 200 Week MA Hdfc Bank is making base near the 200 Week Moving Average. Historically , it always has reversed the 200 Week Moving Average
1380 to 1420 is a good demand zone for HDFC BANK
Keep a watch at these levels
Short-term view on HDFC BANKHi
Ashish this side a swing trader I have made video on HDFC BANK I request you kindly watch this video and Share your view about the Analysis.

HDFC Bank - Live Market update
Buy HDFC Bank above 1444. SL 1435.
Target 1521
Disclaimer: I am not a SEBI Registered Analyst. It is only for educational purposes. Please consult your financial advisor before making any decision. I will not be responsible for any of your profits or losses.

HDFC bank buy given at 1399, 1510 possible On Our Harmonic pattern indicator based trade setup take trade as explained below :-
Early trades Buy or sell below/ above 23.6 %, safe trades buy or sell above / below 41% , after taking trade next upside or downside levels will be target ,
When reverse buy or sell signal appear then book profit on Target or trail SL to 23.6 % If trailing SL hit then early trade can be taken above or below 23.6 and safe trade can b taken above/ below 41% ..
Please note:-
It's working on news based and volitile market very well so exit if SL hit

HDFCBANK TRENDLINE BREAKOUTHdfcbank breaking resistance trendline
with good volumebuilding up
#target 1530 for now
EDUCATIONAL IDEA

HDFC Bank - update
Buy HDFC Bank above 1425. Be watchful of this candle today 3-12-24 1:40 PM and have patience till first candle of 45 minutes. Target is very big.
Disclaimer:
I am not a Registered Analyst with SEBI and it is only for educational purposes. Please consult your financial advisor before making any decision. I will not be responsible for any of your profits or losses.

HDFC BANK MAKING HEAD AND SHOULDER Hello Everyone, Mehul Prajapati here.
HDFC Bank is making reverse head and shoulder pattern so if it breaks 1460 level than I think we get target of 1550 in next few days so keep eyes on it and make a entry after it breaks the level of 1460 and place the SL acording to you.

HDFC Bank - How to trade today
I skipped to know that 8th of March was a trading holiday in India. Such things sometime change analysis drastically.
1444 is a magical figure for HDFC Bank, so long as it remains above it not to worry. At present support is at 1442.3. Do not hurry. Target is very big - 1420 should be SL and 1521 is the next immediate target.
Anyways, Time candle for today is 3-11-24 11:03 AM Every thing else remains the same.
Disclaimer:
I am not a Registered Analyst with SEBI and it is only for educational purposes. Please consult your financial advisor before making any decision. I will not be responsible for any of your profits or losses.
Let you grow. May! I follow you

hdfc bullish batalready take support from 1358 and have 2nd support at 1305 strongly.
consider every support level s1 (1358 ), s2 (1305)
so the risk is low and the profit is high.
this analysis is for learning purpose only.
It is just a view, please trade at your own risk. I'm not SEBI registered adviser

HDFC NSE:HDFCBANK
Hdfc hold upper side zone if they break down this zone. Again selling pressure
1) hdfc bank 1460-70 is resistance level
2) support level 1420-10

Banking stocks strongWith nifty creating new highs every week, banking stocks might see good upmoves in the coming few weeks.
In this video , I discuss few banking stocks setups which look to resume their uptrend .
Cheers!

1711 target in HDFC within 6 monthsExpecting long rally in HDFC BANK. Expected target Rs1711 in next 6 month

HDFC BANK Is at Bullish ZoneDear All,
HDFC BANK is At Sideways Zone and Ready for Breakout Soon.. Keep Watching and Eye on it.
S1-1440
S2-1435
S3-1424
TG1-1470
TG2- 1480
I am not SEBI Registered . Please Accord your Capital And Your Risk Apetite.

HDFC Bank - How to trade today
It was a real crucial day for the stock and as per my live market analysis ended above 1444. It is good news for the retailers and investors of HDFC Bank showing intentions of the smart money to take it further up. Resistances have been marked on the chart.
Please read the notes as mentioned on the chart and act accordingly.
Now,
Yesterday it created a doggy (indecisive) candle with
High of 1451.05.
Low of 1441.4.
Ended marginally below 1446.25
3-8-24 12:03 PM is the time candle for today, buy above high of it and sell below.
Disclaimer:
I am not a SEBI Registered Analyst and it is only for educational purposes. Please consult your financial advisor before making any decision. I will not be responsible for any of your profits or losses.
Let you grow. May! I follow you.

HDFC Bank - Live Market update
Buy HDFC Bank above 1444.
Disclaimer: I am not a SEBI Registered Analyst. It is only for educational purposes. Please consult your financial advisor before making any decision. I will not be responsible for any of your profits/losses.

HDFC Bank (Bearish Sequence)## We publish bearish sequence in hdfc bank & exactly it happen eventhough bank nifty is recovering but hdfc is not, you can see the chart below.
## Anyway HDFC bank is still developing M2 wave after which it will proceed for downward movement.
## Even though M3 failed but still Longterm wave is still bearish, so hdfc bank will fall again.
_____________________________________________________________________________
Previous Long Term forecast
______________________________________________________________________________
Bank Nifty Medium Term Forecast
_____________________________________________________________________________

#Banknifty:7th March#Banknifty:7th Mar
Step1# On gap up wait for cool off.
Step2#47887 is support base. enter long.
Step3# Stay long till 48500....
Step4# Buy all dips.....and average your position.

HDFC Bank - How to trade today
HDFC Bank is trading above 50% and 61.8% of the current swing, therefore it is bullish.
Execution tips - Use 144 EMA in 1H chart frame and so long it is above that, do not worry at all.
Please read the notes as mentioned on the chart and act accordingly.
Disclaimer:
I am not a SEBI Registered Analyst and it is only for educational purposes. Please consult your financial advisor before making any decision. I will not be responsible for any of your profits or losses.
Let you grow. May! I follow you.

HDFC BANK LONG The time has for a recovery ..
filled my bags ready for a long positions...
DYOR before any investment...

HDFC bank buy given from 1399 hold it 1510 1st Target On Our Harmonic pattern indicator based trade setup take trade as explained below :-
Early trades Buy or sell below/ above 23.6 %, safe trades buy or sell above / below 41% , after taking trade next upside or downside levels will be target ,
When reverse buy or sell signal appear then book profit on Target or trail SL to 23.6 % If trailing SL hit then early trade can be taken above or below 23.6 and safe trade can b taken above/ below 41% ..
Please note:-
It's working on news based and volitile market very well so exit if SL hit

HDFC Bank - update -
Please refer to my live market idea tomorrow where it turned bullish above 1:03 p.m. Today be watchful of 11:15 candle and buy only above it.
Important: Please use 144 EMA in 1H chart. Since price of the stock is above 144 EMA, it is not likely to go below it. But, still it is below 233 EMA, so let it rebound from 144 EMA once again and buy when rebounding from there it goes up.
Time candle of 11:15 is very important.
