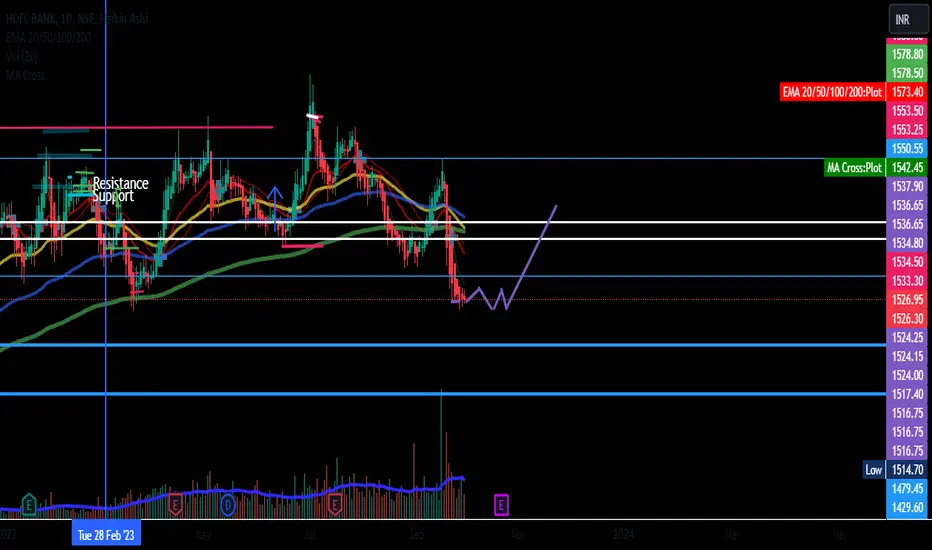
HDFC Bank - Final supportHello Investors,
All these two years HDFC bank share had tough time for investors. Now I did a monthly time frame analysis with the trend line and horizontal price engagement area meeting the trend line.
Hope this could be the final swing to come low for HDFC bank.
What are the support levels ?
1505, 1500, 1498, 1480
From any of these price point it will bounce and will have a pleasant rally, why ? FII buying in HDFC Bank has increased from the june quarter and the DII as well showing interest.
Thanks
HDFC Bank Limited ADR
No trades
Trade ideas

Hdfc bank is down from 200 DMAs & Chances are move to 1700 RShdfc bank is near 200 DMA support and it's trying to move to 200 DMA to 1700 Rs with huge volume & if it does not support 200 DMA it move to consolidation near 1450-1490 Rs
HDFC Bank at Demand ZoneHDFC Bank at demand zone watch this areas 1530 to1500 price action any positive price action zoom into lower time frame to get early entry here i have posted daily chart if held here can long this stock to 1550,1575 and 1600 evels again .
1500 Below price voilates long invalid .

HDFCBANKTrend Line breakout with high volume, Trading above MA line
Please have a minimum of 3 months for a short-term investment, Trade with stop Loss.

WEEKLY INDECISION On the weekly chart, the last candlestick shows indecision is the HDFC bank which closed in its strong support zone. October is a crucial month for this stock as its quarter result is upcoming.

Monthly trendline breakdown continuationHDFC Bank had closed below monthly trendline prev month and this month also it has given a continuation on the downside.

HDFC Bank - Total buying in todays candle 7.72M so far
HDFC Bank looks to have gone graves. But, preparing for huge pull back. It seems the bulls have got the control and now recovery may come soon.
Will attach 1H Chart as well.
But, dont be in hurry at all. Let the levels come after 4th and remember the time of candle I share in the last post. Adhere to proper price and time. I am sure of your success.
Levels to watch:
Todays low 1523.7
Sell below and levels 1504.2452 1484.9154 1465.7106 1446.6308
Buy above and levels 1528.58 1533.47 1543.28 1562.98 1582.81 1602.76

HDFC Bank - A pictorial view - Live Market
Dear Followers:
Lets understand the concept of market which is applicable every where.
1. The so called, smart money or the big players require liquidity; means when retailers or small investors have the majority of stock with them i.e. (stock is overbought) prices will be brought down and when opposite happens, i.e. (stock is oversold) prices are taken up.
2. How would we (the retailer know that it is oversold/overbought)? Through RSI or Williams R%. How, they have to be set properly, we will discuss in some other chart.
3. I think (out of my experience) apart from these two others are only lagging indicators and have not to be used at all.
4. We check only price on the graph and that too the horizontal view and not the circular aspect of the relationship between time and price. (I would take up this with also with some other chart.
5. Price action we all use but probably no one knows the meaning of price action. It is not only checking only high and lows but to match horizontal and circular, vertical supports and resistances.
I am presenting here the basic glimpse of how the circular and horizontal resistances and supports work with the help of 1 H Chart of HDFC Bank. All the high and lows have also been marked with red and blue diamonds respectively.
We will discuss all these aspects in detail in charts to be discussed in future; one by one. Till then keep track of the timings, date and prices mentioned by me in all the charts and adhere to that.
Thank you

HDFC share analysisSIMPLE price action HDFC is breaking its channel and moving down side
SHORT TERM TARGET 1400

HDFC Bank Daily chart analysis || Long term BuyHDFC and Reliance are charting distinct paths compared to the broader Indian market, exerting a direct influence on the Nifty and Sensex indices. The recent drop of almost 10% from their all-time highs, coupled with the breach of key support levels, raises significant concerns for these indices.
The absence of immediate support levels suggests that the upcoming month could witness heightened volatility and increased difficulty for stocks in identifying robust support zones for a rebound. For those considering long-term investment, the present moment presents an opportune time to buy, as the downside risk is limited to less than 5%

HDFC Bank - Wait till 29th September
HDFC Bank is still bearish. As per my previous coverage, will have to wait :
1. Levels to be formed on 29th September 2023. (Not likely to go below 1510).
2. Whatever low is made on 29th September 2023 has to be watched.
3. On 2nd October we have a holiday.
From 4th it is likely to be bullish. Don't be in hurry at all.
4. Meanwhile candles to be watched. (These are the candles likely to reverse the trend existing then).
(a) 10/1/23 11:07 AM
(b) 10/4/23 9:59 AM
Please adhere to the time and price levels mentioned here and trade in consonance with other indicators.
Disclaimer: I am not a SEBI Registered Analyst. Please consult your financial advisor before making any decision.

Breakout expected.Its 4 th wave pull back over which was a complex correction.
It is likely to take out 3 rd wave high which is at 1708
and move higher.
Due to tech weightage adjustment in FTSE. expected inflows of $650 million in to hdfc bank.
The chart is in weekly time frame.
Do ike this post if it helps you.
follow me to get updates.
Please go through my previous posts

HDFCBank Swing Opportunity Hi All - good opportunity to go long on HDFC Bank for short term trade.
Key Highlights:
1. Go long as it bounces off the support
2. Good risk to reward

HDFC buy swing trade HDFC stock current price 1531 .
Best lowest price in 2023
Good support daily an weekly chart.
Who want invest for swing trade
Buy 1531.
First Target 1644
Second Target 1740+.
Stoploss 1500. (31rs)

HDFC bank fake or real breakdown HDFC Bank has given triangle pattern breakdown.
Volume has not given the confirmation, current week volume is less than previous week.
Expecting breakdown retest and their after validation of the breakdown.
Bank Nifty has retraced its 50% retracement level after up move in last couple of weeks.

HDFC Bank - Do you sell? Hold? Average? Targets for long term?HDFC Bank
CMP 1529 - this would act as a major support followed by the Green lines as shown
are the support levels.
HDFC Bank would touch and bounce of any of the Support levels.
1600 would once again act as a resistance level on the way up.
Targets for long term would be 1730, 1760 & 1800
If holding good levels to add would be the support levels that are given.

HDFC Bank - Recovery Possible after two days from here
You can see that two triangles have been drawn consecutively and adjoining them is a sky blue coloured trend line.
1. The low of 22nd September once formed will not be broken. When I say low of 22nd September it doesn't mean low already formed on the last day, A day has 24 hrs and we are open for trade only for 6hrs 15 mins in a day. More over, below the last daily candle formed there is a gap, which will serve as a solid support. So, whatever low is formed in the next three days, i.e. Tuesday will give firm base. There will be recovery from here till 29th September 2023; so be careful on 29th September. On 1st October 2023. the price is supposed to touch this line for upwards swing and after making base on 2nd and 3rd onwards, from 4th there is likely to be recovery invoke. In between there could be some holidays, please ignore them.
I am not a SEBI Registered Analyst, this is just for educational purpose. Before, making any decision, please consult your financial advisor.

Log supportHDFC bank is standing at Support line onnLog chart. If prices takes bounce forn 1510-1520 zone and gives close above 1565 then it can be onborded for upmove.

HDFC Bank class A divergence.HDFC Bank class A divergence seen on chart which is sign of reversal. It may reverse from here for target 1800,2100.

Is this right time to take a position in third most valued stockThe third most valued stock in Indian market HDFC Bank Ltd, LTP ₹1529 as on the date 22/09/2023.
The reason behind dragged the stock down trend because of institution & analysts forecasting decline in estimates revenue for FY24&FY25 due to a fall in the Marge’s bank net worth and accounting changes, increasing NPLs for the merged entity (HDFC AMC), a fall in net interest margin and weakness in return on asset(RoA).
As per technical parameters currently stock is trading in very important zone’
As of now trend is Neutral and it’s price hold above a very strong support zone,
So a 7.5-9% moves possible only when it enter in trend as well as break important levels.
As per my technical understanding if price hold above 1516.56 level on closing basic then only long positions can be carry. Other wise if the stock break 1500 level then down trend upto 1400/1350 can be possible. And one more thing remember that price also going to touch the 200 EMA in this 1400-1350 zone if it take a hold above 200 EMA then also it’s good price for go long.
And upside move only possible if price hold above 1560 levels then upto 1700 moves possible.
It’s not a recommendation for any buy/sale. But as of now a small swing trade possible buy above 1516.65 and took a SL below 1514.17 only for risk takers.
Thank you everyone
Good luck traders

HDFCBANK: 3 Year Triangle BreakdownHDFCBANK broke down of its 3 year long Ascending triangle with a big red candle and high volumes this week. Can head down if the down momentum continues. Or it could bounce back next week and come back into the triangle to break upwards.


A Difficult Read on HDFCBANKHigh Ce Oi. But At A Gap Support. Difficult To Go Short. May Be If The Gap Breaks Then Plan A Short.
Counter Trend Trade Is To Go Long Upon Confirmation Only.
