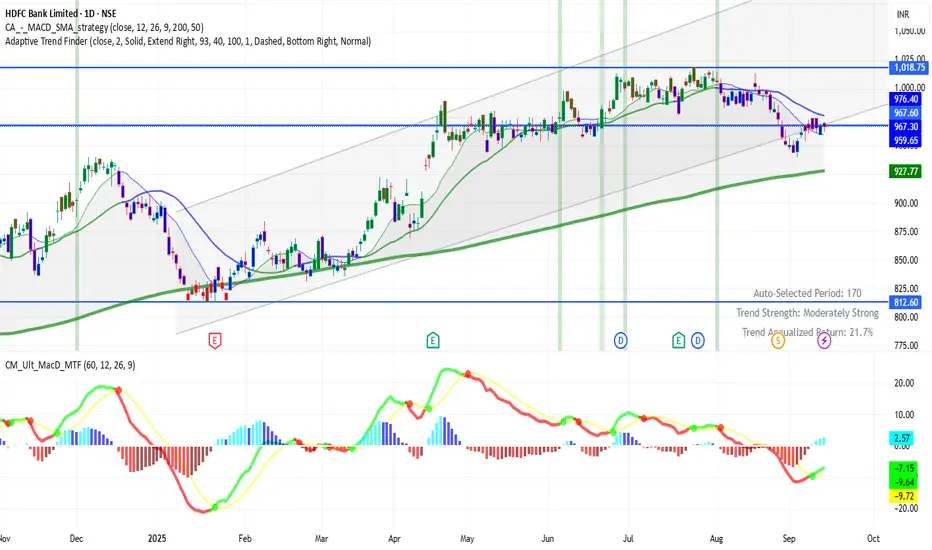
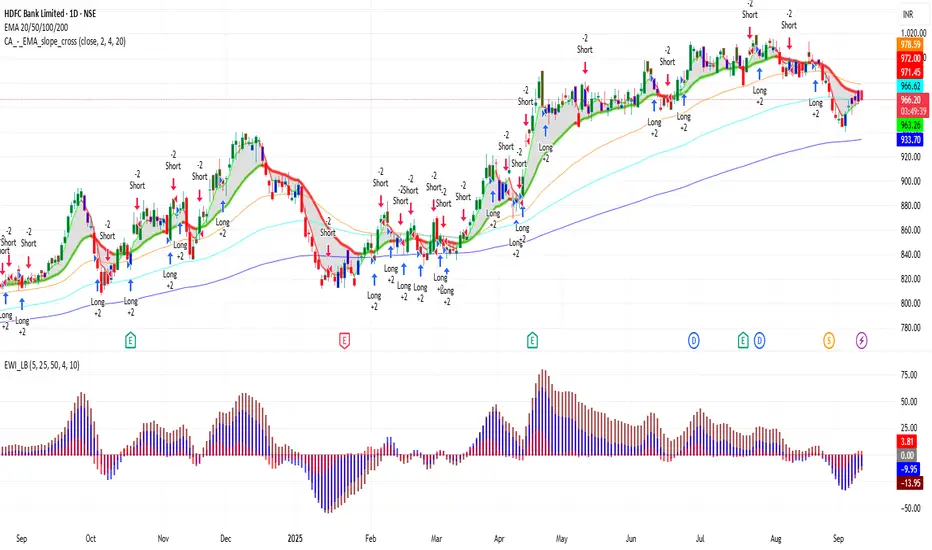
HDFCBANK 1D Time frame:
📍 Current Price
₹967.30 (closing price)
Short-Term Outlook
Bullish Scenario: A sustained move above ₹975.00 could lead to a test of the 52-week high around ₹1,018.85.
Bearish Scenario: A drop below ₹960.00 may signal a potential pullback toward ₹950.00.
Trade ideas

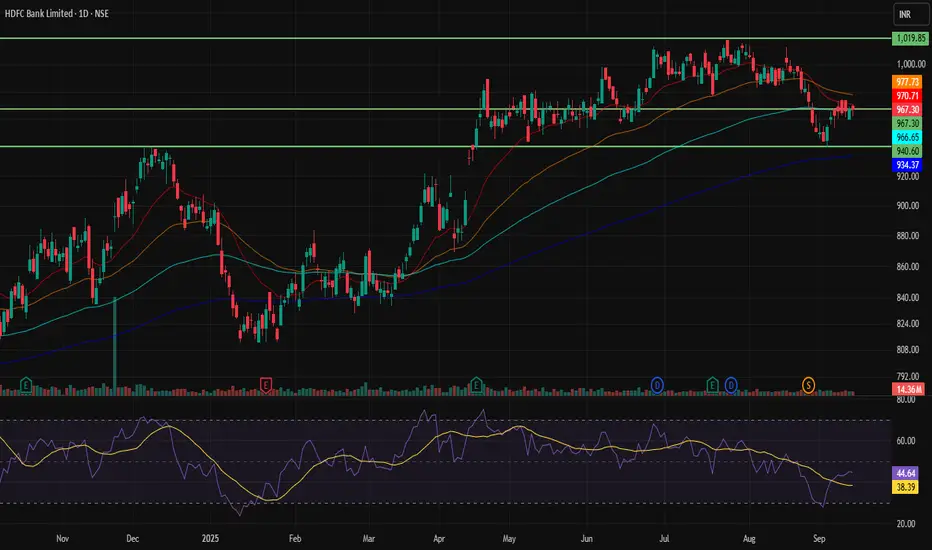
HDFCBANK 1D Time frame📊 Current Status
Price around ₹967
Trading near resistance zone
🔑 Key Levels
Support: ₹960 → ₹950
Resistance: ₹970 → ₹975
✅ Outlook
If price sustains above ₹975, further upside possible. Falling below ₹950 may bring weakness or sideways movement.
HDFCBANK 1D Time frame🔢 Current Level
Trading around ₹967
🔑 Key Resistance & Support Levels
Resistance Zones:
~ ₹970 – ₹975 (near-term resistance)
~ ₹980 – ₹985 (stronger resistance zone if it moves past the first)
Support Zones:
~ ₹962 – ₹960 (immediate support)
~ ₹955 – ₹950 (short-term support)
~ ₹945 – ₹940 (deeper support if price falls further)
📉 Outlook
Bullish Scenario: If HDFCBANK holds above ₹970 and clears resistance around ₹975, it may aim for ₹980+.
Bearish Scenario: If it drops below ₹960, it could test support in the ₹950-₹940 region.
Neutral / Range: Likely to trade sideways between ₹960-₹975 unless there’s a strong breakout or breakdown.
HDFCBANK 1D Time frame🔢 Current Level
Trading around ₹966 – ₹968
🔑 Key Support & Resistance Levels
Resistance Zones:
~ ₹973 – ₹975 (near-term resistance)
~ ₹980 – ₹985 (stronger resistance if price crosses above the earlier zone)
Support Zones:
~ ₹962 – ₹960 (immediate support)
~ ₹955 – ₹953 (lower support if downward pressure continues)
📉 Outlook
Bullish Scenario: Holding above ₹960-₹962 may push price toward ₹973-₹975, and a breakout above that can lead to ₹980-₹985.
Bearish Scenario: Falling below ₹955 may increase downside risk toward deeper supports.
Neutral / Range Zone: Between ₹960-₹975, likely sideways consolidation until a breakout happens.
HDFCBANK 1D Time frame🔢 Current Level
Trading around ₹966 – ₹968
🔑 Key Resistance & Support Levels
Resistance Zones:
₹970 – ₹975 (near-term resistance; breakout above this may lead to further upside)
₹980 (psychological resistance)
₹1,000 (stronger resistance above)
Support Zones:
₹960 – ₹962 (immediate support; failure to hold above this may lead to a decline)
₹950 (short-term support; a break below this could indicate weakness)
₹940 – ₹945 (deeper support zone if price dips further)
📉 Outlook
Bullish Scenario: If HDFCBANK holds above ₹962, upward momentum may continue. Break above ₹975 can open the way toward ₹980+.
Bearish Scenario: If it falls below ₹950, risk increases toward ₹940 – ₹945.
Neutral / Range: Between ₹962 – ₹975, HDFCBANK may consolidate before a directional move.

HDFCBANK 1D Time frame🔢 Current Level
Trading around ₹964.55 - ₹967.80
🔑 Key Resistance & Support Levels
Resistance Zones:
₹970 – ₹975 (near-term resistance; breakout above this may lead to further upside)
₹980 (psychological resistance)
₹1,000 (stronger resistance above)
Support Zones:
₹960 – ₹965 (immediate support)
₹950 (stronger support if price dips further)
₹940 – ₹945 (deeper support zone)
📉 Outlook
Bullish Scenario: If HDFCBANK holds above ₹965, upward momentum may continue. Break above ₹975 can open the way toward ₹980+.
Bearish Scenario: If it falls below ₹950, risk increases toward ₹940 – ₹945.
Neutral / Range: Between ₹965 – ₹975, HDFCBANK may consolidate before a directional move.

HDFCBANK 1D Time frame📍 Current Price Action
Current Price: ~₹968
Day Range: ₹960 – ₹975
Trend: Neutral to mildly bullish
⚙ Technical Indicators
RSI (14): ~53 → neutral momentum
MACD: Slightly positive → mild upside bias
ADX (14): ~32 → moderate trend strength
MFI (Money Flow Index): Mid-range → balanced buying/selling pressure
📊 Moving Averages
Short-term (5, 10, 20-day): Price trading above → bullish signals
Medium to Long-term (100, 200-day): Mixed to weak → acting as resistance
📉 Support & Resistance
Immediate Support: ₹960 – ₹965
Next Support Zone: ₹940 – ₹950
Immediate Resistance: ₹970 – ₹975
Next Resistance: ₹985 – ₹990
🧠 Summary
HDFC Bank is in a neutral to mildly bullish zone on the daily chart. Price is holding above short-term averages, but longer-term averages are acting as resistance. If the stock sustains above ₹975, it may move toward ₹985–₹990. Failure to hold ₹960 could drag it toward ₹940–₹950.

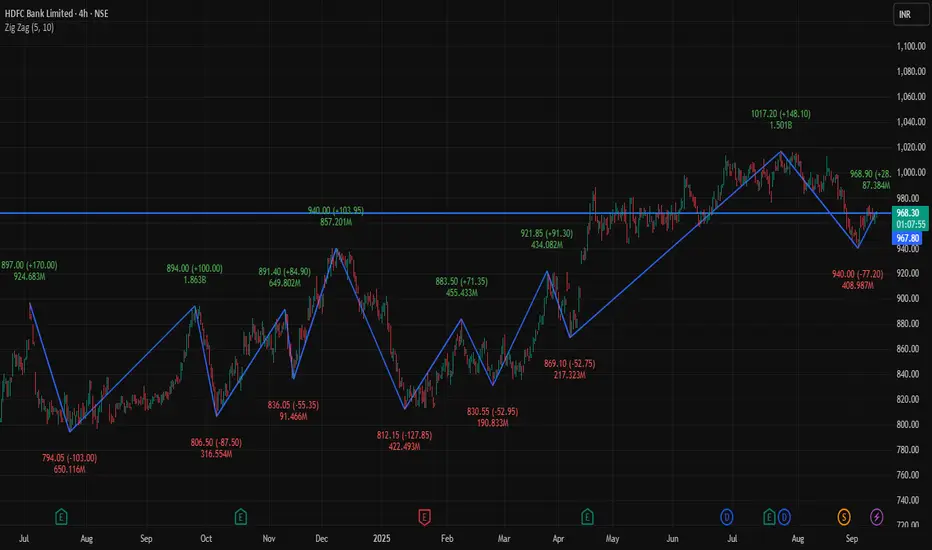
HDFCBANK 4Hour Time frame 📊 Current Snapshot
Current Price: ₹967.95
Day’s Range: ₹959.90 – ₹968.90
Previous Close: ₹965.90
Opening Price (4H): ₹960.30
Volume: Approximately 7.2 million shares
📈 Trend & Indicators
Trend: Neutral to mildly bullish; trading near short-term resistance.
RSI (14): Neutral zone.
MACD: Positive → indicating mild bullish momentum.
Moving Averages: Short-term averages indicate neutral to slightly bullish outlook.
🔮 Outlook
Bullish Scenario: Break above ₹968.90 with strong volume could target ₹975.00.
Bearish Scenario: Drop below ₹960.00 may lead to further decline toward ₹950.00.
Neutral Scenario: Consolidation between ₹960.00 – ₹968.90; breakout needed for directional move.
📌 Key Factors to Watch
Economic Indicators: Interest rates, inflation, and RBI policy updates.
Sector Performance: Trends in the banking sector.
Global Cues: Global market trends, US indices, crude oil, and currency movements.
HDFCBANK 1D Time frameCurrent Price Action
HDFCBANK is trading around ₹962–968.
Day’s low is near ₹960 and high is around ₹978.
The stock is consolidating in a tight range.
⚖️ Key Levels
Immediate Resistance: ₹968 – ₹970
Next Resistance: ₹975 – ₹980
Immediate Support: ₹960
Strong Support: ₹950 – ₹955
📊 Indicators
Moving Averages: Price is below the 50-day MA (short-term weakness) but above the 200-day MA (long-term trend still intact).
RSI (14-day): Around 40–45 → neutral to slightly weak momentum.
MACD: Negative bias, showing limited upside strength.
📈 Outlook
If HDFCBANK stays above ₹960, a bounce toward ₹970 – ₹975 is possible.
A breakout above ₹975 – ₹980 could turn the trend stronger.
If the stock slips below ₹955 – ₹950, it may head lower toward ₹940 – ₹935.
Current bias: Neutral to slightly bearish until price breaks above resistance.
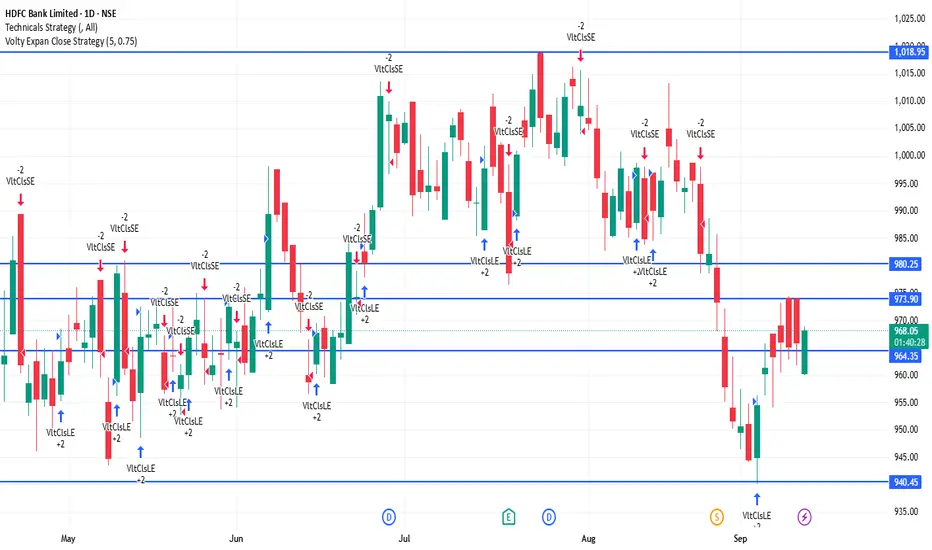
HDFCBANK 1D Time frameCurrent Snapshot
Last Traded Price: ₹965.90
Day’s Range: ₹960.30 – ₹965.65
52-Week Range: ₹806.50 – ₹1,018.85
Market Cap: ₹14.82 lakh crore
Volume: 2.46 million shares
VWAP: ₹962.88
📈 Trend & Indicators
Trend: Neutral to mildly bearish; trading below 50-day and 200-day EMAs.
RSI (14): 48.73 – Neutral; no overbought or oversold signals.
MACD: Positive at +1.19 – Suggests short-term bullish momentum.
Moving Averages: Short-term MAs indicate a neutral to bearish outlook.
🔮 Outlook
Bullish Scenario: Break above ₹965.65 with strong volume could target ₹975–₹980.
Bearish Scenario: Drop below ₹960.30 may lead to further decline toward ₹953–₹955.
Neutral Scenario: Consolidation between ₹960–₹965; breakout needed for directional move.
📌 Key Factors to Watch
Market Sentiment: Broader market movements can influence HDFC Bank's performance.
Economic Indicators: Changes in interest rates or inflation can impact banking stocks.
Company News: Any announcements regarding HDFC Bank's financials or strategic initiatives.

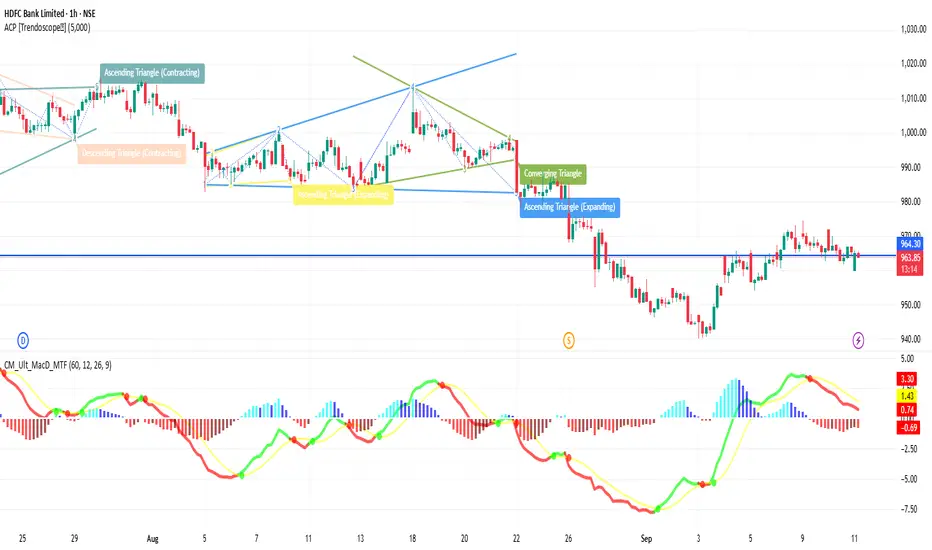
HDFCBANK 1H Time frameKey Price & Market Info
Current Price: ~ ₹960-965
52-Week Range: ~ ₹806 – ₹1,018
Daily Range (recent): roughly between ₹959 – ₹966
🔎 Technical Indicators & Momentum
RSI (14-hour): ~ 42-45 → Neutral to mildly weak
MACD (hourly estimates): Slightly negative → some bearish pressure
ADX (trend strength): Moderate (~20-25) → trend is present but not very strong
Moving Averages:
Short-term (5-10 hour) MAs seem to be acting as minor resistance/support zones near current price
Mid-term MAs (50-hour) are above the price → resistance upward
Long-term support (200-hour MA) is well below current price → that gives some downside cushion
🔧 Support & Resistance (1-Hour)
Immediate Resistance: ~ ₹970-975
Near Resistance Zone: ~ ₹985-₹990
Support Levels: ~ ₹950-₹955 first, then ~₹940 if weakness increases
🧭 Short-Term Outlook
Bullish Case: If price breaks above ~₹970-975 with volume, upward move toward ~₹985+ might be possible.
Bearish Case: Failing resistance and dropping below ~₹950 might test lower support ~₹940.
Overall Bias: Slightly bearish to neutral—more inclined to expect consolidation or minor pullback unless strong upward catalyst appears.
Part 2 Ride The Big Moves Key Option Terms
Understanding option trading requires familiarity with essential terms:
Underlying Asset: The security (stock, index, commodity, currency) on which an option is based.
Strike Price: The pre-decided price at which the underlying asset can be bought or sold.
Expiration Date: The date on which the option contract expires.
Premium: The price paid to purchase the option.
In-the-Money (ITM): Call options where the underlying price > strike price, and put options where the underlying price < strike price.
Out-of-the-Money (OTM): Call options where the underlying price < strike price, and put options where the underlying price > strike price.
At-the-Money (ATM): Strike price is equal or near the underlying asset’s price.
American vs European Options: American options can be exercised anytime before expiration; European options only on the expiration date.
Option Pricing
Option pricing is influenced by several factors. The Black-Scholes Model and Binomial Models are commonly used to calculate theoretical option prices. Major factors include:
Underlying Asset Price: Higher prices increase call option value and decrease put option value.
Strike Price: Determines profitability; the closer to the underlying price, the more valuable an option.
Time to Expiration: Longer duration generally increases option premiums due to higher uncertainty.
Volatility: Higher volatility increases the probability of profitable movements, raising option value.
Interest Rates: Affects the cost of carry and slightly influences options pricing.
Dividends: Expected dividends impact option value, especially for stocks.

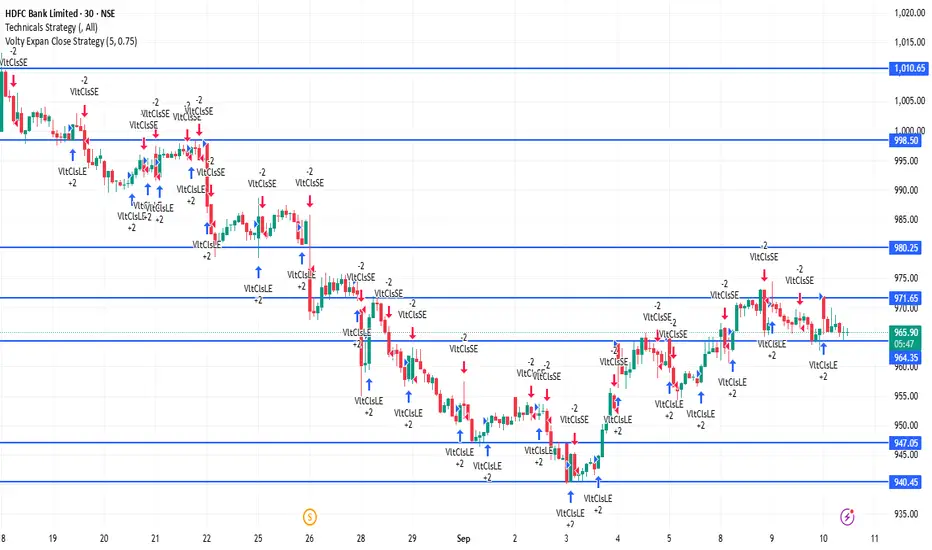
HDFCBANK 30Minutes Time frameHDFC Bank – 30M Important Levels (Current)
These levels are calculated using today’s intraday pivot data and provide reliable reference points for short-term trading.
Pivot Point (Mid-Level): ~₹967
First Resistance (R1): ~₹972
Second Resistance (R2): ~₹979
First Support (S1): ~₹960
Second Support (S2): ~₹955
These intraday pivots help highlight key zones where intra-day price action often stalls, reverses, or accelerates.
Intraday Trend Outlook (30M Chart)
Above ₹972: Bullish momentum may continue, with potential upside toward ~₹979.
Between ₹960 – ₹972: Neutral-to-bullish range; watch for sustain or reversal.
Below ₹960: Bearish pressure may build, potentially testing down to ~₹955.
HDFCBANK 1D Time frame📍 HDFCBANK – 1D Important Levels (Current)
🔹 Support Zones
1,570 – 1,580 → Immediate daily support
1,530 – 1,550 → Strong support; buyers likely to defend this zone
1,480 – 1,500 → Major support; breakdown may shift trend bearish
🔹 Resistance Zones
1,620 – 1,630 → Immediate daily resistance
1,660 – 1,680 → Strong resistance zone
1,720 – 1,740 → Major resistance; breakout here may trigger a bigger rally
⚖️ Daily Trend Outlook
HDFC Bank is currently in a sideways-to-bullish phase on the daily chart.
As long as price holds above 1,570, momentum can stay positive.
A breakout above 1,630 – 1,680 may extend upside towards 1,720 – 1,740.
A breakdown below 1,570 could drag it back to 1,530 – 1,500.
Psychology of Trading1. Introduction: Why Psychology Matters in Trading
Trading is not just about buying low and selling high. It is about making decisions under uncertainty, managing risk, and dealing with constant emotional swings. Unlike traditional jobs where performance is based on effort and skills, trading has an unpredictable outcome in the short term.
You can make a perfect trade setup and still lose money.
You can make a terrible decision and accidentally profit.
This uncertainty creates emotional pressure, leading traders to make irrational decisions. For example:
Selling too early out of fear.
Holding on to losing trades hoping for a reversal.
Over-trading after a big win or loss.
Without strong psychological control, traders often repeat these mistakes. That is why understanding and mastering trading psychology is the real secret to consistent success.
2. Core Emotions in Trading
Emotions are natural, but when unmanaged, they distort judgment. Let’s break down the four main emotions every trader faces:
(a) Fear
Fear is the most common emotion in trading. It shows up in two forms:
Fear of Losing Money – leading to hesitation, missed opportunities, or premature exits.
Fear of Missing Out (FOMO) – jumping into trades too late because others are making money.
Example: A trader sees a stock rallying rapidly and buys at the top out of FOMO. When the price corrects, fear of loss makes them sell at the bottom – a classic cycle.
(b) Greed
Greed pushes traders to take excessive risks, over-leverage, or hold winning positions too long. Instead of following a plan, they chase “unlimited” profits.
Example: A trader who plans for 5% profit refuses to book at target, hoping for 10%. The market reverses, and the profit turns into a loss.
(c) Hope
Hope is dangerous in trading. While hope is positive in life, in markets it blinds traders from reality. Hope makes people hold on to losing trades, ignoring stop-losses, and believing “it will come back.”
Example: A trader buys a stock at ₹500, it falls to ₹450, then ₹400. Instead of cutting losses, the trader “hopes” for recovery and keeps averaging down, often leading to bigger losses.
(d) Regret
Regret comes after missed opportunities or wrong trades. Regret often leads to revenge trading, where traders try to quickly recover losses, usually resulting in even bigger losses.
3. Cognitive Biases in Trading
Apart from emotions, psychology is also influenced by cognitive biases – mental shortcuts that distort rational thinking.
Overconfidence Bias – Believing your strategy is always right after a few wins, leading to careless trading.
Confirmation Bias – Only looking for information that supports your view, ignoring opposite signals.
Loss Aversion – The pain of losing ₹1000 is stronger than the joy of gaining ₹1000. This makes traders hold losers and sell winners too soon.
Anchoring Bias – Relying too heavily on the first price seen, e.g., thinking “I bought at ₹600, so it must go back to ₹600.”
Herd Mentality – Following the crowd without analysis, especially during hype rallies or crashes.
These biases prevent traders from making objective decisions.
4. Mindset of a Successful Trader
Successful traders think differently from beginners. Their mindset is built on discipline, patience, and acceptance of uncertainty. Key elements include:
Process Over Outcome: Focusing on following rules, not immediate profit.
Acceptance of Losses: Treating losses as part of the business, not as personal failure.
Probabilistic Thinking: Understanding that no trade is 100% certain; trading is about probabilities.
Long-Term Focus: Avoiding the need for daily wins, instead building consistent performance over months/years.
Emotional Detachment: Viewing money as “trading capital,” not personal wealth.
5. The Role of Discipline
Discipline is the backbone of trading psychology. Without discipline, even the best strategies fail. Discipline involves:
Following a Trading Plan – entry, exit, stop-loss, risk-reward.
Position Sizing – never risking more than 1-2% of capital on a single trade.
Consistency – sticking to strategy instead of changing methods after every loss.
Patience – waiting for the right setup instead of forcing trades.
Most traders fail not because of bad strategies but because they lack the discipline to follow their strategies.
6. Psychological Challenges in Different Trading Styles
(a) Day Trading
Constant pressure, quick decisions.
High temptation to over-trade.
Emotional exhaustion.
(b) Swing Trading
Requires patience to hold trades for days/weeks.
Fear of overnight risks (gaps, news).
Temptation to check charts every hour.
(c) Long-Term Investing
Emotional difficulty in holding through corrections.
Pressure from news and market noise.
Fear of missing short-term opportunities.
Each style demands a different level of emotional control.
7. Developing Emotional Intelligence for Trading
Emotional Intelligence (EQ) is the ability to understand and manage your emotions. Traders with high EQ can:
Recognize when fear/greed is influencing them.
Pause before reacting emotionally.
Maintain objectivity under stress.
Ways to improve EQ in trading:
Journaling – Writing down emotions and mistakes after each trade.
Mindfulness & Meditation – Helps calm the mind and reduce impulsive decisions.
Detachment from Money – Viewing trades as probabilities, not personal wins/losses.
Visualization – Mentally preparing for both winning and losing scenarios.
8. Risk Management & Psychology
Risk management is not just technical – it is psychological. A trader who risks too much per trade is more likely to panic.
Risk per trade: Max 1–2% of capital.
Use stop-loss orders to remove emotional decision-making.
Diversify to avoid stress from a single bad trade.
When risk is controlled, emotions naturally reduce.
9. Common Psychological Mistakes Traders Make
Overtrading – Trading too often due to excitement or frustration.
Ignoring Stop-Losses – Driven by hope and denial.
Chasing the Market – Entering late due to FOMO.
Revenge Trading – Trying to recover losses aggressively.
Lack of Patience – Jumping in before confirmation.
Ego Trading – Refusing to accept mistakes, trying to “prove the market wrong.”
10. Building Psychological Strength
Practical steps to master trading psychology:
Create a Trading Plan – Define entry, exit, stop-loss, risk-reward.
Keep a Trading Journal – Record reasons, outcomes, and emotions of each trade.
Use Small Position Sizes – Reduce stress by lowering risk.
Practice Visualization – Prepare for losses before they happen.
Regular Breaks – Step away from screens to avoid emotional burnout.
Focus on Process, Not Profit – Judge yourself by discipline, not daily P&L.
Accept Imperfection – No trader wins all trades; consistency matters more than perfection.
Final Thoughts
The psychology of trading is the bridge between knowledge and execution. Thousands of traders know strategies, but only a few succeed because they master their emotions.
To succeed in trading:
Build discipline like a soldier.
Accept uncertainty like a scientist.
Control emotions like a monk.
In short: Trading is less about predicting markets and more about controlling yourself.

Part 6 Learn Institutional Trading Factors Affecting Option Prices
Option premiums are influenced by multiple factors:
Underlying Price: Moves directly impact intrinsic value.
Time to Expiry: Longer duration = higher premium (more time value).
Volatility: Higher volatility = higher premium (more uncertainty).
Interest Rates & Dividends: Minor factors but can influence pricing.
The famous Black-Scholes Model is often used to calculate theoretical option prices.
Basic Option Strategies for Beginners
Here are some simple strategies you can start with:
1. Buying Calls
Use when you expect the stock/index to rise.
Risk: Premium loss.
Reward: Unlimited upside.
2. Buying Puts
Use when you expect the stock/index to fall.
Risk: Premium loss.
Reward: Significant downside profits.
3. Covered Call
Own a stock + Sell a call option on it.
Generates income but caps upside.
4. Protective Put
Buy stock + Buy a put option.
Acts like insurance for your stock portfolio.
5. Straddle (Advanced Beginner)
Buy a call and put with the same strike and expiry.
Profits from big moves in either direction.
Risk: Both premiums lost if market stays flat.

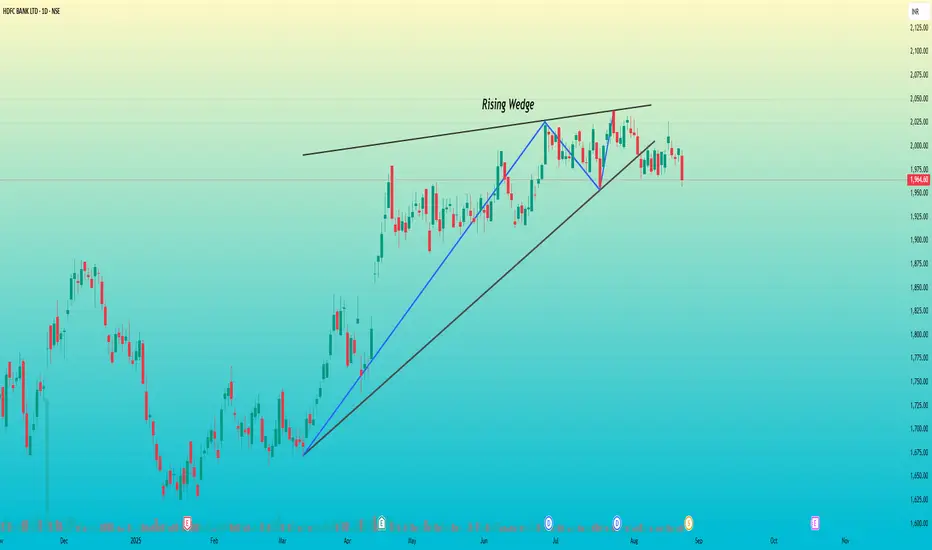
HDFC Bank – Rising Wedge Breakdown Signals Bearish Outlook📊 HDFC Bank Ltd – Daily Chart Analysis
🔹 Pattern Formation
A Rising Wedge pattern has developed on the daily timeframe.
The stock was in a strong uptrend since March, consistently forming higher highs and higher lows.
However, in recent weeks, the price struggled to sustain above the ₹2,025 – ₹2,050 zone, showing signs of exhaustion.
The wedge support has now been broken, with price closing near ₹1,964, confirming weakness.
Noticeable selling volume is accompanying the breakdown, strengthening the bearish case.
Lack of strong buying activity suggests buyers are losing control.
🔹 Key Levels to Watch
Immediate Resistance: ₹2,000 – ₹2,025 (any move above this will invalidate the bearish view).
Immediate Support: ₹1,950-55 (already tested, may break further).
Next Downside Levels: ₹1,925 → ₹1,900 → ₹1,875.
🔹 Trade Plan
📉 Short Bias: Below ₹1,975 with SL above ₹2,025.
🎯 Targets: ₹1,925 / ₹1,900 / ₹1,875.
📈 Invalidation: If price closes above ₹2,025 with strength, wedge breakdown fails and bullish trend may continue.
Entry to Exit: Step-by-Step Trade Management1. Introduction
Trading is not only about finding the right entry point—it’s about how you manage your trade once you’re inside the market. Many beginners spend countless hours searching for the “perfect” entry strategy, but professionals know that trade management is where the real game is won or lost.
Think of trading as a journey. Entry is the start, exit is the destination, and trade management is the road that connects the two. Without proper management, even the best entry signals can turn into losing trades. On the other hand, with disciplined management, even an average entry can become profitable.
In this guide, we’ll break down the entire trade lifecycle—from preparation to execution, from entry to exit—step by step.
2. Pre-Trade Preparation
Before entering a trade, preparation is key. Just like a pilot runs through a checklist before takeoff, a trader should have a trade checklist.
🔹 Market Research & Analysis
Study broader market trends (bullish, bearish, sideways).
Check fundamentals (earnings reports, economic news, sector performance).
Perform technical analysis (support/resistance levels, chart patterns, moving averages).
🔹 Building a Trade Plan
A trade without a plan is like sailing without a map. A strong trade plan includes:
Entry criteria – What signals will you wait for before entering?
Stop-loss level – Where will you cut the trade if it goes against you?
Target level – Where will you take profit?
Position size – How much capital will you risk?
🔹 Defining Risk per Trade
Professional traders don’t risk everything in one trade. A common rule is the 1-2% risk rule. For example:
If you have ₹1,00,000 capital and risk 1% per trade → max loss = ₹1,000.
This ensures survival even after multiple losing trades.
3. Entry Strategies
Your entry is the first step into the battlefield. A good entry maximizes reward while minimizing risk.
🔹 Types of Entries
Breakout Entries – Entering when price breaks a key resistance/support.
Pullback Entries – Waiting for price to retrace to a support/resistance level before entering.
Reversal Entries – Entering when trend shows signs of changing direction.
🔹 Confirmation Tools
Candlestick patterns (engulfing, hammer, doji).
Indicators (RSI for momentum, MACD for trend confirmation).
Volume analysis (rising volume = strong move).
🔹 Avoiding FOMO Entries
Jumping into trades without confirmation leads to poor risk-reward setups. Always stick to your predefined entry signals.
4. Stop Loss & Risk Management
Stop-loss is your insurance policy. Without it, one bad trade can wipe out weeks of profits.
🔹 Types of Stops
Hard Stop – Pre-set level, automatically exits trade.
Mental Stop – Decided in mind, but dangerous if emotions take over.
ATR Stop – Based on volatility (Average True Range).
🔹 Break-Even Adjustment
When trade moves in your favor, shift stop-loss to entry point → removes risk.
🔹 Risk-Reward Ratio (RRR)
Only take trades with minimum 1:2 or 1:3 ratio. Example: risk ₹1,000 for potential ₹2,000–₹3,000 gain.
5. Trade Monitoring & Mid-Trade Adjustments
Once in a trade, your job is to manage it intelligently.
🔹 When Market Moves in Your Favor
Use trailing stop-loss to lock profits.
Scale out gradually (book partial profits at key levels).
🔹 When Market Moves Against You
Never widen stop-loss (it increases risk).
Accept the loss gracefully—capital preservation is priority.
🔹 Scaling In & Out
Scaling in: Add to your position as trade confirms in your favor.
Scaling out: Reduce position gradually, booking partial profits while still staying in.
6. Trade Psychology
Emotions are the biggest enemy of traders. Fear and greed often sabotage good strategies.
🔹 Common Emotional Traps
Fear of Missing Out (FOMO) – Chasing trades without signals.
Fear of Loss – Closing positions too early.
Greed – Holding too long, ignoring exit plan.
🔹 Discipline Rules
Follow your plan, not your emotions.
Accept that losses are part of the game.
Think in terms of probabilities, not certainties.
7. Exit Strategies
A trade is not complete until you exit. Profits exist only when booked.
🔹 Exit Types
Target-Based Exit – Close trade when it hits your planned profit target.
Trailing Stop Exit – Ride trend while protecting profits.
Time-Based Exit – Exit if price doesn’t move within certain time.
🔹 Letting Profits Run
The hardest skill is to hold winners long enough while not giving back gains. Trailing stops help balance safety & profit.
🔹 Avoid Early Exits
Many traders exit too soon because of emotions. Always follow your planned exit rule, not short-term market noise.
8. Post-Trade Review
Every trade—win or lose—is a learning opportunity.
🔹 Trading Journal
Record every trade:
Entry, exit, stop-loss.
Reasons for trade.
Emotions felt.
Lessons learned.
🔹 Review Process
Analyze losing trades → were they due to bad setup or bad discipline?
Analyze winning trades → did you follow your plan, or was it luck?
Constantly refine your strategy.
9. Conclusion
Trade management is the bridge between analysis and profitability. The entry may give you the opportunity, but it’s management that determines the outcome.
Prepare before you trade.
Enter only with clear signals.
Manage risk with position sizing and stop-loss.
Control emotions during the trade.
Exit with discipline.
Learn from every trade.
By mastering trade management, you shift from gambling to professional trading. In the end, trading isn’t about predicting the market perfectly—it’s about managing uncertainty profitably, from entry to exit.
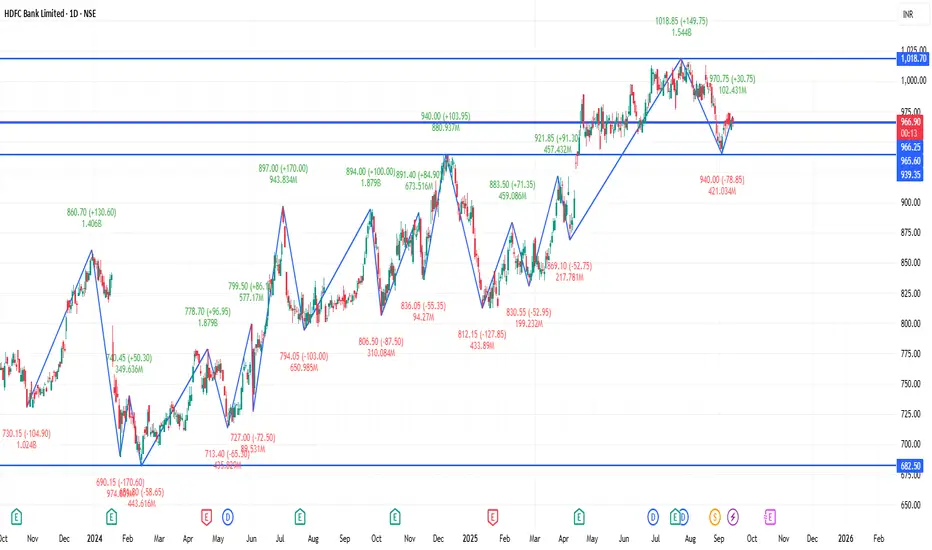
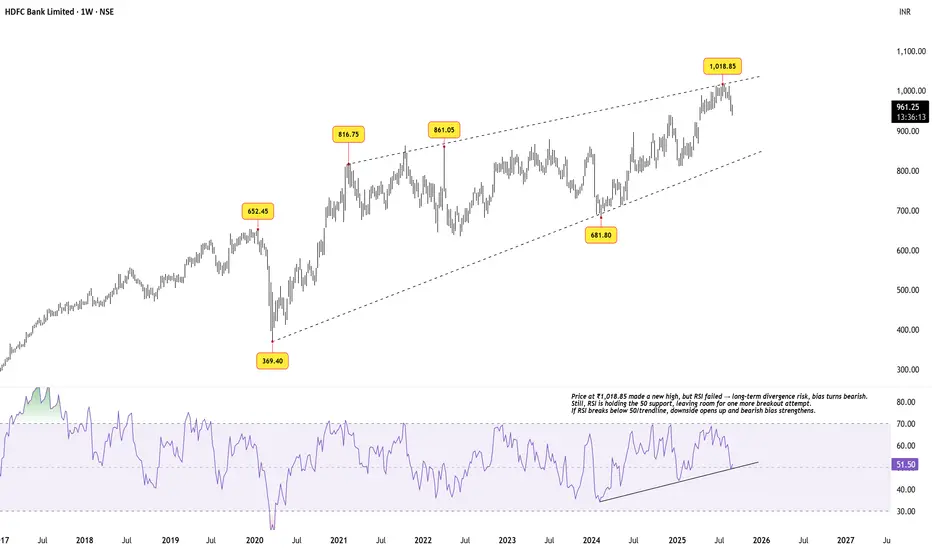
HDFC Bank – Rising Megaphone & RSI DivergencePrice structure since 2020 has unfolded inside a broadening rising channel (megaphone type). The latest high at ₹1,018.85 came right at the upper boundary.
Price action: A fresh high was made, but momentum did not confirm.
RSI: Long-term bearish divergence is visible – each new price high comes with weaker RSI peaks. Still, RSI is holding above the 50 zone and its rising trendline.
Implications:
If RSI holds above 50, bulls may attempt another breakout above ₹1,018.85.
If RSI breaks below 50 and the trendline, the bearish divergence will likely play out with price sliding toward the lower boundary near ₹820–850.
This makes the current zone a make-or-break region for HDFC Bank.
Disclaimer: This analysis is for educational purposes only and does not constitute investment advice. Please do your own research (DYOR) before making any trading decisions.
HDFC BULLISHAMD phase completed AND manipulation phase completed. its time for price distribution
1ST TARGET PRICE = 1013
2ND TARGET EXPECTING = 1130

Option Trading Bull Call Spread (Controlled Bullish Strategy)
Best for: Beginners expecting moderate rise in stock.
Market Outlook: Moderately bullish.
How it works:
Buy a lower strike call.
Sell a higher strike call.
Example:
Nifty at 22,000.
Buy 22,000 call at ₹150.
Sell 22,200 call at ₹80.
Net cost = ₹70.
If Nifty rises to 22,200, max profit = ₹130 (₹200 – ₹70).
Max loss = ₹70 (if Nifty stays below 22,000).
✅ Pros: Limited risk, limited reward.
❌ Cons: Not suitable if stock rises sharply.
Bear Put Spread (Controlled Bearish Strategy)
Best for: Beginners expecting moderate fall in stock.
Market Outlook: Moderately bearish.
How it works:
Buy a higher strike put.
Sell a lower strike put.
Example:
Nifty at 22,000.
Buy 22,000 put at ₹160.
Sell 21,800 put at ₹90.
Net cost = ₹70.
If Nifty falls to 21,800, max profit = ₹130.
Max loss = ₹70.
✅ Pros: Controlled loss, cheaper than naked put.
❌ Cons: Profit capped.

Bounce or Breakdown? HDFC Bank at Crucial Support BandHDFC Bank has been under sustained pressure over the past few sessions, reflecting both stock-specific concerns and broader market volatility. The stock has failed to participate meaningfully in the recent market upmove, which highlights underlying weakness in its structure. Selling pressure has intensified, and price action shows that the stock is struggling to hold above key support zones.
At present, HDFC Bank is trading around a crucial support band of ₹950–₹940. This zone has historically acted as an important demand area, where buyers have stepped in to defend the price. However, the inability of the stock to bounce strongly from this range in recent days raises caution.
A decisive breakdown below ₹940 may trigger further weakness, opening the door for a slide toward ₹930, ₹900, and even ₹870 levels in the near term. These levels are important psychological and technical supports, and a test of them cannot be ruled out if selling continues.
Overall, unless the stock manages to sustain and bounce above ₹950 with strong volumes, the undertone remains weak. The coming sessions will be crucial to determine whether HDFC Bank stabilizes at this support zone or extends its downtrend.

PSU & Infrastructure RallyIntroduction
The Indian stock market often moves in cycles—sometimes technology stocks lead, sometimes consumption stocks take the front seat, and sometimes financials dominate the headlines. In recent years, one of the strongest and most eye-catching trends has been the rally in Public Sector Undertakings (PSUs) and Infrastructure stocks.
This rally has surprised many investors. For decades, PSU stocks were treated as “slow movers,” known for dividends but not for sharp price appreciation. Infrastructure companies also had their share of challenges—debt burdens, project delays, and regulatory hurdles. Yet, from 2020 onwards, both these sectors have staged a powerful comeback, creating significant wealth for investors.
In this essay, we will break down the reasons behind the PSU & Infrastructure rally, the role of government policies, investor psychology, macroeconomic conditions, and future outlook. We will also examine challenges, risks, and strategies investors can consider.
1. Understanding PSU & Infrastructure Sectors
1.1 What are PSUs?
Public Sector Undertakings (PSUs) are companies where the Government of India holds a majority stake (usually above 51%). These companies were originally created to control strategic industries, ensure employment, and provide services to the public.
They operate across sectors:
Energy & Oil: ONGC, Oil India, IOC, BPCL, HPCL.
Banking & Financials: SBI, Bank of Baroda, PNB, LIC.
Power & Utilities: NTPC, Power Grid, NHPC, SJVN.
Defence & Engineering: HAL, BEL, BEML, Cochin Shipyard.
Infrastructure-linked: IRCTC, IRFC, RVNL, NBCC.
For a long time, PSU stocks were considered "value traps." Investors believed these companies were controlled by government decisions rather than pure profit motives. But things have started to change.
1.2 What is the Infrastructure Sector?
The infrastructure sector includes companies involved in building and maintaining physical systems like roads, railways, airports, ports, bridges, housing, water supply, and energy projects.
Key players include:
Construction companies: L&T, NCC, KNR Construction.
Railways & Transport: RVNL, IRCON, IRFC.
Power & Energy Infrastructure: NTPC, Adani Transmission, Power Grid.
Cement & Steel (linked to infra growth): UltraTech Cement, JSW Steel.
Infrastructure is often called the backbone of the economy. A country’s GDP growth depends heavily on the quality of its infrastructure.
2. Why Are PSU & Infrastructure Stocks Rallying?
The rally is not a coincidence. Several structural, policy-driven, and global factors are working together. Let’s break them down:
2.1 Government Push on Capital Expenditure (Capex)
One of the biggest drivers is the Indian government’s consistent increase in infrastructure spending.
In Union Budgets (2022–2025), capital expenditure has grown at double-digit rates.
The government has allocated massive funds for roads, highways, railways, and renewable energy.
The National Infrastructure Pipeline (NIP) plans ₹111 lakh crore investment in infrastructure between 2019 and 2025.
Programs like Gati Shakti, Smart Cities Mission, and Bharatmala are boosting construction activity.
This creates a multiplier effect: cement demand rises, construction companies get more projects, railway stocks gain, and PSU banks benefit by financing these projects.
2.2 Revival of PSU Banks
PSU banks, once seen as weak due to Non-Performing Assets (NPAs), have staged a dramatic recovery.
Bad loans have reduced significantly.
Credit growth is at record highs (double-digit growth in 2023–25).
PSU banks are reporting all-time high profits.
With financial health improving, investors’ confidence in PSUs has returned.
Since banks are the backbone of financing infrastructure projects, their revival further fuels the rally.
2.3 Defence & Strategic Importance
Global geopolitical tensions have increased defence spending worldwide. India, too, is focusing on self-reliance in defence (Atmanirbhar Bharat).
Companies like HAL, BEL, Mazagon Dock, Cochin Shipyard have seen massive order inflows.
Defence PSUs are reporting strong earnings and full order books for the next decade.
The export market is also opening up—India is now exporting defence equipment to friendly nations.
This has turned defence PSUs into multi-baggers in recent years.
2.4 Disinvestment & Privatisation Story
For years, the government has been trying to monetise and privatise PSU assets.
Strategic sales like Air India have boosted sentiment.
LIC IPO brought renewed attention to PSU space.
The market believes future disinvestments (BPCL, Shipping Corporation, etc.) can unlock hidden value.
This narrative has created speculative interest, which supports price rallies.
2.5 Dividend Yield Attraction
Many PSU companies offer very high dividend yields (4–8%), much higher than bank deposits.
In times of global uncertainty, foreign investors look for safe, stable income—PSUs fit this profile. When combined with growth in earnings, dividend-paying PSUs become doubly attractive.
2.6 Railways & Infra Boom
Railway-linked stocks like RVNL, IRCON, IRFC, RailTel have been some of the biggest gainers.
Indian Railways is undergoing modernization at an unprecedented scale.
Projects like Vande Bharat trains, electrification, freight corridors, and station redevelopment are attracting massive investments.
These companies are reporting record order books.
This has triggered a railways mini-rally within the broader infrastructure rally.
2.7 Global Factors
Global trends are also playing a role:
China+1 Strategy: Many global companies are diversifying away from China, boosting demand for Indian infrastructure.
Commodity Cycle: Steel, cement, and energy cycles support infra companies’ growth.
Geopolitical Risks: Investors view India as a safe growth story compared to volatile markets.
3. Investor Psychology Behind the Rally
The PSU & Infrastructure rally is not just about fundamentals—it’s also about changing perceptions.
Earlier: Investors believed PSUs = inefficient + slow-moving.
Now: Investors see them as undervalued, dividend-paying, and backed by government growth plans.
Retail investors, especially in India, have driven momentum. With railway and defence PSUs showing 10x to 20x returns in a few years, fear of missing out (FOMO) has pulled in more buyers.
4. Risks & Challenges in PSU & Infra Rally
No rally is risk-free. Investors must remain aware of challenges:
Government Interference – PSU companies may prioritize social objectives over profits.
Cyclical Nature – Infra and PSU rallies depend heavily on government spending; if budgets tighten, growth may slow.
Execution Delays – Infra projects face land acquisition, legal, and environmental delays.
Global Slowdown – If global demand weakens, exports and commodity-linked infra stocks may suffer.
Valuation Concerns – Many PSU stocks have already rallied 200–500%. At some point, valuations may look stretched.
5. Future Outlook
Despite risks, the outlook for PSU & Infrastructure remains structurally positive:
India aims to become a $5 trillion economy—this is impossible without strong infra.
The government’s focus on Make in India, Atmanirbhar Bharat, and Defence exports supports PSU companies.
Digital infrastructure (5G rollout, Smart Cities) creates new opportunities.
Renewable energy push (solar, wind, hydro) benefits power PSUs like NTPC, NHPC.
In short, this is not just a short-term rally—it is a structural growth story with long-term potential.
6. How Investors Can Approach This Rally
For investors, the key is to approach with strategy and caution:
Focus on Leaders – Instead of chasing every PSU, stick to strong companies with robust fundamentals (SBI, NTPC, BEL, HAL, RVNL, L&T).
Look for Long-Term Themes – Defence, railways, power transmission, renewable energy are structural stories.
Dividend + Growth Combo – PSUs with both high dividend yields and growth potential are safer bets.
Avoid Overvaluation – Don’t enter after massive rallies; wait for corrections.
Diversify – Mix infra PSUs with private players (like L&T, Adani Ports) to reduce risk.
7. Case Studies of Recent Winners
7.1 Hindustan Aeronautics Ltd (HAL)
Once ignored, HAL is now a defence giant with export opportunities.
Stock has given 10x returns in 5 years.
7.2 Rail Vikas Nigam Ltd (RVNL)
Benefited from railway modernization.
Stock surged over 20x from 2020–2025.
7.3 SBI & Other PSU Banks
Recovered from NPAs.
Posting record profits, stock prices doubled/tripled.
7.4 NTPC & Power Grid
Benefiting from India’s massive renewable energy targets.
Stable dividend + growth.
These examples show why the rally has captured public attention.
8. Conclusion
The PSU & Infrastructure Rally is one of the most defining themes in the Indian stock market in recent years. What began as a quiet recovery in undervalued PSU banks and infra companies has turned into a full-blown rally fueled by:
Government capex push,
Defence modernization,
Railway expansion,
Revival of PSU banks,
Strong dividend yields,
Disinvestment hopes.
The rally has redefined investor sentiment towards PSUs, turning them from neglected assets into market favorites.
That said, investors must remain mindful of risks—government policies, project delays, or global slowdowns can temporarily derail the momentum.
But structurally, the story remains strong: India’s journey to a $5 trillion economy cannot happen without PSU & infrastructure growth. For long-term investors, this space offers both stability and growth potential—a rare combination.