STOCK SPLIT EFFECT IN THE MARKETHDFC is high weightage stock in nifty50 and bank nifty so market turn bearish ...but this is temporary because still in demand zone ...long time holder buy some stocks its right time to buy
Trade ideas

Common Mistakes New Traders Make1. Jumping into Trading Without Education
Many beginners dive into trading after watching a few YouTube videos, following tips from social media, or hearing success stories of others. But trading isn’t about luck — it’s about skill, discipline, and strategy.
Mistake: Believing trading is just buying low and selling high.
Reality: Trading requires understanding technical analysis, risk management, psychology, and market structure.
Example: A new trader hears about a stock that doubled in a week. They buy without research, but by the time they enter, the stock has already peaked. The price crashes, and they lose money.
Solution: Treat trading like a profession. Just as a doctor or engineer studies for years, a trader needs structured learning — books, courses, simulations, and practice before putting real money at risk.
2. Trading Without a Plan
Imagine playing a cricket match without a game plan — chaos is guaranteed. Similarly, trading without a clear plan leads to impulsive decisions.
Mistake: Buying and selling based on emotions or news without rules.
Reality: Successful traders have a written trading plan that defines entries, exits, position size, and risk per trade.
Example: A beginner sees a stock rising sharply and enters. But when it drops, they don’t know whether to cut losses or hold. Confusion results in bigger losses.
Solution: Build a trading plan that answers:
What markets will I trade?
What timeframes will I use?
What setups will I look for?
How much capital will I risk?
When will I exit with profit/loss?
3. Overtrading
New traders often fall into the trap of taking too many trades, thinking more trades mean more profits. In reality, overtrading drains both money and mental energy.
Mistake: Trading every small market move, chasing excitement.
Reality: Professional traders wait patiently for high-probability setups.
Example: A trader makes 15 trades in a single day, paying high brokerage and making impulsive decisions. Even if a few trades win, commissions and losses wipe out gains.
Solution: Quality over quantity. Focus on one or two good setups a day/week instead of chasing every move.
4. Lack of Risk Management
This is perhaps the biggest mistake new traders make. They risk too much on a single trade, hoping for quick riches.
Mistake: Betting 30–50% of capital on one stock/option.
Reality: Risk per trade should usually be 1–2% of total capital.
Example: A trader with ₹1,00,000 puts ₹50,000 into one stock. The stock falls 20%, wiping out ₹10,000 in one trade. After a few such losses, the account is destroyed.
Solution: Use stop-loss orders, risk only small amounts per trade, and accept losses as part of the game.
5. Revenge Trading
After a loss, beginners often feel the need to “make back money quickly.” This emotional reaction leads to revenge trading — entering bigger trades without logic.
Mistake: Trading emotionally after a loss.
Reality: Losses are normal; chasing them increases damage.
Example: A trader loses ₹5,000 in the morning. Angry, they double their position size in the next trade. The market goes against them again, and they lose ₹15,000 more.
Solution: Step away after a loss. Review what went wrong. Never increase position size just to recover money.
6. Lack of Patience
Trading rewards patience, but beginners crave fast profits. They exit winners too early or hold losers too long.
Mistake: Taking profits too soon, cutting winners; holding losers, hoping they turn.
Reality: Let profits run, cut losses quickly.
Example: A stock moves up 2%, and the trader books profit, missing a 10% rally. But when a trade goes down 5%, they refuse to sell, and the loss grows to 20%.
Solution: Trust your trading system. Follow stop-loss and target levels.
7. Following Tips & Rumors
Many new traders blindly follow WhatsApp tips, Twitter posts, or “friend’s advice” without analysis.
Mistake: Relying on others for buy/sell calls.
Reality: Tips may work occasionally but are not reliable long-term.
Example: A trader buys a “hot stock” from a group. The stock spikes briefly but crashes because big players offload positions.
Solution: Do your own research. Build conviction based on analysis, not rumors.
8. Ignoring Trading Psychology
The market is a battle of emotions — fear, greed, hope, and regret. Beginners often underestimate psychology.
Mistake: Thinking trading is 100% about strategy.
Reality: Psychology is often more important than strategy.
Example: Two traders have the same system. One sticks to rules, the other panics and exits early. The disciplined trader profits; the emotional one doesn’t.
Solution: Practice emotional control. Meditation, journaling, and self-awareness help.
9. No Record Keeping
Many beginners don’t track their trades, so they repeat mistakes.
Mistake: Trading without keeping a log.
Reality: A trading journal reveals strengths and weaknesses.
Example: A trader keeps losing in intraday trades but doesn’t realize it because they don’t track results.
Solution: Maintain a trading journal with details: entry, exit, reason for trade, result, and lessons learned.
10. Unrealistic Expectations
Movies, social media, and success stories create a false impression of overnight riches. Beginners expect to double their account in weeks.
Mistake: Believing trading is a shortcut to wealth.
Reality: Trading is a long-term skill, and returns grow with discipline.
Example: A trader starts with ₹50,000 and expects to make ₹10,000 a day. They take huge risks, lose capital, and quit.
Solution: Aim for consistent small profits. Even 2–3% monthly growth compounds into wealth.
11. Poor Money Management
Beginners often don’t allocate capital wisely. They put most money in risky trades, leaving nothing for better opportunities.
Solution: Diversify across trades, keep emergency funds, and never put all money into one asset.
12. Not Understanding Market Conditions
Markets change — trending, ranging, or volatile. Beginners apply the same strategy everywhere.
Example: A breakout strategy may work in trending markets but fail in sideways ones.
Solution: Learn to read market context (volume profile, trend, volatility). Adapt strategies accordingly.
13. Overconfidence After Wins
A few successful trades can make beginners feel invincible. They increase position sizes drastically, only to face big losses.
Solution: Stay humble. Stick to your plan regardless of wins or losses.
14. Fear of Missing Out (FOMO)
FOMO is powerful in trading. Beginners see a stock rallying and jump in late, only to catch the top.
Solution: Accept that missing trades is normal. The market always offers new opportunities.
15. Lack of Continuous Learning
Markets evolve. Strategies that worked last year may fail now. Beginners often stop learning after early success.
Solution: Keep learning — read books, backtest strategies, and follow market news.
16. Mixing Investing with Trading
Beginners often hold losing trades, calling them “long-term investments.” This blurs strategy.
Solution: Separate trading and investing accounts. Stick to timeframes and plans.
17. Ignoring Risk-Reward Ratio
Many beginners take trades where the potential reward is smaller than the risk.
Example: Risking ₹1,000 for a possible profit of ₹200. Even if right most times, losses eventually dominate.
Solution: Take trades with at least 1:2 or 1:3 risk-reward ratio.
18. Not Practicing in Simulation
Jumping into live markets without demo practice is costly.
Solution: Use paper trading or demo accounts first to build skills without losing money.
19. Not Respecting Stop-Loss
Beginners often remove or widen stop-losses, hoping the trade will reverse.
Solution: Treat stop-loss like a safety belt. It protects you from disasters.
20. Quitting Too Soon
Many traders quit after a few losses, never giving themselves a chance to grow.
Solution: Accept that trading mastery takes years. Losses are tuition fees for market education.
Conclusion
Trading is not a sprint but a marathon. Almost every beginner repeats these mistakes: overtrading, poor risk management, revenge trading, following tips, and ignoring psychology. The good news is that mistakes are stepping stones to mastery — if you learn from them.
By approaching trading with education, discipline, patience, and humility, new traders can avoid the traps that wipe out most beginners and build a path toward consistent profits.

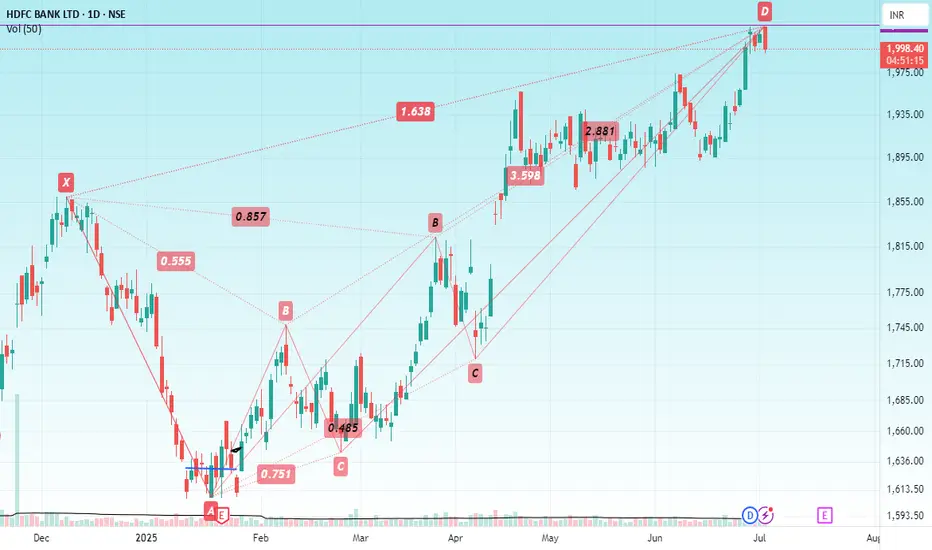
HDFC BANKHello & welcome to this analysis
It has made double bearish Harmonic patterns at the same PRZ level - Crab & Deep Crab in the daily time frame with so far today's candle being an Open = High in daily time frame.
A retracement till 1950 - 1875 could be possible as long as the stock does not cross 2050.
A heavyweight in both Nifty & Bank Nifty, it could halt the uptrend of both the indexes either till it does not complete its pullback or the patterns get negated.
All the best
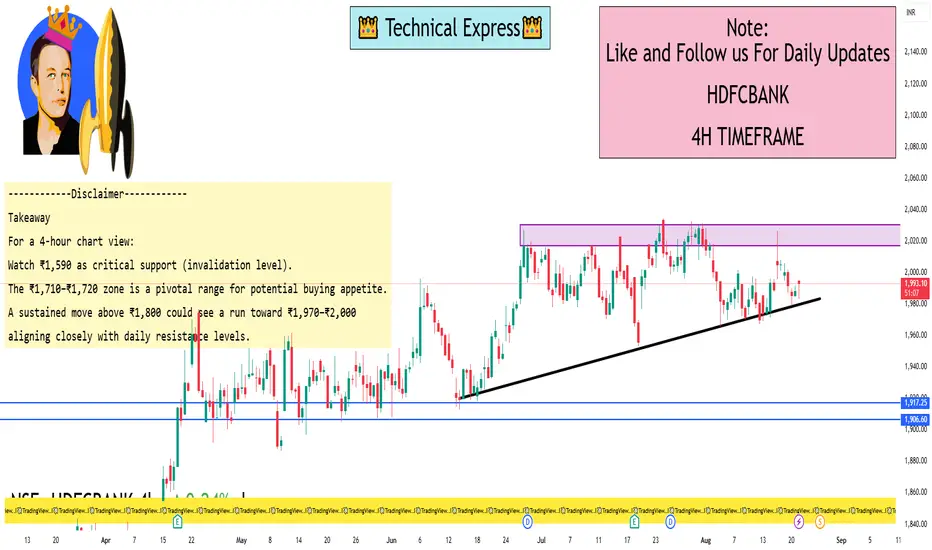
HDFC Bank 4 Hour ViewCurrent Price (Pre-Opening): ₹1,992.60 (an increase of 4.40, or 0.22%)
Previous Close: ₹1,988.20
Day’s Range: ₹1,983.20 – ₹1,997.50
52-Week Range: ₹1,613.00 – ₹2,037.70
4-Hour Time-Frame Levels (Support & Resistance)
While I couldn’t find a source specifically providing 4-hour timeframe levels for HDFC Bank, here's a useful Elliott Wave–based analysis on the 4-hour chart for guidance:
Support (Invalidation Level): ₹1,590 — if the stock dips below this, the current wave structure may be negated.
Key Pivot Zone: ₹1,710–₹1,720 — around here, bulls might regain control.
Upside Target: Break above ₹1,800 could trigger accelerated upward momentum, with a broader move toward ₹1,970–₹2,000 in progress.
Interpretation & Strategy Implications
Key short-term support lies near ₹1,590. A break below this invalidates the bullish wave setup and warrants caution.
If the stock holds above ₹1,710–₹1,720, buyers could step in, leading to upward momentum toward and beyond ₹1,800.
Daily resistance zones:
Immediate resistance: ₹2,030
Momentum breakout zone: ₹2,050
Major resistance: ₹2,100
Takeaway
For a 4-hour chart view:
Watch ₹1,590 as critical support (invalidation level).
The ₹1,710–₹1,720 zone is a pivotal range for potential buying appetite.
A sustained move above ₹1,800 could see a run toward ₹1,970–₹2,000, aligning closely with daily resistance levels.
Stock Market & Trading Basics1. What is a Stock Market?
At its core, a stock market is a place where people buy and sell ownership of companies. When you buy a share, you are literally buying a tiny piece of that company. If the company grows, you benefit through price appreciation and dividends. If it fails, you share the loss.
Think of it as a giant marketplace – just like a vegetable market. Instead of potatoes and onions, here you trade shares of companies like Reliance, Infosys, or TCS.
The purpose of a stock market is simple:
Companies raise money for growth.
Investors get a chance to grow their wealth.
It is essentially a bridge between businesses and investors.
2. History and Evolution of Stock Markets
The concept of stock trading is centuries old.
The Amsterdam Stock Exchange (1602) is considered the world’s first official stock exchange, started by the Dutch East India Company.
In the U.S., the New York Stock Exchange (NYSE) was founded in 1792 under the famous “Buttonwood Agreement.”
In India, the Bombay Stock Exchange (BSE) was established in 1875, making it Asia’s oldest stock exchange. Later, the National Stock Exchange (NSE) launched in 1992, which brought electronic trading to India.
Over time, trading shifted from open outcry (shouting bids in trading pits) to today’s electronic screen-based trading where a smartphone is enough to trade.
3. Why Do Companies List Their Shares?
A company can grow in two ways:
Take loans from banks.
Raise money from investors by selling ownership (shares).
When a company issues shares for the first time through an IPO (Initial Public Offering), it becomes “listed” on a stock exchange. Once listed, anyone can buy or sell those shares.
Advantages for companies:
Easy access to large funds.
Increases credibility and brand value.
Provides liquidity to early investors.
4. How Investors Participate in the Market
Investors participate by opening a Demat and Trading Account with a broker (like Zerodha, Upstox, Angel One, etc.).
Trading Account = to buy/sell.
Demat Account = to store shares digitally (like a bank account for stocks).
Example: If you buy 10 shares of Infosys, they’ll reflect in your Demat account, and you can sell anytime through your trading account.
5. Primary Market vs Secondary Market
Primary Market → Where companies issue new shares via IPOs. Example: LIC IPO in India (2022).
Secondary Market → Where investors trade already issued shares. Example: Buying/selling Infosys shares daily on NSE.
In simple terms:
Primary = company → investor.
Secondary = investor → investor.
6. Key Stock Market Participants
The market has different types of players:
Retail Investors → Normal individuals like us.
Domestic Institutional Investors (DII) → Indian mutual funds, insurance companies.
Foreign Institutional Investors (FII) → Big international funds investing in India.
Market Makers / Brokers → Provide liquidity by facilitating trades.
Regulators (SEBI in India, SEC in USA) → Ensure fair play.
7. Basic Market Terminology
Some must-know terms:
Bull Market → Rising market.
Bear Market → Falling market.
Blue-chip stocks → Large, stable companies like TCS, Infosys.
Market Capitalization = Share Price × Total Shares.
Dividend = Profit sharing by company to shareholders.
Volume = Number of shares traded.
8. Types of Trading
Delivery Trading – Buy today, hold as long as you want.
Intraday Trading – Buy and sell on the same day.
Futures & Options (F&O) – Derivatives trading, betting on price movements without owning stock.
Commodities Trading – Gold, silver, crude oil.
Currency Trading – Forex pairs like USD/INR.
9. Understanding Indices
Indices are like “thermometers” of the stock market.
Sensex (BSE, 30 companies) → Oldest Indian index.
Nifty 50 (NSE, 50 companies) → Most popular benchmark in India.
Dow Jones (USA), S&P 500, Nasdaq → Global indices.
If Nifty is up, it usually means the overall market is healthy.
10. Market Orders
Different ways to buy/sell stocks:
Market Order – Execute instantly at current price.
Limit Order – Execute only at a specific price you set.
Stop Loss Order – Automatically sell if price falls below your set limit (risk management).
11. Stock Market Instruments
Equity Shares
Bonds / Debentures
Mutual Funds / ETFs
Derivatives (Futures, Options)
Commodities
Currencies
Each instrument has its own risk-return profile.
12. How Prices Move
Stock prices are driven by:
Demand & Supply → More buyers than sellers = price goes up.
News & Events → Quarterly results, elections, wars, etc.
Investor Sentiment → Greed vs fear.
13. Role of Regulators
In India, SEBI (Securities and Exchange Board of India) regulates markets.
Protects investors.
Ensures transparency.
Monitors insider trading and scams.
14. Trading Basics: Technical vs Fundamental Analysis
Fundamental Analysis → Studying a company’s financials, balance sheet, profits, growth potential. (Long-term investing).
Technical Analysis → Studying price charts, patterns, indicators (RSI, MACD, Moving Averages) to predict short-term moves.
Most traders use a mix of both.
15. Popular Trading Styles
Scalping → Very quick trades, seconds to minutes.
Intraday Trading → Same-day trading.
Swing Trading → Holding for days/weeks.
Position Trading → Holding for months/years.
Long-term Investing → Buy and hold for wealth creation.
Conclusion & Future of Trading
The stock market is not a casino – it is a platform for wealth creation. Yes, risks exist, but with the right knowledge, discipline, and strategy, it can be one of the most rewarding journeys.
The future of trading will be AI-driven, with algorithms, data analytics, and global connectivity shaping markets. But the basics – demand, supply, psychology – will always remain the same.
HDFC short term bullishHDFC 1991 - A short term bullishness is visible in HDFC chart as indicator is positively diverged
Resistance at 2018-2021
Support 1986.

Inflation & Market Performance (2025 Context)1. Introduction
Inflation has always been one of the most critical variables in shaping market performance. It affects everything — from consumer spending and corporate profits to central bank policies and stock valuations. In 2025, inflation continues to remain a hot topic across global economies, especially after the turbulent years of post-pandemic recovery, geopolitical conflicts, energy shocks, and monetary tightening cycles.
Markets don’t react to inflation in isolation; they respond to expectations about inflation, interest rates, and growth. While mild inflation is seen as healthy, runaway inflation or deflation can shake investor confidence and distort asset pricing.
In this article, we will explore:
The nature of inflation in 2025 and its drivers.
How inflation influences stock markets, bond markets, commodities, and currencies.
Sector-wise winners and losers in high/low inflation scenarios.
The interplay of central bank policies and investor psychology.
India’s inflation-market dynamics in 2025 compared with global trends.
Long-term structural themes in inflation-linked market performance.
2. Inflation Basics: Why It Matters
Before we dive into the 2025 context, let’s refresh the basics.
Definition: Inflation is the sustained rise in the general price level of goods and services.
Measurement: Typically measured via CPI (Consumer Price Index), WPI (Wholesale Price Index), or PCE (Personal Consumption Expenditure index in the US).
Causes:
Demand-pull inflation (too much demand chasing limited supply).
Cost-push inflation (higher input costs like wages, oil, commodities).
Built-in inflation (expectations embedded into wage-price cycles).
Why markets care about inflation:
Corporate Earnings: Rising costs squeeze profit margins.
Interest Rates: Central banks raise rates to tame inflation, making borrowing costlier.
Bond Yields: Higher inflation reduces the real return on fixed-income instruments.
Valuations: Equity valuations (P/E ratios) decline as discount rates rise.
Sector Rotation: Some sectors thrive in inflation (commodities, energy), while others suffer (tech, consumer discretionary).
In short, inflation is a valuation driver, a sentiment shaper, and a policy trigger.
3. The Global Inflation Landscape in 2025
3.1 Post-Pandemic Normalization
The pandemic years (2020–2022) created supply chain disruptions, leading to soaring prices. By 2023–2024, central banks aggressively raised rates (US Fed, ECB, RBI) to cool inflation. By 2025, inflation rates in developed economies are lower than peak levels but remain sticky — slightly above central bank comfort zones.
US Inflation (2025): Moderated to ~3% but stubborn in services and housing.
Eurozone: Around 2.5%, with energy still a risk due to geopolitical tensions.
India: CPI hovering around 4.5–5.5%, close to RBI’s comfort band but sensitive to food and fuel shocks.
Emerging Markets: More volatile inflation, often linked to currency weakness and commodity imports.
3.2 Key Drivers in 2025
Energy Prices: Oil & natural gas remain unpredictable due to Middle East tensions and Russia-Ukraine war aftershocks.
Climate Events: Erratic monsoons, floods, and heatwaves impact agricultural output (food inflation).
Geopolitical Fragmentation: Supply chain re-shoring, trade restrictions, and technology export controls add structural cost pressures.
Wages: Labor markets are tight, especially in tech and healthcare, adding wage-push inflation.
In essence, inflation in 2025 is not runaway like 2022, but sticky, uneven, and multi-speed across regions.
4. Inflation and Stock Market Performance
4.1 General Market Trends
Mild Inflation (2–3%): Markets usually perform well, as it signals healthy growth.
Moderate Inflation (3–5%): Mixed market performance — cost pressures vs. growth optimism.
High Inflation (>6%): Equity markets usually decline, except for inflation-hedge sectors.
4.2 Sectoral Winners in 2025
Energy & Commodities:
Oil, gas, metals tend to rise with inflation.
Companies in these sectors enjoy pricing power.
Banks & Financials:
Benefit from higher interest margins when rates rise.
Loan growth might slow, but profitability improves.
FMCG & Consumer Staples:
Can pass on costs to consumers, maintaining margins.
Defensive demand makes them stable.
Real Estate & Infrastructure:
Tangible assets act as inflation hedges.
However, sensitive to interest rates.
4.3 Sectoral Losers in 2025
Technology & Growth Stocks:
High valuations get compressed under rising discount rates.
Investors shift to value/cyclical stocks.
Consumer Discretionary:
Higher inflation erodes consumer purchasing power.
Luxury goods and non-essentials see demand contraction.
Bond-Proxies (Utilities, REITs):
Lose appeal as bond yields rise.
Higher financing costs hurt profitability.
5. Inflation and Bond Markets
Bond markets are directly linked to inflation expectations.
Nominal Bonds: Inflation erodes real returns, leading to higher yields.
Inflation-Indexed Bonds (TIPS in the US, IIBs in India): Demand rises when inflation uncertainty increases.
Yield Curve:
Flattening or inversion signals that markets expect inflation to cool and growth to slow.
Steepening suggests prolonged inflation risks.
In 2025, bond yields are high compared to the pre-pandemic era, reflecting elevated risk premiums. Institutional investors are diversifying between nominal and inflation-linked bonds.
6. Inflation and Commodities
Commodities are direct beneficiaries of inflation.
Gold & Silver: Classic safe havens. In 2025, gold trades strong due to persistent inflation fears and central bank buying (especially by China & India).
Oil & Gas: Sensitive to geopolitical disruptions; higher prices fuel inflation.
Agricultural Commodities: Climate shocks and supply-chain fragmentation keep food prices elevated.
Thus, commodity cycles are tightly interwoven with inflation, making them critical for portfolio diversification.
7. Inflation and Currencies
Currencies react strongly to inflation differentials.
High inflation, weak currency: Investors dump the currency (e.g., Turkey, Argentina).
Controlled inflation, stable currency: Boosts investor confidence.
In 2025:
US Dollar (USD): Stronger compared to EM currencies due to sticky inflation and Fed’s restrictive stance.
Indian Rupee (INR): Relatively stable but under pressure when oil surges.
Euro (EUR): Mixed performance; energy dependency makes inflation management tricky.
Yen (JPY): Weak due to ultra-loose monetary policy, despite global inflation trends.
8. Central Banks and Inflation Control
8.1 Federal Reserve (US)
The Fed remains cautious in 2025. It cannot cut rates too aggressively as inflation is not fully tamed. Markets closely track every FOMC meeting, as Fed policy guides global liquidity.
8.2 Reserve Bank of India (RBI)
RBI balances inflation control with growth support. India’s food inflation remains a challenge, but structural reforms, better forex reserves, and stable inflows help anchor market confidence.
8.3 European Central Bank (ECB) & Others
ECB faces a tough balancing act — weak growth but still above-target inflation. Other central banks (BoE, BoJ) adopt diverse stances depending on domestic pressures.
9. Investor Psychology in Inflationary Times
Markets are not just numbers; they’re a reflection of human behavior. Inflation affects psychology in powerful ways:
Fear: Rising prices reduce real wealth, making investors risk-averse.
Speculation: Some chase commodities or real estate as hedges.
Rotation: Capital shifts from growth to value, from equity to bonds, from domestic to global.
Herding: Retail investors often chase inflation-hedge assets at late stages, creating bubbles.
In 2025, investor sentiment is cautious yet opportunistic — inflation is high enough to worry but not catastrophic.
10. India’s Inflation-Market Performance in 2025
India is a special case in inflation-market dynamics.
Inflation Drivers: Food (vegetables, pulses), fuel imports, and rural demand are key factors.
Equity Markets:
Nifty and Sensex show resilience, supported by domestic flows (SIPs, DIIs).
Sectors like banking, IT services exports, and infrastructure remain strong.
Midcaps and SMEs are volatile due to inflation-sensitive costs.
Bond Markets: Rising G-sec yields (6.5–7.5%) reflect inflation risks but attract foreign inflows.
Rupee: Stable around 83–85/USD but vulnerable to oil price spikes.
India’s structural growth story (demographics, digital adoption, reforms) keeps markets buoyant even under moderate inflation.
Conclusion
Inflation in 2025 is not a crisis but a constant companion for markets. It’s sticky, regionally diverse, and shaped by structural shifts in energy, demographics, and geopolitics.
For investors and traders, understanding inflation means understanding market performance. It dictates central bank actions, bond yields, sectoral rotations, and even investor psychology.
The key takeaway: Markets can thrive under mild-to-moderate inflation, but elevated inflation demands strategic repositioning. In 2025, successful investors are those who embrace flexibility, hedge intelligently, and adapt to inflation’s multi-dimensional impact.

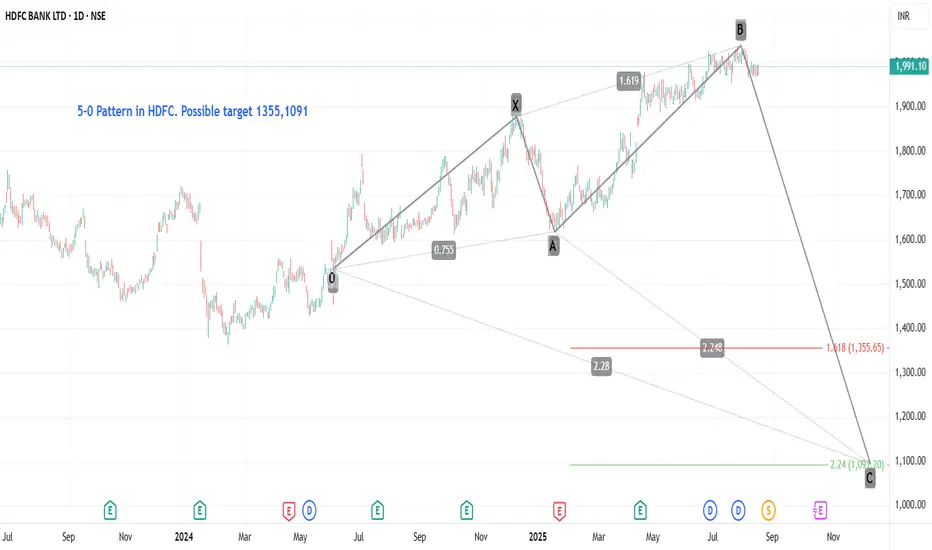
HDFC Harmonic patternHDFC 1991 - harmonic pattern 5-0 could be visualized in HDFC Bank. According to the pattern Possible targets are 1355,1091.
Quarterly Results Trading (Earnings Season)1. Introduction to Quarterly Results Trading
Every listed company in the stock market is required to disclose its financial performance periodically. In most markets, this happens every quarter—that’s four times a year. These reports are known as quarterly results or earnings reports.
For traders and investors, the release of earnings is one of the most volatile and opportunity-rich periods in the market. Stock prices can jump or crash within minutes of the announcement, depending on whether the company met, beat, or missed expectations.
This period, when a large number of companies announce results within a few weeks, is called Earnings Season. Traders specializing in this period use strategies designed to capture sharp price moves, volatility spikes, and changes in market sentiment.
Quarterly results trading is a mix of:
Fundamental analysis (studying the company’s earnings, revenue, guidance, and business health),
Technical analysis (charts, levels, and patterns),
Sentiment analysis (expectations, media coverage, and market psychology).
2. Understanding Earnings Season
Earnings Season happens four times a year, usually after the quarter ends. For example:
Q1: April – June (Results in July–August)
Q2: July – September (Results in October–November)
Q3: October – December (Results in January–February)
Q4: January – March (Results in April–May)
In India, companies follow an April–March financial year, so Q4 results are particularly important because they also include full-year earnings.
During earnings season, news channels, analysts, and brokerage houses are flooded with earnings previews, result updates, and management commentary. This makes it a period of heightened market activity.
3. Why Quarterly Results Matter for Traders & Investors
Quarterly results are a scorecard of a company’s performance. They reveal whether the business is growing, struggling, or facing new opportunities/challenges.
For investors, quarterly earnings help judge if a company is on track with long-term goals.
For traders, these results create short-term trading opportunities due to volatility.
Key reasons quarterly results matter:
Price Sensitivity – A single earnings report can change a company’s valuation.
Expectations vs Reality – Markets react not to absolute numbers, but to whether expectations were beaten or missed.
Sector Impact – One company’s results (like Infosys or HDFC Bank) often set the tone for its entire sector.
Market Sentiment – Strong or weak earnings can influence the broader indices (Nifty, Sensex, Nasdaq, S&P 500).
4. Key Components of an Earnings Report
When a company announces results, traders look at multiple data points:
Revenue (Top Line) – Total income earned. Growth shows market demand.
Net Profit (Bottom Line) – Profit after expenses, taxes, and interest.
EPS (Earnings Per Share) – Net profit divided by number of shares. A key valuation measure.
EBITDA / Operating Margin – Operational efficiency.
Guidance (Future Outlook) – Management’s forecast for coming quarters.
Special Announcements – Dividends, share buybacks, bonus issues, restructuring.
5. Market Expectations vs Actual Results
Stock price reactions to earnings depend less on actual numbers, and more on how those numbers compare to market expectations.
If a company beats expectations → stock usually rises.
If it misses expectations → stock usually falls.
If results are in-line → limited reaction, unless guidance surprises.
Example: If analysts expected Infosys to report ₹7,000 crore profit, but the company posts ₹7,500 crore, the stock may rally. But if expectations were ₹8,000 crore, the same ₹7,500 crore may disappoint.
This is why earnings trading is not just about numbers—it’s about expectations and surprises.
6. Earnings Surprises and Stock Price Reactions
Earnings surprises are powerful. A positive earnings surprise (beat) can trigger rallies, while a negative surprise (miss) can cause crashes.
Typical reactions:
Positive Surprise → Gap up opening, strong momentum, short covering.
Negative Surprise → Gap down opening, selling pressure, stop-loss triggers.
But sometimes, even strong results cause a stock to fall. This happens if:
The stock was already overbought (priced-in).
Future guidance is weak.
Market expected even better performance.
7. Pre-Earnings Trading Strategies
Traders often take positions before results are announced, based on expectations.
Common strategies:
Momentum Play – If sector peers have posted strong results, traders expect similar performance.
Options Straddle/Strangle – Betting on volatility rather than direction.
Analyst Preview Play – Following brokerage estimates.
Chart-Based Levels – Using support/resistance zones for pre-result positioning.
Risk: If results differ from expectations, positions can go against traders instantly.
8. Post-Earnings Trading Strategies
Many traders prefer to wait until results are out, and then ride the move.
Strategies:
Gap Trading – Playing the gap up or gap down opening.
Trend Continuation – Entering if strong momentum follows positive/negative results.
Fade the Move – If reaction is exaggerated, traders bet on reversal.
Sector Sympathy Play – Trading other stocks in the same sector (if Infosys beats, TCS/Wipro may rise too).
9. Options Trading During Earnings Season
Earnings season is heaven for options traders, because volatility spikes.
Implied Volatility (IV) rises before results, making options expensive.
After results, IV crush happens, reducing option premiums.
Strategies used:
Straddles/Strangles – To capture big moves in either direction.
Iron Condors – If expecting limited movement.
Directional Calls/Puts – If confident about result outcome.
Smart traders manage risk by sizing positions carefully and understanding IV dynamics.
10. Sector & Macro-Level Effects of Earnings Season
Quarterly results don’t just affect individual stocks—they influence entire sectors and indices.
Banking & Finance – HDFC Bank, ICICI Bank results affect Nifty Bank.
IT Sector – Infosys, TCS, Wipro results set the tone for tech stocks.
FMCG – HUL, Nestle results impact consumption sector.
Global Impact – US earnings (Apple, Microsoft, Tesla) influence Nasdaq & Indian IT stocks.
Thus, earnings season often drives short-term market direction.
11. Risks in Quarterly Results Trading
While opportunities are high, so are risks:
Gap Risk – Overnight positions can open with large gaps.
High Volatility – Rapid price swings can trigger stop losses.
Option Premium Decay – IV crush can cause losses even if direction is correct.
Overreaction – Stocks sometimes move irrationally post results.
Risk management is crucial—small position sizing, defined stop-loss, and not overtrading.
Conclusion
Quarterly results trading, or earnings season trading, is one of the most exciting and challenging periods in the market. It offers massive opportunities due to sharp price moves, but also carries high risks.
A successful earnings season trader:
Balances expectations vs reality,
Uses a mix of fundamental + technical + sentiment analysis,
Trades with discipline and proper risk management,
Learns from past case studies and market psychology.
In short, quarterly results trading is a battlefield of expectations, numbers, and emotions. Those who prepare, analyze, and execute carefully can capture some of the best moves of the year.

Part 1 Ride The Big MovesIntroduction to Options Trading
Options trading is one of the most flexible and powerful tools in the financial markets. Unlike stocks, where you simply buy and sell ownership of a company, options are derivative contracts that give you the right, but not the obligation, to buy or sell an underlying asset at a predetermined price within a specified time frame.
The beauty of options lies in their strategic possibilities — they allow traders to make money in rising, falling, or even sideways markets, often with less capital than buying stocks outright. But with that flexibility comes complexity, so understanding strategies is crucial.
Key Terms in Options Trading
Before we jump into strategies, let’s understand the key terms:
Call Option – Gives the right to buy the underlying asset at a fixed price (strike price) before expiry.
Put Option – Gives the right to sell the underlying asset at a fixed price before expiry.
Strike Price – The price at which you can buy/sell the asset.
Premium – The price you pay to buy an option.
Expiry Date – The date the option contract ends.
ITM (In-the-Money) – When exercising the option would be profitable.
ATM (At-the-Money) – Strike price is close to the current market price.
OTM (Out-of-the-Money) – Option has no intrinsic value yet.
Lot Size – Minimum number of shares/contracts per option.
Intrinsic Value – The real value if exercised now.
Time Value – Extra premium based on time left to expiry.

Commodities & Currency Trading1. Introduction
Trading is not just about stocks and indices — the global financial ecosystem runs on multiple asset classes, two of the most important being commodities and currencies (forex).
Both markets are deeply interconnected:
Commodities (like crude oil, gold, silver, agricultural products) are the raw materials that power economies.
Currencies represent the financial backbone that facilitates trade in those commodities.
Understanding how these markets work, how they affect each other, and how to trade them effectively is key to building a diversified and resilient trading strategy.
2. Commodities Trading
2.1 What are Commodities?
A commodity is a basic, interchangeable good used in commerce. Unlike branded products, commodities are largely fungible — meaning one unit is identical to another (e.g., one barrel of crude oil is essentially the same as another of the same grade).
2.2 Types of Commodities
They’re broadly divided into four categories:
Energy Commodities
Crude Oil (WTI, Brent)
Natural Gas
Heating Oil
Gasoline
Metals
Precious Metals: Gold, Silver, Platinum, Palladium
Industrial Metals: Copper, Aluminum, Nickel, Zinc
Agricultural Commodities
Grains: Wheat, Corn, Soybeans
Softs: Coffee, Cocoa, Sugar, Cotton
Livestock and Meat
Live Cattle, Feeder Cattle
Lean Hogs, Pork Bellies
2.3 Commodity Exchanges
Trading in commodities often happens on specialized exchanges:
CME Group (Chicago Mercantile Exchange) – Largest commodities marketplace
NYMEX (New York Mercantile Exchange) – Energy contracts
ICE (Intercontinental Exchange) – Agricultural & energy
MCX (Multi Commodity Exchange of India) – India’s main commodities market
2.4 Why Trade Commodities?
Diversification: Often move independently from stocks & bonds.
Inflation Hedge: Commodities, especially gold, hold value in inflationary times.
Geopolitical Plays: Energy prices rise in conflicts; agricultural prices rise in shortages.
Leverage Opportunities: Futures contracts allow large exposure with smaller capital.
2.5 How Commodity Trading Works
Most commodity trading is done via derivatives (futures, options, CFDs) rather than physically handling goods.
Futures Contracts: Agreement to buy/sell at a predetermined price and date.
Options on Futures: The right, but not obligation, to trade at a set price.
Spot Market: Immediate delivery at current market price.
2.6 Key Factors Influencing Commodity Prices
Supply and Demand Dynamics
Crop yields, mining output, energy production
Weather Conditions
Droughts affect agricultural prices
Geopolitical Events
Wars, sanctions, OPEC decisions
Currency Movements
Commodities priced in USD — weaker USD often boosts prices
Global Economic Health
Economic booms increase demand for raw materials
2.7 Commodity Trading Strategies
A. Trend Following
Uses technical indicators (moving averages, MACD) to ride long-term price moves.
Example: Buying crude oil when it breaks above resistance with strong volume.
B. Mean Reversion
Prices oscillate around an average value; traders buy undervalued & sell overvalued points.
Works well in range-bound markets like agricultural products.
C. Seasonal Trading
Many commodities have predictable seasonal patterns.
Example: Natural gas often rises before winter due to heating demand.
D. Spread Trading
Simultaneously buying one contract and selling another to profit from price differences.
2.8 Risks in Commodity Trading
High Volatility: Sharp price swings due to news, weather, geopolitics.
Leverage Risk: Futures amplify both gains and losses.
Liquidity Risk: Some contracts have low trading volume.
Risk Management Tip: Always use stop-loss orders and never over-leverage positions.
3. Currency (Forex) Trading
3.1 What is Forex?
Forex (Foreign Exchange) is the world’s largest financial market, trading over $7.5 trillion daily. It’s where currencies are bought and sold in pairs (e.g., EUR/USD, USD/JPY).
3.2 Major Currency Pairs
Majors: Most traded, involving USD
EUR/USD, GBP/USD, USD/JPY, USD/CHF, AUD/USD, USD/CAD
Crosses: No USD, e.g., EUR/GBP, AUD/JPY
Exotics: One major + one emerging currency, e.g., USD/INR, USD/TRY
3.3 Why Trade Currencies?
High Liquidity: Easy to enter & exit trades
24-Hour Market: Open Mon–Fri, covering all time zones
Low Costs: Narrow spreads, no commissions in many cases
Leverage: Small capital can control large positions
3.4 How Forex Trading Works
Currencies are traded in pairs, meaning you buy one currency while selling another.
Example:
EUR/USD = 1.1000 → 1 Euro = 1.10 USD
If you believe Euro will strengthen, you buy EUR/USD.
3.5 Factors Influencing Currency Prices
Interest Rates
Higher rates attract investors → stronger currency.
Economic Indicators
GDP, employment data, inflation numbers.
Political Stability
Stable governments attract investment.
Trade Balances
Countries exporting more than importing see stronger currencies.
Risk Sentiment
Safe-haven currencies (USD, JPY, CHF) strengthen in crises.
3.6 Forex Trading Strategies
A. Scalping
Ultra-short trades, seconds to minutes long.
Requires high liquidity pairs like EUR/USD.
B. Day Trading
Multiple trades within a day, no overnight positions.
C. Swing Trading
Holding for days/weeks to ride medium-term trends.
D. Carry Trade
Borrowing in low-interest currency and investing in high-interest currency.
3.7 Forex Risk Management
Use Stop Loss: Limit potential losses per trade.
Position Sizing: Risk only 1–2% of capital per trade.
Avoid Over-Leverage: High leverage magnifies losses quickly.
4. Relationship Between Commodities & Currencies
Commodities and currencies are tightly linked:
Commodity Currencies:
Some currencies move closely with specific commodity prices:
CAD ↔ Crude Oil
AUD ↔ Gold, Iron Ore
NZD ↔ Dairy, Agricultural Products
Inflation & Commodities:
Rising commodity prices often push inflation up, affecting currency value.
USD & Commodities:
Since most commodities are priced in USD, a weaker USD generally boosts commodity prices.
5. Technical & Fundamental Analysis in Both Markets
Technical Analysis Tools
Moving Averages
RSI & MACD
Fibonacci Retracement
Volume Profile (for commodities)
Fundamental Analysis
Economic reports (forex)
Supply-demand reports (commodities)
Geopolitical tracking
6. Practical Tips for Traders
Track Economic Calendars: For major releases affecting currencies & commodities.
Watch Correlations: Know which assets move together or in opposite directions.
Start Small: Paper trade before risking capital.
Stay Informed: Follow OPEC meetings, central bank decisions, and weather reports.
7. Conclusion
Trading commodities and currencies opens up opportunities beyond stocks, offering diversification, leverage, and global exposure. But these markets also come with high volatility and risk, making education, discipline, and strong risk management essential.
The successful trader learns not just to predict price movements, but also to understand the economic forces driving them.
Part 1 Ride The Big Moves Common Mistakes to Avoid
Holding OTM options too close to expiry hoping for a miracle.
Selling naked calls without understanding unlimited risk.
Over-leveraging with too many contracts.
Ignoring commissions and slippage.
Not adjusting positions when market changes.
Practical Tips for Success
Backtest strategies on historical data.
Start with paper trading before using real money.
Track your trades in a journal.
Combine technical analysis with options knowledge.
Trade liquid options with tight bid-ask spreads.

Technical Analysis Concepts1. Introduction to Technical Analysis
Technical Analysis (TA) is the study of market price action—primarily through charts—to forecast future price movements.
It’s built on the idea that “Price discounts everything”, meaning that all known information—economic data, company performance, market sentiment—is already reflected in the price.
In simpler words:
If you want to know what’s happening in a market, don’t just listen to the news—look at the chart.
Key Principles of Technical Analysis
There are three main pillars:
Price Discounts Everything
Every fundamental factor—earnings, interest rates, political events—is already reflected in price.
Traders believe price moves because of demand and supply changes that show up on charts before news does.
Price Moves in Trends
Markets rarely move in random zig-zags—they tend to trend:
Uptrend: Higher highs and higher lows
Downtrend: Lower highs and lower lows
Sideways: No clear direction
History Tends to Repeat Itself
Human psychology—fear, greed, hope—hasn’t changed over centuries. Chart patterns that worked 50 years ago often still work today.
2. Types of Technical Analysis
Broadly, TA can be split into:
A. Chart Analysis (Price Action)
Patterns, trendlines, support, resistance
Focuses purely on price movements
B. Indicator-Based Analysis
Uses mathematical formulas applied to price/volume
Examples: RSI, MACD, Moving Averages
C. Volume Analysis
Studies how much activity supports a price move
Strong moves with high volume = higher reliability
D. Market Structure Analysis
Understanding swing highs/lows, liquidity zones, and institutional footprints
3. Charts and Timeframes
Technical analysis starts with a chart. There are different chart types:
Line Chart – Simplest, connects closing prices. Good for a big-picture view.
Bar Chart – Shows open, high, low, close (OHLC).
Candlestick Chart – The most popular, visually intuitive for traders.
Timeframes
Choosing the right timeframe depends on your trading style:
Scalpers: 1-min to 5-min charts
Intraday Traders: 5-min to 15-min
Swing Traders: 1-hour to daily
Position Traders/Investors: Weekly to monthly
Rule of thumb:
Higher timeframes = stronger signals, but slower trades.
Lower timeframes = faster signals, but more noise.
4. Trends and Trendlines
A trend is simply the market’s general direction.
Types of Trends
Uptrend → Higher highs, higher lows
Downtrend → Lower highs, lower lows
Sideways (Range-bound) → Price moves within a horizontal band
Trendlines
A trendline is drawn by connecting at least two significant highs or lows.
In an uptrend: Connect swing lows
In a downtrend: Connect swing highs
They act as dynamic support or resistance.
5. Support and Resistance
Support: A price level where buying pressure is strong enough to halt a downtrend.
Resistance: A price level where selling pressure stops an uptrend.
How They Work
Support → Demand > Supply → Price bounces
Resistance → Supply > Demand → Price drops
Pro Tip: Once broken, support often becomes resistance and vice versa—this is called role reversal.
6. Chart Patterns
Chart patterns are visual formations on a chart that indicate potential market moves.
A. Continuation Patterns (Trend likely to continue)
Flags – Short pauses after sharp moves
Pennants – Small symmetrical triangles
Rectangles – Price consolidates between parallel support/resistance
B. Reversal Patterns (Trend likely to change)
Head and Shoulders – Signals a bearish reversal
Double Top/Bottom – Two failed attempts to break a high/low
Triple Top/Bottom – Similar to double but with three attempts
C. Bilateral Patterns (Either direction possible)
Triangles – Symmetrical, ascending, descending
7. Candlestick Patterns
Candlestick patterns are short-term signals of buying or selling pressure.
Bullish Patterns
Hammer – Long lower shadow, small body
Bullish Engulfing – Large bullish candle covers previous bearish candle
Morning Star – Three-candle reversal pattern
Bearish Patterns
Shooting Star – Long upper shadow
Bearish Engulfing – Large bearish candle covers prior bullish candle
Evening Star – Three-candle bearish reversal
8. Technical Indicators
Indicators help confirm price action or generate signals.
A. Trend Indicators
Moving Averages (SMA, EMA)
MACD – Measures momentum and trend changes
Parabolic SAR – Trailing stop tool
B. Momentum Indicators
RSI – Overbought (>70) / Oversold (<30) conditions
Stochastic Oscillator – Compares closing price to price range
CCI – Commodity Channel Index for momentum shifts
C. Volatility Indicators
Bollinger Bands – Show price deviation from average
ATR (Average True Range) – Measures volatility strength
D. Volume Indicators
OBV (On-Balance Volume) – Volume flow analysis
VWAP – Volume-weighted average price, used by institutions
9. Volume Profile and Market Structure
Volume Profile shows how much trading occurred at each price level, not just over time.
It highlights:
High Volume Nodes (HVN) → Strong price acceptance
Low Volume Nodes (LVN) → Price rejection zones
Market Structure is about identifying:
Higher highs / higher lows (uptrend)
Lower highs / lower lows (downtrend)
Liquidity pools (where stops are likely)
10. Dow Theory
Dow Theory is the grandfather of trend analysis.
Its principles:
Market discounts everything.
Market has three trends: Primary, secondary, minor.
Trends have three phases: Accumulation, public participation, distribution.
A trend is valid until a clear reversal occurs.
Conclusion
Technical analysis is not about predicting the future with 100% accuracy—it’s about improving probabilities.
A good TA trader:
Understands trends and patterns
Combines multiple tools for confirmation
Manages risk and keeps emotions in check
Remember:
TA gives you the edge, risk management keeps you in the game.

Part12 Trading Master ClassAdvanced Options Strategies
Butterfly Spread
When to Use: Expect stock to stay near a specific price.
How It Works: Buy 1 ITM option, sell 2 ATM options, buy 1 OTM option.
Risk: Limited.
Reward: Highest if stock ends at middle strike.
Example: Stock ₹100, buy call ₹95, sell 2 calls ₹100, buy call ₹105.
Calendar Spread
When to Use: Expect low short-term volatility but possible long-term move.
How It Works: Sell short-term option, buy long-term option at same strike.
Risk: Limited to net premium.
Reward: Comes from time decay of short option.

SME & IPO Trading Opportunities 1. Introduction
The stock market is a living, breathing organism — constantly evolving with trends, cycles, and opportunities. Two of the most exciting and profitable niches for traders and investors are Initial Public Offerings (IPOs) and Small & Medium Enterprise (SME) IPOs.
These areas often combine market hype, information asymmetry, liquidity surges, and price volatility — all of which can create significant profit opportunities for those who understand how to navigate them.
While IPOs of large companies grab headlines, SME IPOs are quietly becoming one of the fastest-growing segments in markets like India, offering massive potential for early movers. However, both IPOs and SME IPOs require sharp analysis, disciplined execution, and awareness of risks — because for every success story, there’s a cautionary tale.
2. Understanding IPOs and SME IPOs
2.1 What is an IPO?
An Initial Public Offering (IPO) is when a private company issues shares to the public for the first time to raise capital.
It’s like opening the gates for the public to invest in a business that was previously limited to private investors and founders.
Key purposes of an IPO:
Raise capital for expansion, debt repayment, or new projects.
Increase public visibility and brand credibility.
Provide an exit or partial liquidity to existing investors (VCs, PE funds, promoters).
2.2 What is an SME IPO?
An SME IPO is similar to a normal IPO, but it’s specifically for Small and Medium Enterprises — companies with smaller scale, market cap, and turnover.
They list on dedicated SME platforms such as:
NSE Emerge (National Stock Exchange)
BSE SME (Bombay Stock Exchange)
Differences from mainboard IPOs:
Feature Mainboard IPO SME IPO
Minimum Post-Issue Capital ₹10 crore ₹1 crore
Issue Size Large (hundreds/thousands of crores) Smaller (few crores to ~50 crore)
Lot Size Smaller (say ₹15,000) Larger (₹1-2 lakh minimum)
Investor Base Retail + QIB + HNI Primarily HNI + Limited Retail
Listing Main Exchange SME Platform
2.3 The Growing Popularity of SME IPOs in India
SME IPOs in India are booming because:
Huge wealth creation in the past few years (several SME IPOs have given 100%-500% returns post-listing).
Lower competition compared to mainboard IPOs.
Increasing investor participation via HNIs and informed retail investors.
Supportive regulations from SEBI for SMEs.
3. Why IPOs and SME IPOs Offer Trading Opportunities
3.1 The Hype Cycle
IPOs are heavily marketed through roadshows, advertisements, and media coverage. This creates a buzz and often leads to:
Oversubscription → Strong listing potential.
Emotional buying on Day 1 due to FOMO (Fear of Missing Out).
SME IPOs, though less advertised, also create strong niche hype within small-cap investor communities.
3.2 Information Asymmetry
Large institutional players often have detailed financial data and business insights — but in IPOs and SME IPOs, even retail investors get access to a prospectus (DRHP/RHP). Those who know how to read and interpret it can identify hidden gems before the crowd.
3.3 Volatility and Liquidity
Mainboard IPOs: Usually see high trading volumes on listing day → intraday traders love it.
SME IPOs: Lower liquidity but can see massive price jumps due to small free-float shares.
3.4 First-Mover Advantage
For fundamentally strong IPOs, getting in at the IPO price can mean riding a long-term growth story from the very beginning. Example: Infosys, TCS, Avenue Supermarts (DMart) IPO investors made multifold returns over years.
4. Types of Opportunities in IPO & SME IPO Trading
4.1 Listing Gains
Buy in IPO → Sell on listing day for profit.
Works best for oversubscribed IPOs with strong demand.
Example:
Nykaa IPO (2021) listed at ~78% premium.
Some SME IPOs list with 100%-300% premium.
4.2 Short-Term Swing Trades Post Listing
After listing, many IPOs see price discovery phases:
Some shoot up further due to momentum buying.
Others fall sharply after hype fades.
Traders can capture these 2–10 day swings.
4.3 Long-Term Investing
Identify fundamentally strong IPOs and SMEs that can grow significantly over 3–5 years.
Example: IRCTC IPO at ₹320 in 2019 → over ₹5,500 in 2021 (17x in 2 years).
4.4 SME Platform Migration
Some SME-listed companies eventually migrate to the mainboard exchange after meeting eligibility criteria — which can cause valuation re-rating and price jumps.
4.5 Pre-IPO Investments
For advanced traders/investors, investing in companies before they announce IPO plans can yield extraordinary gains when the IPO finally happens.
5. How to Identify High-Potential IPOs & SME IPOs
5.1 Key Financial Metrics
Revenue Growth Rate (Consistent >15–20%)
Profit Margins (Improving over time)
Return on Equity (ROE) (>15% is good)
Debt-to-Equity Ratio (Lower is better)
Cash Flow Consistency
5.2 Qualitative Factors
Industry growth potential.
Competitive advantage (Moat).
Strong management track record.
Promoter holding and their skin in the game.
5.3 Subscription Data
For IPOs, tracking subscription numbers daily:
High QIB (Qualified Institutional Buyer) subscription → good sign.
SME IPOs with oversubscription in HNI and retail often see strong listing.
5.4 Grey Market Premium (GMP)
The Grey Market is an unofficial market where IPO shares are traded before listing. GMP gives a rough idea of market expectations, but it’s not always reliable.
6. Risk Factors in SME & IPO Trading
6.1 Listing Day Disappointments
Not all IPOs list at a premium — some open below issue price (listing loss).
6.2 Hype vs Reality
Companies might look attractive in marketing materials but have weak fundamentals.
6.3 Low Liquidity in SME IPOs
Getting out quickly in SME IPOs can be tough — spreads can be huge.
6.4 Regulatory & Compliance Risks
SMEs sometimes face corporate governance issues or delayed disclosures.
7. Trading Strategies for IPOs & SME IPOs
7.1 For Listing Gains
Focus on IPOs with >20x oversubscription in QIB category.
Track GMP trends — consistent rise before listing is a bullish signal.
Avoid low-demand IPOs.
7.2 Post-Listing Momentum Trading
Use 5-min/15-min charts to catch intraday breakouts.
Set tight stop-loss (2–3%) due to volatility.
Volume analysis is critical.
7.3 Swing Trading SME IPOs
Wait for first 5–7 trading days after listing.
Buy on dips when price consolidates above listing price.
7.4 Long-Term Positioning
Enter strong companies post-listing dip (common after initial hype).
Monitor quarterly results for sustained growth.
7.5 Pre-IPO Placement Investing
Requires large capital and network access.
Higher risk but can yield 2x–5x returns at IPO.
8. Tools & Resources for IPO & SME IPO Trading
Stock exchange websites (NSE/BSE) for official IPO details.
SEBI filings for DRHP/RHP.
IPO subscription trackers (e.g., Chittorgarh, IPOWatch).
Financial news platforms for sentiment analysis.
Charting tools like TradingView for technical setups.
9. Case Studies
Case Study 1: Mainboard IPO Success
Avenue Supermarts (DMart)
IPO Price: ₹299 (2017)
Listing Price: ₹604 (+102%)
5-Year Return: 7x
Key Takeaway: Strong fundamentals + brand recall = multi-year wealth creation.
Case Study 2: SME IPO Multi-bagger
Essen Speciality Films (Listed on NSE Emerge)
Issue Price: ₹101 (2022)
1-Year Price: ₹400+ (4x)
Key Takeaway: Low float + strong earnings growth can lead to explosive returns.
Case Study 3: Listing Loss
Paytm
IPO Price: ₹2,150 (2021)
Listing Price: ₹1,950 (−9%)
Fell to ₹540 in 1 year.
Key Takeaway: High valuations without profitability can lead to severe post-listing crashes.
10. Future Outlook for SME & IPO Trading
Digital revolution → More SMEs tapping capital markets.
Retail investor growth → Higher demand for IPOs.
Regulatory support → Easier SME listings.
Sectoral trends like EV, renewable energy, fintech, and AI are likely to dominate IPO pipelines.
Conclusion
IPOs and SME IPOs present some of the most exciting and potentially profitable opportunities in the stock market — but they’re not for blind speculation.
Success requires:
Understanding the business and its valuation.
Reading market sentiment via subscription data, GMP, and news flow.
Executing trades with discipline (entry/exit plans).
Managing risk, especially in volatile SME IPOs.
For traders, these segments offer short bursts of high liquidity and volatility, perfect for intraday and swing plays. For long-term investors, they provide a chance to get in early on the next market leader.
In the coming years, SME IPOs are likely to become the new hotspot for aggressive wealth creation — but only for those who master the art of filtering hype from genuine opportunity.

Part1 Ride The Big MovesTypes of Option Traders
1. Speculators
They aim to profit from market direction using options. Their goal is capital gain.
2. Hedgers
They use options to protect investments from unfavorable price movements.
3. Income Traders
They sell options to earn premium income.
Option Trading Strategies
1. Basic Strategies
A. Buying Calls (Bullish)
Used when you expect the stock to rise.
B. Buying Puts (Bearish)
Used when expecting a stock to fall.
C. Covered Call (Neutral to Bullish)
Own the stock and sell a call option. Earn premium while holding the stock.
D. Protective Put (Insurance)
Own the stock and buy a put option to limit losses.

Part5 Institutional Trading How Options Work
Let’s break this down with an example.
Call Option Example:
You buy a call option on Stock A with a strike price of ₹100, paying a premium of ₹5. If the stock price rises to ₹120, you can buy it for ₹100 and sell it for ₹120—earning a ₹20 profit per share, minus the ₹5 premium, netting ₹15.
If the stock stays below ₹100, you simply let the option expire. Your loss is limited to the ₹5 premium.
Put Option Example:
You buy a put option on Stock A with a strike price of ₹100, paying a ₹5 premium. If the stock falls to ₹80, you can sell it for ₹100—earning ₹20, minus ₹5 premium = ₹15 profit.
If the stock stays above ₹100, the option expires worthless. Again, your loss is limited to ₹5.
Why Trade Options?
A. Leverage
Options require a smaller initial investment compared to buying stocks, but they can offer significant returns.
B. Risk Management (Hedging)
Options can hedge against downside risk. For example, if you own shares, buying a put option can protect you against losses if the price falls.
C. Income Generation
Writing (selling) options like covered calls can generate consistent income.
D. Strategic Flexibility
You can profit in bullish, bearish, or neutral markets using different strategies.

Part7 Trading Master Class How Options Work
Example of a Call Option
Suppose a stock is trading at ₹100. You buy a call option with a ₹110 strike price, expiring in 1 month, and pay a ₹5 premium.
If the stock rises to ₹120: Your profit is ₹120 - ₹110 = ₹10. Net gain = ₹10 - ₹5 = ₹5.
If the stock stays at ₹100: The option expires worthless. Your loss = ₹5 (premium).
Example of a Put Option
Suppose the same stock is ₹100, and you buy a put option with a ₹90 strike price for ₹5.
If the stock drops to ₹80: Your profit = ₹90 - ₹80 = ₹10. Net gain = ₹10 - ₹5 = ₹5.
If the stock stays above ₹90: The option expires worthless. Your loss = ₹5.
Types of Options
American vs. European Options
American Options: Can be exercised anytime before expiry.
European Options: Can only be exercised at expiry.
Index Options vs. Stock Options
Stock Options: Based on individual stocks (e.g., Reliance, Infosys).
Index Options: Based on indices (e.g., Nifty, Bank Nifty).
Weekly vs. Monthly Options
Weekly Options: Expire every Thursday (India).
Monthly Options: Expire on the last Thursday of the month.

Part6 Institutional Trading Summary Table: Pros and Cons
✅ Pros ❌ Cons
High return potential Can expire worthless
Lower capital needed Time decay eats premium
Multiple strategies available Complex to understand fully
Hedge against price movement Requires constant monitoring
Suitable for both up/down/flat markets Emotional stress during volatility
Final Thoughts
Options trading is like a chess game in finance—a smart mix of logic, timing, and calculated risk. While it opens the doors to high returns and strategic flexibility, it's not a get-rich-quick scheme. Educate yourself, use tools wisely, manage risk, and practice consistently before going full throttle.
If you’d like a PDF version or want this guide tailored to a specific strategy or stock, let me know!
Also, I can help you build option strategy examples based on live market scenarios (Nifty, Bank Nifty, or specific stocks). Just ask!

Part1 Ride The Big MovesOption Trading Tools & Platforms
Key tools for effective options trading:
Option Chain Analysis Tools (NSE, Sensibull, Opstra, etc.)
Payoff Diagram Simulators
Greeks Calculators
Strategy Builders
Volatility Charts (IV, HV)
Successful Option Trader’s Mindset
The best option traders are not gamblers. They:
Focus on risk management (position sizing, stop loss)
Use strategies, not guesses
Understand Greeks and volatility
Prefer probability over prediction
Learn from every trade
The Future of Options Trading
With tech-driven innovations, we are seeing:
Zero Day Expiry Options (0DTE) gaining popularity
AI-driven options strategies
Increased retail participation through mobile apps
Automated trading using APIs and bots
Micro contracts for better accessibility

Open Interest & Option Chain Analysis1. Introduction
In the world of derivatives and options trading, Open Interest (OI) and Option Chain Analysis are two of the most powerful tools traders use to decode market sentiment, identify support/resistance zones, and make calculated decisions. These concepts bridge the gap between price action and market psychology, offering a quantitative insight into where traders are betting and how the market is positioning itself.
This article explores the depths of Open Interest and Option Chain Analysis—what they are, how they work, and how traders use them to form high-probability strategies in intraday, swing, and positional options trading.
2. What is Open Interest (OI)?
Definition
Open Interest is the total number of outstanding derivative contracts (options or futures) that are not yet settled. It reflects the flow of money into the market.
Not the same as volume: Volume counts how many contracts changed hands during the day.
OI reflects positions that remain open.
How It's Calculated
If:
A buyer opens a position and a seller opens a position → OI increases by 1.
A buyer closes and a seller closes → OI decreases by 1.
A buyer transfers to a new seller or vice versa → OI remains the same.
Key Points:
High OI → High trader interest in that strike or contract.
Rising OI with rising price → Long buildup.
Falling OI with rising price → Short covering.
Rising OI with falling price → Short buildup.
Falling OI with falling price → Long unwinding.
Why It Matters:
OI helps traders:
Understand liquidity.
Identify buildup of positions (bullish/bearish bias).
Spot potential reversals or breakouts.
3. What is an Option Chain?
An option chain is a listing of all available options for a particular stock or index for a given expiration date.
Each strike price has:
Call Option Data
Put Option Data
Each leg (call/put) includes:
Last traded price (LTP)
Bid & Ask
Volume
Open Interest
Change in OI
Implied Volatility (IV)
How to Read It:
Strike Prices run vertically in the center.
Calls on the left, Puts on the right.
Traders use it to determine:
Where big positions are being taken.
Key support/resistance levels.
Market bias (bullish/bearish/neutral).
4. Interpreting Open Interest in Option Chains
Here’s where the real power lies.
By analyzing OI in the option chain, traders decode where institutions and big players are placing their bets.
Key Concepts:
A. Max Pain
The strike price at which option buyers will suffer maximum loss.
Based on cumulative OI.
Used as expiry level estimation.
B. Support and Resistance from OI
High OI in PUTs at a strike → Support level (buyers expect price won’t go below this).
High OI in CALLs at a strike → Resistance level (sellers expect price won’t go above this).
C. Change in OI (Chg OI)
More important than static OI.
Helps identify fresh positions.
5. Key Scenarios in Option Chain OI Analysis
Let’s break it into real-world trading signals:
Price OI Interpretation
↑ ↑ Long Buildup (bullish)
↓ ↑ Short Buildup (bearish)
↑ ↓ Short Covering (bullish)
↓ ↓ Long Unwinding (bearish)
Example:
Suppose NIFTY is at 22,000:
At 22,000 PUT: OI = 3.5 million (↑)
At 22,000 CALL: OI = 2.1 million (↓)
→ Traders believe 22,000 is a support level; bullish bias.
6. PCR (Put Call Ratio): A Sentiment Indicator
Definition
PCR = Total PUT OI / Total CALL OI
PCR > 1: More PUTs → Bullish bias (more hedging, expecting downside).
PCR < 1: More CALLs → Bearish bias.
Interpretation:
Extreme PCR (>1.5 or <0.5) → Contrarian signals.
Too many PUTs → Possible reversal upward.
Too many CALLs → Possible reversal downward.
7. Using OI and Option Chain for Trade Setups
Intraday Setups:
OI Shift Zones:
Monitor real-time increase in PUT or CALL OI.
When PUTs start gaining OI near current price → price may hold as support.
Unwinding/Breakout Signal:
Sudden drop in CALL OI + price moving up → resistance breakout.
Sudden drop in PUT OI + price falling → support breakdown.
Swing Setups:
Combine price structure with OI clusters.
Find:
Base building at high PUT OI zones (accumulation).
Top formations at high CALL OI zones (distribution).
Expiry Day (Thursday) Strategies:
Focus on OI changes every 15 mins.
Watch for strikes with rapidly increasing CALL or PUT unwinding.
These indicate likely expiry movement.
8. Combining OI with Volume and Price
Open Interest alone is not enough.
Price Volume OI Signal
↑ ↑ ↑ Strong bullish
↓ ↑ ↑ Strong bearish
↑ ↓ ↓ Weak rally
↓ ↓ ↓ Weak fall
Best Practice:
Use OI + Volume + Price.
Confirm with price action (candle patterns, breakouts, trendlines).
9. Option Chain Heatmaps & Visualization Tools
Many traders use platforms like:
NSE Option Chain
Sensibull
Opstra
ChartInk
TradingView with OI overlays
They visualize:
OI clusters
Change in OI live
Max Pain levels
IV trends
Heatmap View helps:
Spot where most money is stuck.
Visualize support/resistance better than numbers.
10. Real-Life Example (NIFTY)
Let’s say:
NIFTY spot = 22,200
High PUT OI = 22,000 → strong support.
High CALL OI = 22,500 → strong resistance.
Max Pain = 22,100
→ Traders can expect:
Range-bound expiry between 22,000–22,500.
Long trade near 22,000 if PUT OI rises further.
Short trade near 22,500 if CALL OI remains heavy.
Conclusion
Understanding Open Interest and mastering Option Chain Analysis unlocks a deeper level of strategic trading. It transforms you from a reactionary trader to a tactical planner, capable of anticipating moves before they occur.
The key is consistency—observe, track, analyze, and most importantly, combine OI insights with market structure, volume, and price action for optimal results. When used with discipline and insight, OI and option chains become a trader's GPS in the volatile world of derivatives.
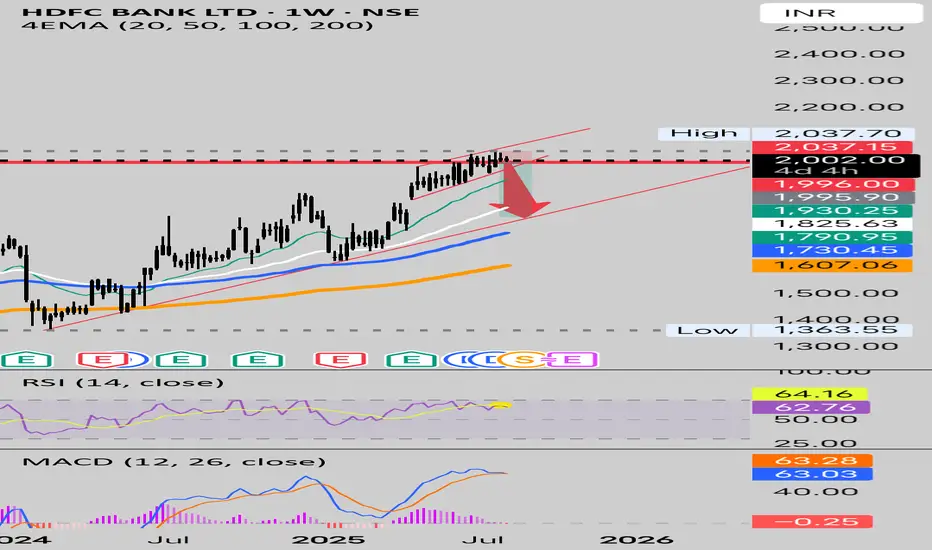
Hdfc gearing up for pullback 1900 and more to followHDFC bank has enjoyed Almost 6 months of uptrend.
Looks over stretched without a pullback
1900 1850 1800 could follow in days to come.
RSI on Weekly showing Bearish Divergence..
Below 1996
Shorts could get aggressive
Super Cycle Outlook Introduction
The period from 2025 to 2030 is poised to be one of the most dynamic in recent financial history. As global economies undergo seismic transformations driven by deglobalization, technological revolutions, climate change imperatives, and shifting monetary policies, investors are increasingly turning to the idea of a “super cycle.” A super cycle represents a prolonged period—often years or even decades—of expansion or contraction across key asset classes like commodities, cryptocurrencies, and equities.
This outlook explores the macroeconomic themes, technological catalysts, geopolitical realignments, and behavioral finance trends that may drive super cycles in three major domains: commodities, crypto, and equity markets.
1. The Macro Framework of Super Cycles
1.1 Defining Super Cycles
A super cycle is not just a long bull or bear market—it reflects a multi-year structural change in demand and supply fundamentals, often aligned with massive shifts in economic, demographic, or geopolitical paradigms. Previous super cycles include:
The post-WWII industrial boom (1950s–1970s)
The emerging market commodity boom (2000s)
The tech-driven equity surge (2010s–2021)
1.2 Forces Shaping the 2025–2030 Period
Decentralization of global supply chains
Aging Western demographics vs. rising Global South demand
AI and automation
Climate change and ESG investing
Geopolitical fragmentation (e.g., BRICS+ vs. G7)
De-dollarization and rise of digital currencies
Post-pandemic economic recalibrations
2. Commodities: Green Metals, Energy, and Food Security
2.1 Green Super Cycle
The green energy transition is creating a new demand wave for critical metals, triggering a likely commodity super cycle.
Key Beneficiaries:
Lithium, cobalt, nickel: EV batteries
Copper: Electrification, solar panels, and grid infrastructure
Rare earths: Wind turbines, semiconductors, defense tech
Outlook:
Copper demand could double by 2030.
Lithium demand may grow 3x to 5x due to EV adoption.
Supply shortages are likely due to underinvestment in mining.
2.2 Traditional Energy Resilience
Despite decarbonization trends, fossil fuels are not fading away. Oil, gas, and even coal are experiencing a surprising second wind.
Factors Driving Oil & Gas Resurgence:
Delay in green infrastructure readiness
Increased energy nationalism
Supply disruptions due to geopolitical tensions (Russia, Middle East)
Outlook:
Oil prices may remain elevated, with Brent crude averaging $90–110 between 2025–2028.
Natural gas (LNG) exports from the US and Australia will grow as Europe and Asia diversify supply.
2.3 Agricultural Commodities & Food Security
Climate volatility and geopolitical shocks (like the Ukraine war) have exposed food system vulnerabilities.
Trends to Watch:
Demand for wheat, corn, soybeans to stay high
Water scarcity affecting yields
Shift to precision agriculture and agri-tech
Outlook:
Inflation-linked gains in food prices may spur investment in agricultural ETFs, farmland, and water rights.
3. Crypto: From Hype to Institutionalization
3.1 The End of the “Wild West” Era
The 2010s and early 2020s were the age of speculative crypto booms and rug-pulls. From 2025 onward, crypto is entering a more mature phase, shaped by regulation, stablecoins, and digital identity systems.
3.2 Bitcoin: Digital Gold 2.0
Bitcoin’s scarcity narrative remains intact post multiple halving cycles.
Institutional adoption is accelerating via ETFs, pension funds, and sovereign wealth funds.
Emerging markets like Argentina, Nigeria, and Turkey are turning to BTC amid currency instability.
Outlook:
Bitcoin price may reach $150,000–$250,000 by 2030.
Will increasingly be seen as a macro hedge against fiat depreciation.
3.3 Ethereum and the Tokenized Economy
Ethereum is morphing into the settlement layer of the internet, supporting DeFi, NFTs, tokenized RWAs (real-world assets), and CBDCs.
“Ethereum killers” (e.g., Solana, Cardano, Avalanche) continue to innovate, but Ethereum’s brand and scale give it staying power.
Outlook:
Ethereum to play a key role in institutional DeFi, supporting trillions in tokenized assets.
Use cases in trade finance, insurance, and securities settlement to explode.
3.4 Stablecoins, CBDCs & Regulation
USDC, USDT, and CBDCs will dominate cross-border payments.
Expect full crypto regulations globally by 2026–2027.
A regulated crypto ecosystem may become Wall Street 2.0.
Outlook:
Real-world asset tokenization may become a $20–30 trillion market by 2030.
Central banks will push programmable money tied to national objectives (e.g., carbon credits, subsidies).
4. Equities: Fragmentation, Innovation, and Sector Shifts
4.1 AI & Deep Tech Boom
The next equity super cycle may revolve around AI, robotics, biotech, and space tech.
Key Drivers:
AI automation revolution across industries
Massive computing power requirements (data centers, semiconductors)
Biotech breakthroughs (CRISPR, gene editing, synthetic biology)
Space economy growth (satellite internet, lunar exploration)
Outlook:
AI stocks may mirror the dot-com boom (and bust) pattern.
NVIDIA-type valuations may become common in AI infrastructure players.
US-China tech decoupling may create dual innovation ecosystems.
4.2 Emerging Market Renaissance
While developed market equities may face slowing growth due to saturation and demographics, EM equities may rise as the next growth frontier.
Key Growth Engines:
India (demographics, digital rails, manufacturing)
Indonesia, Vietnam, Philippines (China+1 strategy)
Africa (youth, mobile-first economies)
Outlook:
MSCI Emerging Markets Index could outperform S&P 500 in CAGR terms.
Retail investor participation in India and ASEAN may create massive capital inflows.
4.3 Sectoral Rotation: From Growth to Value?
Rising rates and sticky inflation have led to renewed interest in value stocks—industrial, banking, energy.
Yet, growth stocks in AI and clean tech will still attract long-term capital.
Outlook:
Expect sector rotations every 12–18 months.
Long-term investors may favor a barbell strategy—combining defensives with disruptive innovators.
4.4 ESG and Impact Investing
ESG is transitioning from narrative to performance metrics.
Climate funds, carbon markets, and sustainability indices will drive flows.
Outlook:
Green and blue bonds, ESG ETFs may capture trillions in AUM.
Investors will demand proof of impact, not just greenwashing.
5. Risks & Disruptors
5.1 Inflation & Interest Rate Cycles
Sticky inflation due to wage pressures and commodity bottlenecks
Potential for multiple rate hike cycles across major economies
Equity valuations may remain volatile in a higher-for-longer regime
5.2 Geopolitical Flashpoints
Taiwan Strait, Middle East, and Russia-Ukraine tensions
Cyberwarfare, AI militarization, and space conflict risks
US-China Cold Tech War intensifying
5.3 Climate Shocks
Rising frequency of natural disasters affecting agriculture, insurance, and infrastructure
Policy responses (carbon taxes, border adjustments) could reshape supply chains
5.4 Black Swans
AI alignment failures
Massive sovereign debt crisis (Japan, Italy, US?)
Central bank digital currencies undermining fiat trust
Pandemic 2.0 scenarios
6. Strategic Allocation in a Super Cycle Era
6.1 Multi-Asset Portfolio Themes (2025–2030)
Asset Class Role in Portfolio Super Cycle Tailwind
Commodities Inflation hedge Green energy, food security
Crypto Risk/return kicker De-dollarization, digital economy
Equities (AI, EM) Growth engine Innovation, demographic dividends
Bonds (short-term) Stability Selective in rising rate scenario
Real Assets (REITs, Farmland) Store of value Climate-proof, income generation
6.2 Thematic Investing Strategies
Green metals ETFs
AI/robotics funds
Digital asset infrastructure (crypto exchanges, DeFi protocols)
Water and farmland investments
Emerging market consumer ETFs
6.3 Trading vs. Investing in Super Cycles
Super cycles reward long-term thematic investing.
But short-term corrections within the cycle are inevitable.
Blend of core-satellite strategy recommended:
Core: Passive diversified holdings
Satellite: Thematic/high-beta plays
Conclusion
The 2025–2030 period may usher in a once-in-a-generation realignment of global asset classes. The rise of green technologies, the maturation of crypto, and the evolution of equity markets will define how capital flows across borders and sectors. These super cycles are not just financial stories—they are reflections of deeper transformations in technology, geopolitics, and human behavior.
Investors who can anticipate themes, allocate smartly, and adapt quickly will not only survive but thrive in this new era. While volatility is certain, so too is opportunity—for those with the foresight to ride the next super cycle.