Part4 Institution Trading Types of Options
American vs. European Options
American Options: Can be exercised anytime before expiry.
European Options: Can only be exercised at expiry.
Index Options vs. Stock Options
Stock Options: Based on individual stocks (e.g., Reliance, Infosys).
Index Options: Based on indices (e.g., Nifty, Bank Nifty).
Weekly vs. Monthly Options
Weekly Options: Expire every Thursday (India).
Monthly Options: Expire on the last Thursday of the month.
Trade ideas

Part1 Ride The Big MoveCall Options vs Put Options
✅ Call Option (Bullish)
Gives you the right to buy the underlying asset at the strike price.
You profit when the price of the underlying asset goes above the strike price plus premium.
Example:
You buy a call on ABC stock with a strike price of ₹100, premium ₹5.
If ABC rises to ₹120, you can buy at ₹100 and sell at ₹120 = ₹15 profit (₹20 gain - ₹5 premium).
🔻 Put Option (Bearish)
Gives you the right to sell the underlying asset at the strike price.
You profit when the price of the underlying asset falls below the strike price minus premium.
Example:
You buy a put on XYZ stock with strike ₹200, premium ₹10.
If XYZ falls to ₹170, you sell at ₹200 while it trades at ₹170 = ₹20 profit (₹30 gain - ₹10 premium).

Open Interest & Option Chain AnalysisOptions trading has grown rapidly among retail and institutional traders due to its strategic flexibility and leverage. Two of the most critical tools for options traders are Open Interest (OI) and Option Chain Analysis. These tools provide deep insights into market sentiment, potential support and resistance levels, and liquidity zones. This guide will walk you through the concepts of Open Interest, Option Chain interpretation, real-world strategies, and how to apply this knowledge for smarter trading decisions.
🔹 What is Open Interest?
Open Interest refers to the total number of outstanding options contracts (calls or puts) that have not been settled or closed. It reflects how much active participation exists in a particular strike price and expiry.
Key Points:
Increase in OI: Indicates that new positions are being added (either long or short).
Decrease in OI: Means traders are closing out positions.
High OI: Signals strong interest in that strike price – potentially a key level for support or resistance.
Unlike volume (which resets daily), OI is cumulative and updates after the close of each trading day.
Example:
You buy 1 lot of Nifty 17000 CE, and someone sells it to you → OI increases by 1.
You later sell it and the counterparty closes their position too → OI decreases by 1.
🔹 What is an Option Chain?
An Option Chain is a table displaying all available option contracts for a specific stock/index across various strike prices and expiries. It includes data such as:
Strike Call OI Call LTP Put LTP Put OI
17500 1,20,000 ₹75 ₹30 90,000
17600 2,40,000 ₹45 ₹40 2,00,000
Key Elements:
Strike Price: Price at which the option can be exercised.
Calls vs Puts: Calls are on the left; puts on the right (or vice versa).
LTP: Last Traded Price.
OI & Change in OI: Used to spot where the smart money is positioned.
🔹 How to Read Open Interest in the Option Chain
OI provides crucial support and resistance data. Here's how to read it:
1. High Call OI ➝ Resistance
Traders are selling call options at that level, expecting the price won’t rise above it.
2. High Put OI ➝ Support
Traders are selling puts, expecting the price won’t fall below it.
3. Change in OI (Today’s change) ➝ Trend confirmation
Positive change in Call OI + Price Falling → Bearish
Positive change in Put OI + Price Rising → Bullish
🔹 Multi-Strike OI Build-Up
Sometimes, OI builds up in multiple strike prices above/below the spot. This forms resistance/support zones.
Example:
Call OI: 17800 (3L), 17900 (2.7L), 18000 (4.1L)
Strong resistance between 17800–18000
Breakout above 18000 is significant.
🔹 Intraday Option Chain Analysis
For intraday traders, changes in OI on a 5- to 15-minute basis can reveal sharp shifts in sentiment.
Use Change in OI (Live updates).
Look at IV (Implied Volatility): Spikes can indicate event-based risk.
Combine with Volume Profile, VWAP, and Price Action.
Example:
At 11 AM, sudden jump in Put OI at 17700.
Price bouncing from 17720 → Intraday long trade setup.
🔹 Common Mistakes to Avoid
Looking at absolute OI only – Always compare to change in OI.
Ignoring context – Use OI in combination with price, volume, and trend.
Chasing false breakouts – Wait for OI shift confirmation.
Trading illiquid options – Stick to strikes with high volume and OI.
🔹 Tools for Option Chain Analysis
NSE India Website – Free option chain.
Sensibull, Opstra, StockMock – Visual OI charts and PCR.
TradingView OI Indicators – Live OI overlays.
Fyers/Webull/Zerodha – Broker-integrated data.
🔹 Advanced: OI Spreads & Traps
OI data can also reveal where retail traders are trapped:
Call writers trapped when price shoots up → Short covering leads to spikes.
Put writers trapped when price falls → Sudden breakdown.
Watch for spikes in volume + OI unwinding.
🔹 Summary: Step-by-Step Framework
Step Action
1 Identify spot price and trading range.
2 Look for highest Call & Put OI levels.
3 Observe changes in OI throughout the day.
4 Use PCR for overall bias.
5 Confirm with price action before trade.
6 Exit if OI starts shifting against your trade.
🔹 Conclusion
Open Interest and Option Chain Analysis are powerful tools when used correctly. They offer traders a real-time look at market sentiment, help identify key levels, and give clues about institutional activity. However, they should not be used in isolation. Combine them with price action, volume, and technical analysis for the best results.
Whether you're an intraday trader, swing trader, or options strategist, mastering the art of reading the option chain and open interest will give you a strong edge in today's fast-moving markets.
Part6 Institution Trading Types of Options
American vs. European Options
American Options: Can be exercised anytime before expiry.
European Options: Can only be exercised at expiry.
Index Options vs. Stock Options
Stock Options: Based on individual stocks (e.g., Reliance, Infosys).
Index Options: Based on indices (e.g., Nifty, Bank Nifty).
Weekly vs. Monthly Options
Weekly Options: Expire every Thursday (India).
Monthly Options: Expire on the last Thursday of the month.

Super Cycle in Trading (2025–2030 Outlook)Introduction: What is a Super Cycle in Trading?
A super cycle in trading refers to a long-term, secular trend that drives asset prices higher (or lower) across years—sometimes even decades. These macroeconomic cycles often result from structural shifts such as technological revolutions, global demographic trends, monetary policy changes, or supply-demand imbalances in key markets like commodities, equities, or currencies.
Historically, super cycles have influenced not just asset prices but global economies, wealth distribution, and geopolitical dynamics. For instance, the commodity super cycle of the early 2000s—driven by China's industrialization—triggered a worldwide surge in raw material prices. The tech super cycle in the 2010s saw exponential gains in the valuation of Silicon Valley and digital-first companies.
As we enter the second half of the 2020s, traders and investors are keenly watching for the 2025–2030 super cycle—which sectors will dominate, what risks lie ahead, and how to position themselves for maximum advantage.
Section 1: Characteristics of a Super Cycle
Understanding a super cycle involves recognizing its unique characteristics:
Extended Duration – Lasts 5–20 years.
Broad Market Impact – Affects multiple asset classes, not just isolated sectors.
Macro-Driven – Tied to global shifts in technology, demographics, or policy.
Momentum-Heavy – Once in motion, trends tend to self-reinforce.
High Volatility Phases – Though generally upward (or downward), corrections within the cycle can be sharp.
Section 2: Historical Super Cycles & Lessons Learned
To understand future super cycles, we must look at past ones:
1. Post-War Industrial Boom (1945–1965)
Driven by U.S. manufacturing and European reconstruction.
Equities soared while gold remained fixed under Bretton Woods.
2. Oil Shock & Stagflation (1970s)
Energy-driven cycle where oil-producing nations gained power.
Gold and commodities surged; equities stagnated.
3. Tech Bubble (1990s–2000)
Dot-com boom powered by internet expansion.
Unprecedented IPO mania followed by the 2001 crash.
4. China-Driven Commodity Cycle (2002–2011)
Massive demand for metals, energy, and raw goods.
Benefited countries like Australia, Brazil, and Russia.
5. Post-GFC Liquidity Super Cycle (2009–2021)
Central bank stimulus led to asset inflation.
Tech, real estate, and passive investing dominated.
Key Takeaway: Super cycles are driven by unique, structural themes. They reward early movers and punish late entrants who chase overheated trends.
Section 3: Super Cycle Themes Likely to Dominate 2025–2030
Here are the major themes expected to power the next super cycle:
1. Artificial Intelligence and Automation
Why? Generative AI (like ChatGPT), robotics, and LLMs are transforming productivity, disrupting white-collar jobs, and creating new digital business models.
Market Implications:
Long-term growth in AI chipmakers, cloud infra, and data platforms.
Emergence of “AI-first” companies replacing legacy tech.
ETFs and thematic funds based on AI and robotics to outperform.
Trading Tip: Watch for mid-cap tech breakouts and AI service enablers in emerging markets.
2. Green Energy & Climate Tech
Why? Energy transition is no longer optional—climate policy, regulation, and ESG demand are forcing real capital shifts.
Market Implications:
Massive investment in solar, wind, EVs, hydrogen, and battery storage.
Decline in legacy oil demand by late 2020s, despite short-term spikes.
New carbon trading platforms and climate hedge instruments.
Trading Tip: Focus on battery metals like lithium, cobalt, and rare earth ETFs.
3. De-Dollarization & Multi-Currency Trade Systems
Why? BRICS+ countries are pushing for alternative trade systems, reducing dependency on USD.
Market Implications:
Volatility in forex markets, with rising prominence of gold, yuan, and digital currencies.
Pressure on U.S. Treasury yields and broader financial dominance.
Trading Tip: Keep an eye on emerging market currencies, sovereign digital currency rollouts, and gold-based ETFs.
4. Demographic Super Cycle
Why? Aging populations in the West vs. youth booms in South Asia & Africa.
Market Implications:
Long-term bullishness on India, Vietnam, Indonesia due to labor and consumption booms.
Bearish tilt on EU and Japan due to declining productivity.
Trading Tip: Sectoral rotation into consumer stocks, fintech, and healthcare in these high-growth regions.
5. Decentralized Finance & Blockchain Integration
Why? Post-crypto winter, serious institutional adoption of DeFi is happening under regulated models.
Market Implications:
Ethereum and newer chains like Solana could see super cycle price surges.
Traditional finance will start integrating blockchain infrastructure (e.g., tokenized bonds, real estate).
Trading Tip: Long horizon positions in select Web3 tokens, DeFi apps, and stablecoin rails.
Section 4: Risks That Could Disrupt the Super Cycle
Super cycles aren’t guaranteed. Several factors can derail or delay them:
Geopolitical Tensions – Taiwan Strait, Middle East, Russia-Ukraine could fracture global trade.
Inflation Persistence – Sticky inflation may force central banks to tighten longer.
Tech Bubble 2.0 – Overhyped AI or green tech stocks could deflate.
Debt Crisis – Soaring global debt levels could trigger defaults or banking stress.
Climate Black Swans – Extreme weather events might upend agriculture, insurance, or energy markets.
Mitigation Strategy for Traders: Use options hedging, sector rotation, and diversified portfolio allocations. Follow global macro signals religiously.
Section 5: Trading Strategies to Ride the 2025–2030 Super Cycle
1. Thematic ETFs & Sectoral Allocation
Invest in AI, green energy, EM consumption, blockchain infrastructure via sector-focused ETFs.
2. Momentum & Breakout Trading
Super cycles create strong trend-following environments. Use weekly/monthly breakout setups for swing trades.
3. Options Writing with Super Cycle Bias
Sell puts on long-term bullish assets to accumulate at lower prices.
Use vertical spreads to capture trend-based price movement.
4. Position Trading in Commodities
Long metals and energy on dips; stay alert to seasonal and geopolitical triggers.
Super cycles often start in commodity inflation before equity re-ratings.
5. SME IPO Participation
India's SME boom is part of its structural super cycle. High-risk, high-reward territory for traders.
Use strict due diligence, avoid hype-based entries.
6. Macro Event Calendar Trading
Plan around key policy events: U.S. Fed meets, BRICS summits, G20, COP summits, Indian Budget, etc.
These can signal inflection points within super cycles.
Conclusion: Prepare, Don’t Predict
The 2025–2030 super cycle is forming amidst rapid technological shifts, rising geopolitical complexity, climate urgency, and generational demographic changes. Traders who align their strategies with these megatrends—rather than chasing short-term narratives—stand to benefit the most.
Use this cycle not just to profit, but to learn, adapt, and evolve as a market participant.
Part4 Institution Trading Options trading in India is governed by SEBI and offered by NSE and BSE. Most options are European-style, meaning they can be exercised only on expiry day (unlike American options which can be exercised any time before expiry).
Popular instruments:
Index Options: Nifty 50, Bank Nifty, Fin Nifty
Stock Options: Reliance, HDFC Bank, Infosys, etc.
Example Trade
Suppose Nifty is at 22,000. You expect it to rise. You buy a Nifty 22,200 CE (Call Option) at ₹100 premium, lot size 50.
If Nifty goes to 22,400 → intrinsic value = 200, profit = ₹100 × 50 = ₹5,000
If Nifty stays at or below 22,200 → Option expires worthless, loss = ₹5,000
This asymmetry is what makes options attractive for speculation.
1. Retail Traders
Mostly use options for directional bets and small capital plays.
2. Institutions (FIIs, DIIs)
Use options for complex hedging and large-volume strategies.
3. Hedgers
Use options to reduce portfolio risk.
4. Speculators
Profit from volatility or short-term price movements.

Technical Analysis for Modern MarketsIn the ever-evolving world of financial markets, Technical Analysis (TA) has remained one of the most powerful tools used by traders and investors to make informed decisions. From analyzing simple price charts to applying advanced indicators with the help of AI and automation, technical analysis has transformed over the years to suit modern, fast-paced markets.
Whether you are a beginner looking to understand the basics or an experienced trader aiming to sharpen your strategies, this guide covers everything you need to know about Technical Analysis in Modern Markets — in detail, with practical insights, and in simple language.
1. What is Technical Analysis?
Technical Analysis is the study of past market data—primarily price and volume—to forecast future price movements.
In contrast to Fundamental Analysis, which evaluates a stock’s intrinsic value based on financials, management, and industry outlook, Technical Analysis focuses purely on the chart—believing that all information is already reflected in the price.
In today’s markets, TA is used not just for stocks but also for commodities, forex, cryptocurrencies, indices, and even real estate.
2. The Core Assumptions of Technical Analysis
Technical Analysis is built on three core beliefs:
1. The Market Discounts Everything
All known and unknown information (news, earnings, policies, emotions) is already reflected in the stock price.
2. Prices Move in Trends
Prices don’t move randomly—they follow identifiable trends that can persist over time (uptrend, downtrend, or sideways).
3. History Tends to Repeat Itself
Markets are driven by human psychology. Since human behavior often repeats under similar circumstances, price patterns tend to reoccur over time.
3. Key Components of Technical Analysis
### A. Price Charts
Charts are the foundation of TA. The most commonly used are:
Line Chart – Simplest form; connects closing prices.
Bar Chart – Displays open, high, low, and close.
Candlestick Chart – Most popular today; each candle shows open, high, low, close and reflects market sentiment visually.
Why Candlesticks Rule Modern Markets?
Candlesticks are ideal for fast decision-making. Bullish and bearish candlestick patterns (like Doji, Hammer, Engulfing, etc.) reveal trader emotions and potential reversals.
B. Trendlines and Channels
Trendlines: Lines drawn to connect swing highs or lows to identify direction.
Channels: Parallel lines creating a trading range.
They help traders identify support (price floor) and resistance (price ceiling) zones.
C. Support and Resistance
These are zones where prices tend to pause, reverse, or consolidate.
Support: Where buying interest is strong enough to overcome selling pressure.
Resistance: Where selling pressure overcomes buying interest.
These zones become crucial decision points for entry, exit, or reversal trades.
4. Indicators and Oscillators – Modern Trader’s Tools
Technical indicators are mathematical calculations based on price, volume, or open interest. They are divided into:
A. Trend-Following Indicators
1. Moving Averages (MA)
Simple Moving Average (SMA): Average price over a period.
Exponential Moving Average (EMA): Gives more weight to recent data.
Used to identify trends and their strength. A common setup: 50 EMA and 200 EMA crossover (Golden Cross, Death Cross).
2. MACD (Moving Average Convergence Divergence)
Helps traders spot changes in trend momentum and potential reversals.
B. Momentum Indicators
1. RSI (Relative Strength Index)
Measures momentum on a scale of 0 to 100.
RSI above 70 = Overbought; Below 30 = Oversold.
2. Stochastic Oscillator
Compares a stock’s closing price to its range over a certain period. Useful in choppy, range-bound markets.
C. Volatility Indicators
1. Bollinger Bands
Created using a moving average and two standard deviation lines.
Price touching upper band = overbought.
Price touching lower band = oversold.
Bollinger Band squeeze indicates a big move coming (expansion phase).
D. Volume-Based Indicators
1. On-Balance Volume (OBV)
Tracks buying/selling pressure based on volume flow.
2. Volume Profile
Modern tool showing volume at different price levels, not just over time.
5. Chart Patterns – Price Action Signals
Chart patterns are repetitive formations on price charts that indicate potential breakouts or reversals. They are divided into:
A. Reversal Patterns
Head & Shoulders (top = bearish, bottom = bullish)
Double Top/Bottom
Triple Top/Bottom
B. Continuation Patterns
Triangles (Symmetrical, Ascending, Descending)
Flags & Pennants
Cup & Handle
These patterns, if confirmed by volume and breakout, give high-probability trade signals.
Conclusion
Technical Analysis is both an art and a science. It’s not about predicting the future with certainty but about stacking probabilities in your favor. In modern markets flooded with data, volatility, and emotion, TA gives you structure, clarity, and a rules-based approach to decision-making.
Whether you are trading Nifty options, cryptocurrencies, or global stocks, technical analysis empowers you to ride the trend, control risk, and stay disciplined.

Can HDFC Bank pull Nifty up?HDFC Bank may maintain its support in the ongoing Wave 2. If this kicks in, we may see Nifty going up again, possibly tomorrow.

Technical Analysis MasteryTechnical analysis (TA) is the study of past market data, primarily price and volume, to forecast future price movements. It’s a cornerstone of trading strategies across financial markets—stocks, forex, commodities, cryptocurrencies, and indices. Mastery in technical analysis involves not just understanding charts and indicators, but also developing the discipline, psychology, and pattern recognition necessary to navigate market behavior effectively.
1. The Foundations of Technical Analysis
1.1. What is Technical Analysis?
Technical analysis is based on the premise that historical price action reflects all available information and that price movements tend to follow trends. Unlike fundamental analysis, which looks at intrinsic value, TA focuses purely on chart patterns, price actions, and statistical indicators.
1.2. Core Assumptions
Technical analysis rests on three core assumptions:
The market discounts everything: All information is already reflected in the price.
Prices move in trends: Once a trend is established, it’s likely to continue until a reversal.
History repeats itself: Price patterns tend to repeat over time due to market psychology.
2. Charts: The Canvas of TA
2.1. Types of Charts
Line Chart: Simplest form, connecting closing prices.
Bar Chart: Shows open, high, low, and close (OHLC).
Candlestick Chart: Visualizes price action more clearly; green (bullish) and red (bearish) candles indicate market sentiment.
2.2. Time Frames
Technical analysis can be applied to any time frame:
Intraday: 1-min, 5-min, 15-min for day traders.
Short-term: Hourly, daily for swing traders.
Long-term: Weekly, monthly for position traders and investors.
Choosing the right time frame depends on your trading style and strategy.
3. Trend Analysis
Understanding and identifying trends is essential.
3.1. Types of Trends
Uptrend: Series of higher highs and higher lows.
Downtrend: Series of lower highs and lower lows.
Sideways/Range-bound: Price oscillates between support and resistance.
3.2. Trendlines and Channels
Trendlines: Diagonal lines connecting swing highs or lows, used to identify direction.
Channels: Parallel trendlines that show a trading range within a trend.
Breakouts from channels often signal strong moves.
4. Support and Resistance
Support and resistance levels are key to understanding market psychology.
4.1. Support
A price level where demand is strong enough to prevent further decline.
4.2. Resistance
A price level where selling pressure prevents further price increases.
These levels act like barriers—prices tend to bounce from them or break through with strong momentum.
4.3. Role Reversal
Once broken, support can become resistance and vice versa.
5. Indicators and Oscillators
These tools help traders confirm trends and identify overbought or oversold conditions.
5.1. Moving Averages
Simple Moving Average (SMA): Average price over a specified period.
Exponential Moving Average (EMA): Gives more weight to recent data.
Golden Cross/Death Cross: Signals from SMA/EMA crossovers (e.g., 50-day crossing 200-day).
5.2. Momentum Indicators
Relative Strength Index (RSI): Measures speed and change of price movements. (70 = overbought, 30 = oversold).
Stochastic Oscillator: Compares a specific closing price to a range of prices over time.
MACD (Moving Average Convergence Divergence): Shows momentum and trend direction via EMA crossovers and histogram.
5.3. Volume Indicators
On-Balance Volume (OBV): Uses volume flow to predict price changes.
Volume Moving Average: Tracks average volume to highlight spikes or drops in interest.
Conclusion
Technical Analysis Mastery is a journey that blends art and science. It requires a deep understanding of price action, chart patterns, and market psychology. Success comes from patience, continual learning, and disciplined execution.
Master traders don’t predict—they react. They use technical analysis not as a crystal ball, but as a probability tool to stack the odds in their favor. Whether you're a day trader seeking quick scalps or a long-term investor identifying optimal entry points, technical analysis offers a structured, repeatable approach to navigating the financial markets.
With dedication, practice, and discipline, you can turn charts into insights—and insights into consistent profits.
Retail Speculation & Margin Debt SurgeIntroduction
Retail speculation and the surge in margin debt are two intertwined phenomena that reflect the sentiment, behavior, and sometimes irrational exuberance of retail investors in financial markets. While speculation is not inherently negative, excessive speculative activity—especially when fueled by borrowed money—can amplify market volatility and contribute to asset bubbles and subsequent crashes. This essay delves into the mechanisms, historical context, driving forces, and implications of retail speculation and rising margin debt, using data and examples from key financial events, including the dot-com bubble, the 2008 financial crisis, and the post-COVID bull market.
Understanding Retail Speculation
Retail speculation refers to the activity of non-professional investors—often individuals trading for personal gain—who make investment decisions primarily based on price momentum, sentiment, hype, or news, rather than fundamental analysis. Speculators typically seek short-term gains, and in bullish markets, they are drawn to high-risk, high-reward assets such as penny stocks, cryptocurrencies, meme stocks, or options.
Characteristics of Retail Speculation
Short-term focus: Most retail speculators are not long-term investors. Their trades are usually driven by the hope of quick profits.
High-risk instruments: Options trading, leveraged ETFs, and volatile small-cap stocks are often preferred.
Influence of social media and forums: Platforms like Reddit (e.g., WallStreetBets), YouTube, and Twitter have become powerful tools for spreading speculation-driven narratives.
Emotional trading: Greed and fear dominate speculative behavior, often leading to herd mentality.
What Is Margin Debt?
Margin debt refers to money borrowed by investors from brokers to purchase securities. Buying on margin amplifies both gains and losses, making it a double-edged sword. When margin debt increases substantially during bull markets, it suggests rising confidence and risk appetite. However, it also raises the fragility of the financial system, as sharp downturns can trigger forced liquidations and margin calls.
How Margin Works
Investors must open a margin account and maintain a minimum margin requirement. They borrow funds against their existing holdings as collateral. If the value of their holdings drops below a certain threshold, they face a margin call—they must either deposit more funds or sell assets to cover losses.
Historical Context: Booms, Bubbles, and Crashes
Retail speculation and margin debt surges are not new. Throughout financial history, periods of easy money and technological disruption have often led to waves of speculative fervor, followed by painful corrections.
1. The 1929 Crash and the Great Depression
In the late 1920s, a surge in retail investing, fueled by margin loans, led to unprecedented levels of speculation. By 1929, over 10% of U.S. households owned stock, many with borrowed money. Margin requirements were often as low as 10%. The market crash in October 1929 wiped out millions of investors, and the excessive margin played a significant role in deepening the crash.
2. The Dot-Com Bubble (Late 1990s – 2000)
During the dot-com era, retail investors were drawn to internet startups with little or no earnings. Margin debt surged along with valuations. Many speculators bought tech stocks on margin, hoping to capitalize on exponential growth. When the bubble burst in March 2000, the NASDAQ lost nearly 80% of its value over the next two years, and investors faced massive margin calls.
3. The 2008 Financial Crisis
Although retail speculation played a smaller role than institutional excesses, margin debt was again at high levels before the collapse. Hedge funds and some retail investors used leverage to increase exposure to mortgage-backed securities and stocks. When Lehman Brothers collapsed, widespread deleveraging followed.
Implications and Risks
1. Amplification of Market Volatility
When large numbers of investors trade on margin, small price declines can lead to forced selling. This selling pressure pushes prices down further, triggering more margin calls—a vicious cycle that can exacerbate crashes.
2. Asset Bubbles
Speculative fervor often inflates asset prices beyond fundamental value. The tech bubble, meme stocks, and cryptocurrencies like Dogecoin (which had little intrinsic value but saw massive price spikes) are examples. When sentiment shifts, these assets often collapse in value.
3. Retail Investor Losses
While some retail traders made fortunes during speculative booms, the vast majority lost money, especially those who entered near the peak. Trading on margin magnifies losses, sometimes wiping out entire accounts.
4. Systemic Risk
Though retail investors are not as systemically significant as large institutions, high levels of leverage across many accounts can create systemic risks, especially when linked with broader market structures like derivatives and ETFs.
Risk Management and Investor Behavior
Retail investors often underestimate the risks of margin trading, especially during euphoric markets.
Best Practices
Understand margin mechanics: Know how margin calls work and the impact of volatility.
Limit exposure: Avoid using maximum leverage.
Diversify holdings: Spread investments across asset classes to reduce risk.
Set stop-losses: Automatically limit downside.
Stay informed: Monitor market trends, economic indicators, and company fundamentals.
Conclusion
Retail speculation and surges in margin debt are recurring features of financial markets. They reflect the optimism—and sometimes irrational exuberance—of individual investors who seek to ride market waves for profit. While such behavior can inject liquidity and vibrancy into markets, it also brings significant risks. When speculation is fueled by leverage, the consequences of a downturn can be severe, both for individuals and the broader financial system.

Gold, Silver & Commodity Trading (MCX)What is MCX (Multi Commodity Exchange)?
The Multi Commodity Exchange of India Ltd. (MCX) is a government-regulated commodity derivatives exchange, launched in 2003. It is regulated by SEBI (Securities and Exchange Board of India) and allows traders to buy and sell commodity futures contracts across various categories like:
Bullion: Gold, Silver
Energy: Crude oil, Natural gas
Base Metals: Copper, Zinc, Lead, Aluminum, Nickel
Agricultural commodities: Cotton, Cardamom, Mentha Oil
MCX operates similarly to stock exchanges like NSE or BSE but deals in commodity contracts rather than equities.
Factors That Influence Gold & Silver Prices
Understanding price drivers helps traders anticipate market movement:
🏦 1. Global Economic Conditions
Inflation
Recession fears
GDP data
🪙 2. Currency Movements
Gold is priced in USD globally. The USD-INR exchange rate significantly impacts domestic prices.
📉 3. Interest Rates
Rising interest rates make non-yielding assets like gold less attractive, pushing prices lower, and vice versa.
💥 4. Geopolitical Tensions
War, political instability, or crisis (Middle East conflict, Ukraine war, etc.) often boost gold/silver prices.
🛢️ 5. Crude Oil Prices
High oil prices can lead to inflation, making gold more attractive as a hedge.
💼 6. Central Bank Policies
Actions by RBI or Federal Reserve (US) in terms of gold reserves, rate hikes, or monetary policy changes affect sentiment.
Hdfc Bank: Go Short till 1940.50 stop 2053Hdfc Bank consolidation is happening and it may retrace down to it's trend support line Near 1940. Keep an eye towards rejection 2030 where it may get hurdle and nay fall to take a support.
It's a regular pattern for this script.. Ut recently made anew high on the charts.
Hurdle 2035-2050
Support 1940.50

Learn Institutional Trading🏛️ Learn Institutional Trading
Step into the world of smart money and learn how the big players trade!
Institutional Trading isn’t about following indicators—it’s about understanding market structure, liquidity, and smart money moves.
🔍 What You’ll Learn:
Market Structure – Trends, ranges, and liquidity zones
Smart Money Concepts – Accumulation , distribution , and manipulation traps
Volume & Order Flow – See what the institutions see
Precision Entries – No guessing, just calculated moves
Risk Management – Trade like a pro, protect your capital
💡 Why It Matters:
Retail traders often get trapped 🚧 by institutional strategies. When you learn how institutions think and operate, you stop reacting and start predicting market behavior.
🚀 Final Thought:
Think like a pro. Trade like an institution. 🏛️ Win with structure.
Learn Institutional Trading and transform the way you see the market—forever

Technical Analysis vs Fundamental AnalysisWhat’s the Difference?
When people analyze stocks or any tradable asset, they usually follow one of two main approaches: Technical Analysis or Fundamental Analysis. Each one is like using a different lens to look at the same object. Both methods try to answer the same question:
“Should I buy, sell, or avoid this stock?”
But how they arrive at that answer is completely different.
1️⃣ What is Technical Analysis?
Technical Analysis is all about reading charts. It’s based on the belief that everything that affects a stock's price is already reflected in the stock price itself.
So instead of reading about a company's earnings or business strategy, technical analysts look at price movements, trading volumes, and patterns on charts to try to guess what might happen next.
How It Works:
Technical traders believe that history repeats itself.
Price moves in trends — up, down, or sideways.
Patterns like flags, triangles, and head-and-shoulders are seen as hints.
Indicators like RSI (Relative Strength Index), MACD (Moving Average Convergence Divergence), and moving averages are used to make decisions.
Key Concepts in Technical Analysis:
Candlestick Patterns: These show how the price moved in a given time — whether buyers or sellers were in control.
Support & Resistance: Support is a price level where a stock tends to stop falling. Resistance is where it often stops rising.
Volume: Helps you understand the strength behind a price movement.
Breakouts & Reversals: Important signals that indicate possible trend changes.
Real-Life Example:
Let’s say Stock A is trading at ₹500. It has bounced from this price three times before. That level becomes a support. If it suddenly jumps above ₹550 with high volume, that could be seen as a breakout, and a trader might enter a short-term position.
Pros of Technical Analysis:
Helpful for short-term trading like intraday or swing trades.
Fast decision-making based on visual cues.
Doesn’t require knowledge of a company’s financials.
Can be used across all asset classes (stocks, forex, commodities, crypto).
Cons of Technical Analysis:
It doesn’t look at what the company actually does.
False signals can mislead.
It works on probability — not certainty.
Can be overwhelming with too many indicators.
2️⃣ What is Fundamental Analysis?
Fundamental Analysis is like doing background research on a company before deciding whether to invest in it. Instead of looking at charts, you look at the company’s financial health, industry conditions, economic trends, and management quality.
The main goal is to find the true value (intrinsic value) of a stock and compare it with the current market price.
How It Works:
If the intrinsic value is more than the market price, the stock is considered undervalued and worth buying.
If the market price is more than the intrinsic value, it’s seen as overvalued, and better to avoid or sell.
Key Tools of Fundamental Analysis:
Financial Reports: Balance Sheet, Income Statement, Cash Flow Statement.
Ratios: PE (Price-to-Earnings), ROE (Return on Equity), Debt-to-Equity, EPS (Earnings Per Share).
Company's Business Model: What the company does, how it earns, and whether it's sustainable.
Management Quality: Experience and vision of the leadership.
Industry & Economy: Is the industry growing? Are economic conditions favorable?
Pros of Fundamental Analysis:
Ideal for long-term investment.
Helps understand the actual business you’re putting money into.
Less affected by short-term volatility.
Encourages rational decision-making.
Cons of Fundamental Analysis:
Takes time and effort to study.
May not tell you when exactly to buy or sell.
Requires understanding of finance, economics, and accounting.
Stock may stay undervalued for a long time despite good fundamentals.
✅ Which One Should You Choose?
It all depends on your personality, goals, and time commitment.
Go for Technical Analysis if:
You’re active and want to trade daily or weekly.
You like working with patterns and visuals.
You want to time your entry and exit precisely.
You are okay with taking risks for quick gains.
Go for Fundamental Analysis if:
You think long-term and want to build wealth.
You want to invest in solid companies.
You have patience and a stable mindset.
You prefer logic and numbers over charts.
⚖️ Can You Combine Both?
Yes, and that’s what many experienced market participants do.
This combined approach is called techno-fundamental analysis.
For example:
You use fundamentals to select a good company.
You use technicals to find the right entry point.
This way, you get the best of both worlds.
🧠 Final Thought
There’s no universal rule that says one method is always better. It’s all about what suits your style and objective.
If you’re building a portfolio for retirement or wealth over 10+ years, fundamental analysis is your friend.
If you want to trade actively and spot market opportunities daily or weekly, technical analysis is the way to go.
Over time, learning both will make you a more flexible and better-informed market participant.
HDFCBANK 1D TimeframeClosing Price: ₹2,004.60
Opening Price: ₹2,018.80
Day’s High: ₹2,028.00
Day’s Low: ₹1,996.75
Net Change: –₹16.10 (–0.80%)
Trend: Mild Bearish
🔻 Support Levels
₹1,985 – Immediate support (20-day moving average)
₹1,950 – Short-term support (50-day moving average)
₹1,910 – Medium support (100-day moving average)
🔺 Resistance Levels
₹2,030 – Recent swing high and near-term resistance
₹2,050 – Breakout zone if momentum picks up
₹2,100 – Major resistance area
📈 Technical Indicators
RSI (Relative Strength Index): ~62
➤ In neutral to bullish territory, showing healthy momentum but close to overbought levels.
MACD (Moving Average Convergence Divergence):
➤ MACD line above Signal line – currently a bullish signal.
Volume:
➤ Normal trading volume; no heavy buying or panic selling.
➤ Indicates steady participation from both retail and institutional investors.
Candlestick Pattern:
➤ Small bearish candle after a strong bullish move earlier in the week.
➤ Indicates temporary profit booking or hesitation near resistance zone.
🧠 Market Sentiment
Overall sentiment remains positive for HDFC Bank due to:
Strong financials and balance sheet
Good loan growth reported in recent results
High investor confidence post bonus issue announcement
However, profit booking is likely near ₹2,030 as it is a psychological and technical resistance.
✅ Conclusion
Short-Term View: Mild pullback within an uptrend; no major weakness.
Medium-Term Trend: Still bullish as price remains above key moving averages.
Action to Watch:
A breakout above ₹2,030 may trigger a rally toward ₹2,050+.
A drop below ₹1,985 may invite short-term selling toward ₹1,950.
Technical Class📚 Technical Class
A Technical Class in trading is a structured learning program focused on teaching you how to read and analyze price charts 📈, indicators 📊, and market patterns 🔁 to make smart and profitable trading decisions.
In a good technical class, you’ll learn to:
🔍 Read candlestick charts like a pro
🧱 Identify support & resistance levels
📉 Spot breakouts, fakeouts, and trend reversals
🔄 Use moving averages, RSI, MACD, and volume tools
🧠 Understand market psychology through patterns
📌 Time your entry and exit points with precision
⚖️ Combine multiple indicators for confirmation
These classes are perfect for:
🚀 Beginners who want to build a strong foundation
📈 Intermediate traders ready to sharpen their skills
🎯 Anyone looking to trade based on logic, not emotion
📌 In simple words:
A Technical Class teaches you how to "read the market" — using charts, patterns, and indicators — so you can trade with confidence, clarity, and strategy.

Advance Option Trading🔶 What Is Advanced Options Trading?
Advanced Options Trading goes beyond buying and selling simple Calls and Puts. It’s about using multi-leg strategies, managing risk with precision, applying greeks and volatility, and aligning your trades with market conditions.
Advanced traders treat options like a math-based chess game. They don’t gamble—they strategize, hedge, spread, and use data-driven decisions to extract profits in all kinds of markets (bullish, bearish, sideways, volatile, calm).
🔍 Why Learn Advanced Options Trading?
While beginners just "buy options" hoping for a quick profit, advanced traders use options to:
Control risk
Earn consistent income
Capitalize on volatility
Trade sideways or range-bound markets
Create hedges for portfolios
Use smart capital deployment with defined risk
2️⃣ Implied Volatility (IV)
IV tells you how expensive or cheap options are.
📈 High IV = Options are expensive → Ideal for selling
📉 Low IV = Options are cheap → Ideal for buying
Advanced traders use:
IV Rank / IV Percentile
Volatility skew analysis
Volatility crush trades around earnings or events
3️⃣ Option Strategies
Here’s where real skills come in. Advanced trading uses multi-leg strategies to limit loss, increase odds, or make money in non-directional moves.
🔍 Strategy Example: Iron Condor
Sell 22000 CE
Sell 21800 PE
Buy 22100 CE (hedge)
Buy 21700 PE (hedge)
You’ll profit if the index stays between 21800 and 22000, and time decay works in your favor.
✅ Defined risk
✅ Limited profit
✅ Great for expiry week if market is range-bound
💹 Advanced Techniques for Smart Trading
Let’s now explore how pros operate:
🔸 A. Delta-Neutral Trading
Institutional or advanced traders often create delta-neutral positions—no directional bias.
Example:
Buy Call option (Delta +50)
Sell Put option (Delta -50)
Net Delta = 0 → Neutral. The position doesn’t care which way market moves—only volatility or time decay matters.
🔸 B. Hedging with Options
Advanced traders hedge their stock or futures positions using options.
Example:
You hold ₹5 lakh worth of Reliance shares
You buy Reliance PUT options to protect downside risk
Result? You keep profits if stock goes up and protect capital if it drops. It's like insurance.
🔸 C. Trading Earnings or Events
Options let you trade volatility, not just direction. Ahead of events like:
Earnings reports
RBI or Fed meetings
Budget announcements
You can use:
Straddles / Strangles (if expecting big move)
Iron Condors (if expecting no major move)
Calendar spreads (to exploit IV difference)
🔸 D. IV Crush Strategy
Before major events, IV rises. After the event, IV drops (called IV crush).
Advanced traders:
Sell options before events (high premium)
Buy options after IV crash (cheap premium)
They know when NOT to buy options just before news—because premium is inflated!
🔸 E. Adjusting Trades
Advanced traders don’t just “hope” for success. If a trade goes wrong, they adjust it:
Roll to a new strike
Convert from debit to credit spreads
Hedge with opposite positions
Manage Delta/Theta/Vega exposure
This proactive style protects capital and increases recovery chances.
🛠️ Tools Used by Advanced Option Traders
Opstra / Sensibull – Strategy builder, Greek analyzer
TradingView – Charting & technical levels
OI Analysis Platforms – For understanding institutional footprints
Python / Excel – Custom backtesting tools
Algo Platforms – For speed and logic-based execution
📌 Important Rules for Advanced Option Traders
Don't chase trades. Let trades come to you.
Always define risk before entering.
Use multi-leg setups, not naked options unless there's an edge.
Stay Theta positive in low volatility markets.
Only buy options when IV is low and breakout is expected.
✅ Final Thoughts
Advanced options trading is a skillset—not a shortcut.
If you:
Want consistent profits
Wish to trade like institutions
Hate gambling and want a plan
Love logic, numbers, and control
…then advanced option trading is your next big step.
It gives you the tools to win in all market types, not just trending ones.

Trading Master Class With Experts🎯 Objective of the Master Class
To turn intermediate or beginner traders into independent, high-probability traders.
To teach institutional strategies, advanced technical analysis, and options trading mechanics in a structured manner.
To prepare you to read price action, understand market psychology, and act with professional-level discipline.
🧑🏫 Who Are the Experts?
The instructors in a true master class are:
Institutional Traders
Full-time Professional Derivatives Traders
Algo Strategists
Portfolio Managers
Ex-Prop Desk Heads or FIIs Participants
These experts bring real P&L experience, not just theoretical certifications. They share their actual setups, mental models, risk frameworks, and do’s and don’ts from years of screen time.
📦 What You Will Learn – Detailed Modules
Module 1: Market Structure Mastery
Institutional order flow
Supply-demand vs. retail S/R
Liquidity traps and smart money movement
Module 2: Price Action + Volume Profiling
Multi-timeframe analysis
Candle psychology + Volume interpretation
How institutions "hide" their entries
Module 3: Advanced Options Trading
Intraday & positional strategies
Greeks mastery: Delta, Vega, Theta, Gamma
Hedging tactics used by professionals
Nifty & Bank Nifty strategy building
Module 4: Institutional Strategy Replication
Intraday straddle/strangle writing
IV crush exploitation during events
Option chain decoding for retail edge
Module 5: Trade Management & Psychology
Risk per trade, max drawdown, win/loss ratio
Building discipline like a hedge fund
Overcoming emotional sabotage in trading
Module 6: Live Market Sessions
Daily planning with expert insights
Live trades with explanation
Review of success/failure transparently
⚙️ Tools & Platforms You’ll Use
Option Chain Analyzers (like Sensibull, Opstra, or Greek tools)
TradingView & charting setup with expert templates
Journaling tools (Edgewonk, Notion)
Algo tools (optional module)
🧩 Who Should Join?
✅ Aspiring Traders (with some basic knowledge)
✅ Traders struggling with consistency
✅ Intraday or options traders wanting a structured framework
✅ Professionals looking to shift to full-time trading
✅ Students of finance or markets seeking practical skills
🏆 Key Benefits
Real strategies shared by real traders
Mentorship: Learn not just from books, but from mistakes and success of mentors
Live sessions to build confidence under pressure
Lifetime recording access in most premium programs
Community access for continuous growth & trade sharing
💼 Career & Income Impact
After attending this masterclass, traders often:
Gain clarity on their trading edge
Improve win-rate and risk-adjusted returns
Start coaching others or creating communities
Join or create proprietary trading setups
📅 Duration & Format
Duration: 1 Week to 6 Weeks (varies by provider)
Format: Live Zoom + Recorded + Assignments
Support: Telegram/Slack group, weekly Q&A, live trading calls
🔚 Final Thoughts
The “Trading Master Class with Experts” is not just another online program. It's a live, applied, market-tested mentorship where real experts guide you step-by-step in mastering trading psychology, strategy, and discipline.
If you're serious about scaling your trading journey, this is the fastest shortcut to reach professional-level execution and understanding.

Trading Master Class With Experts🔰 Introduction
In today’s fast-moving financial markets, trading has evolved from basic buying and selling to data-driven strategies, advanced analysis, and systematic execution. A Trading Master Class With Experts is not just another course—it’s a comprehensive mentorship program that bridges the gap between beginner-level knowledge and professional-level performance.
This class is designed for those who are serious about trading as a skill, business, or career, and who want to learn directly from experienced traders, analysts, and market strategists. The program focuses on real-time learning, practical strategies, market psychology, and risk management, giving participants the tools to trade confidently and consistently.
🎯 Objective of the Master Class
The primary goal of the Trading Master Class With Experts is to transform retail traders into independent, strategy-based professionals. It’s structured to help you:
Understand how markets really work
Learn proven strategies from professional traders
Avoid common beginner mistakes
Build and test your own trading system
Develop the mindset and discipline of institutional-level traders
🧠 What You Will Learn
This master class covers a holistic approach to trading with a strong focus on practical execution, including:
🔍 1. Market Basics & Trader Foundation
How stock markets work
Key players: Retail vs Institutions
Types of markets: Bullish, Bearish, Sideways
Trading styles: Intraday, Swing, Positional, Scalping
Asset types: Equity, Derivatives, Forex, Crypto, Commodities
🕯️ 2. Technical Analysis
Reading and analyzing candlestick patterns
Support and Resistance theory
Trend identification and trendline accuracy
Price Action-based entry and exit techniques
Volume analysis and institutional behavior spotting
📊 3. Indicators and Tools
Moving Averages (SMA, EMA)
RSI, MACD, Bollinger Bands, Supertrend
Fibonacci retracement and projection
Volume Profile and VWAP
How to avoid indicator overloading
🧱 4. Chart Patterns & Setups
Reversal patterns: Double Top/Bottom, Head and Shoulders
Continuation patterns: Flags, Pennants, Triangles
Breakout trading vs Pullback trading
Building entry/exit rules with confirmation signals
🧮 5. Options and Futures Trading (Optional Module)
Understanding Calls and Puts
Option chain analysis and Open Interest
Option Greeks (Delta, Theta, Vega, Gamma)
Directional vs Non-directional option strategies
Institutional Option Trading Techniques
💹 6. Risk Management
Capital allocation methods
Risk-to-reward ratio and win-rate planning
Stop-loss and trailing stop methods
Diversification and exposure control
Avoiding overtrading and emotional decisions
🧘 7. Trading Psychology & Discipline
How to handle losses without fear
Dealing with greed and overconfidence
Mindset of a consistent trader
Journaling, post-trade analysis, and routine building
💻 8. Live Trading & Practical Learning
Real-time market sessions with expert commentary
Watching experts plan, execute, and review trades
Hands-on assignments and trade simulations
Market opening/closing routines
Building your personal trading plan
🔧 Advanced Topics (for Experienced Traders)
Institutional Trading Strategies
Smart Money Concepts
Volume Spread Analysis (VSA)
Multi-leg Option Strategies
Algo-trading basics (optional)
Trading Journals and performance analysis tools
👨🏫 Who Are the Experts?
This master class is conducted by a team of seasoned professionals:
Full-time traders with 10+ years of market experience
Certified technical analysts and SEBI-registered mentors
Option strategists and quantitative traders
Risk managers and trading psychologists
They provide you with:
Live mentorship
Real trade breakdowns
Direct Q&A sessions
Feedback on your trading plans
👥 Who Should Join This Master Class?
This program is ideal for:
Aspiring traders who want to start with clarity
Traders stuck at breakeven or in losses
Professionals looking to become part-time traders
Students or working individuals with serious interest in trading
Anyone who wants to trade like an institution, not a gambler
📜 Certification & Support
Upon completion, you will receive:
A certificate of participation
Access to recorded sessions
A trading toolkit: Checklists, planners, and journals
Lifetime access to community/mentorship group
🧭 Final Words
A Trading Master Class With Experts is not about shortcuts or tips. It’s a structured pathway to build you into a professional-level trader who understands risk, follows a system, and survives long-term.
Markets will always test you—but this master class gives you the skills, mindset, and mentorship to pass every test with confidence.

Global Factors Impacting Indian MarketsIntroduction
The Indian stock market, like any other major market, is deeply interconnected with global events. While domestic news like RBI policy, election results, or monsoons do influence our stocks, global factors often act as the real drivers behind sharp up-moves or crashes.
Whether you're an investor, trader, or analyst, understanding how global cues influence Nifty, Bank Nifty, Midcaps, and even commodities is essential for smart decision-making.
In this explanation, we’ll break down the major global factors, how they affect Indian markets, and what traders should watch daily and weekly.
1. U.S. Federal Reserve & Interest Rates (Fed Policy)
Why it matters:
The U.S. Federal Reserve’s interest rate decisions directly impact global liquidity. When the Fed raises rates, money becomes costlier. Foreign investors often pull out from emerging markets like India to invest in safer U.S. bonds.
Impact on India:
Rising U.S. interest rates = FII selling in India
Weakens rupee, inflates import costs (e.g., crude oil)
Tech & high-growth sectors take a hit (especially those sensitive to valuations)
2. Crude Oil Prices
India is a major oil importer—more than 80% of our crude is imported. Crude price volatility has massive ripple effects across inflation, currency, fiscal deficit, and stock market sectors.
Impact on India:
High crude = inflation + weak rupee + fiscal stress
Negatively affects oil-dependent sectors like aviation, paints, logistics, autos
Boosts oil marketing companies' revenue (but hits margins if subsidies increase)
Example:
If Brent Crude moves from $70 to $95 in a month, expect:
Nifty to correct
INR to weaken vs USD
Stocks like Indigo, Asian Paints, Maruti to face pressure
💰 3. Foreign Institutional Investors (FII) Flow
FIIs bring in billions of dollars into Indian equity and debt markets. Their buying or selling behavior is often influenced by:
Global risk appetite
Currency trends
Interest rate differentials
Geopolitical tensions
When do FIIs sell?
When the dollar strengthens
When there’s fear in global markets (e.g., war, U.S. recession)
When India underperforms vs peers
When do FIIs buy?
When global liquidity is high
India shows growth resilience vs China or other EMs
Post-election clarity, reform hopes, etc.
Daily Tip:
Watch FII cash market activity—daily inflows/outflows often decide Nifty’s intraday trend.
🏦 4. U.S. Economic Data (CPI, Jobs, GDP, PCE)
Every month, the U.S. releases:
CPI (inflation data)
Jobs Report (NFP)
GDP numbers
PCE (Personal Consumption Expenditures)
These influence Fed decisions, hence impacting global markets.
Example:
A hot U.S. inflation print → Fear of more rate hikes → Nasdaq crashes → Nifty follows
A weak U.S. jobs report → Rate cut hopes → Global rally → Bank Nifty surges
Keep an eye on U.S. calendar events, especially the first Friday of every month (NFP Jobs) and mid-month (CPI release).
🌏 5. Geopolitical Tensions & Wars
Markets hate uncertainty. Global conflicts often lead to panic selling, flight to safety, and surge in gold/crude prices.
Key global risk zones:
Russia-Ukraine
Middle East (Israel-Iran, Saudi-Yemen)
China-Taiwan-U.S. tensions
Impact on India:
Spike in gold and crude
Selloff in equity markets
Rise in defensive sectors (FMCG, Pharma, IT)
Surge in defence stocks (BEL, HAL, BDL)
💱 6. Dollar Index (DXY) & USD-INR Movement
The Dollar Index (DXY) measures the dollar's strength vs other currencies.
Rising DXY = Stronger dollar = FII outflows from India = Nifty weakens
Falling DXY = More risk-on = Money flows into emerging markets = Nifty rallies
Rupee’s role:
A weak INR/USD makes imports costly → impacts inflation
A strong INR/USD helps improve trade balance → attracts investors
💹 7. Global Equity Markets (Dow Jones, Nasdaq, Asian Peers)
The Indian market is heavily influenced by:
Dow Jones, Nasdaq (overnight sentiment)
SGX/GIFT Nifty (pre-market cues)
Asian Markets (Nikkei, Hang Seng, Shanghai)
How it affects us:
Strong global cues = Nifty opens gap-up
Weak Nasdaq = IT stocks sell off at open
Mixed Asian markets = Rangebound Nifty till clarity
Pro Tip: Always check Nasdaq futures and GIFT Nifty levels before the market opens.
🧭 8. China’s Economic Health
As a large global player in manufacturing, China’s growth (or lack of it) sends signals across the world.
If China slows down:
Commodities fall (good for India)
Asian currencies weaken
Global markets get jittery
If China shows strong stimulus:
Metal stocks rally globally (Tata Steel, Hindalco benefit)
Global optimism lifts all EMs
🏦 9. Global Banking or Financial Crises
Remember the Silicon Valley Bank collapse (2023)? Or the 2008 Lehman crisis?
Global financial stress always triggers:
A sell-off in Indian banks
Panic across all indices
Shift toward safe havens (gold, USD)
Traders should monitor:
Global bond yields
Credit Default Swaps (CDS spreads rising = trouble)
Bank stress signals in Europe/U.S.
🌾 10. Global Commodity Cycles (Metals, Energy, Agri)
India, being resource-dependent, reacts to global commodity moves.
Rally in metals = Tata Steel, Hindalco, JSW Steel surge
Rally in coal, oil = Uptrend in ONGC, Coal India, Oil India
Rally in agri = FMCG and consumer food stocks affected
Keep a watch on:
LME (London Metal Exchange) prices
Global wheat/rice/cocoa/sugar trends
🛑 Final Thoughts
Global factors are not just background noise. They are active triggers that move Indian markets every single day.
A smart trader or investor should:
Track global cues as seriously as domestic ones
Prepare for overnight risks using hedges or stop losses
Read market behavior through global context, not just stock-level news
By staying connected to the world, you can stay one step ahead of the market.

HDFCBANK 1D Timeframe📈 HDFC Bank – Intraday Overview
Opening Price: Opened strong around ₹2,005–₹2,010.
Intraday High: Touched approximately ₹2,018 during early trading.
Intraday Low: Maintained support around ₹2,000.
Current Price: Trading near ₹2,016, showing a gain of around +0.8% to +0.9%.
Previous Close: ₹2,005.
🔍 What’s Driving HDFC Bank Today
Positive Earnings Effect: Strong Q1 earnings with around 12% year-on-year profit growth, bonus share announcements, and dividends have boosted buying interest.
Sector Leadership: Among the strongest performers in the banking sector, helping to support indices like Nifty50 and Bank Nifty.
Consistent Volume: Healthy trading volumes indicate sustained institutional participation.
Strong Sentiment: Momentum remains high with overall positive cues from private banking space.
📊 Technical Summary
Support Level: Strong support exists around ₹2,000–₹2,005.
Resistance Level: Intraday resistance at ₹2,018 with major resistance near ₹2,027 (recent all-time high).
Trend Direction: Bullish trend, as it is making higher lows and maintaining strength above the psychological ₹2,000 mark
✅ Summary Conclusion
HDFC Bank is trading positively today with sustained momentum after strong earnings and corporate actions. Intraday action shows bullish strength above ₹2,000, with the possibility of new highs if it crosses ₹2,018–₹2,027 levels. Technical trend remains positive to bullish for the day.

Technical Class📊 Technical Class — Complete Guide for Technical Trading
A Technical Class is focused on teaching traders how to analyze price action, chart patterns, indicators, and market behavior using technical analysis. This class is ideal for beginners and intermediate traders who want to understand how to make trading decisions based purely on market charts — without needing insider news or fundamentals.
✅ What is Technical Trading?
Technical trading means you:
Read the charts to find trading opportunities.
Use price history, patterns, and indicators to predict future price moves.
Do not rely on news, instead focus on what the market shows through charts.
Big traders (institutions) also use technical setups, combined with liquidity and order flow, making technical analysis an essential skill.
📚 What You Will Learn in a Technical Class
1. Chart Basics
Candlestick chart vs Line chart vs Bar chart
Timeframes: from 1 minute to monthly
Volume and market sessions
2. Candlestick Patterns
Reversal Patterns: Pin Bar, Engulfing, Morning Star, Evening Star
Continuation Patterns: Inside Bar, Flags, Pennants
Indecision Candles: Doji, Spinning Top
3. Support & Resistance
How to draw key support/resistance levels
Identifying key zones where price reacts
Turning resistance into support (flip zones)
4. Trend Trading Techniques
Recognizing Higher Highs and Higher Lows (uptrend)
Spotting Lower Highs and Lower Lows (downtrend)
Using Trendlines effectively
5. Indicators Used by Pros
Moving Averages (MA) — 50 EMA, 200 EMA for trend
RSI — Overbought/Oversold zones
MACD — Trend and momentum detection
Fibonacci Retracement — Spotting pullback levels
Volume Profile — Finding high-volume zones
6. Chart Patterns
Double Top/Bottom, Head & Shoulders, Triangles
Breakout Strategies — entering after confirmation
Fakeouts and Trap Patterns
7. Risk Management & Psychology
Setting proper Stop Loss (SL) and Take Profit (TP)
Position sizing: how much to risk per trade
Building discipline and patience like a pro trader.
🎯 Benefits of Learning Technical Trading
✅ Trade any market: Forex, Stocks, Crypto, Commodities
✅ Become an independent trader — no reliance on signals
✅ Combine with institutional concepts for Smart Money Trading
✅ Understand why market moves and avoid beginner mistakes
✅ Build a professional mindset with proper risk management
🎓 After Completing Technical Class You Will Be Able To:
Analyze any chart professionally
Trade with higher win-rate setups
Control risk like institutional traders
Identify market traps and avoid fakeouts
Grow your account safely with discipline + strategy.

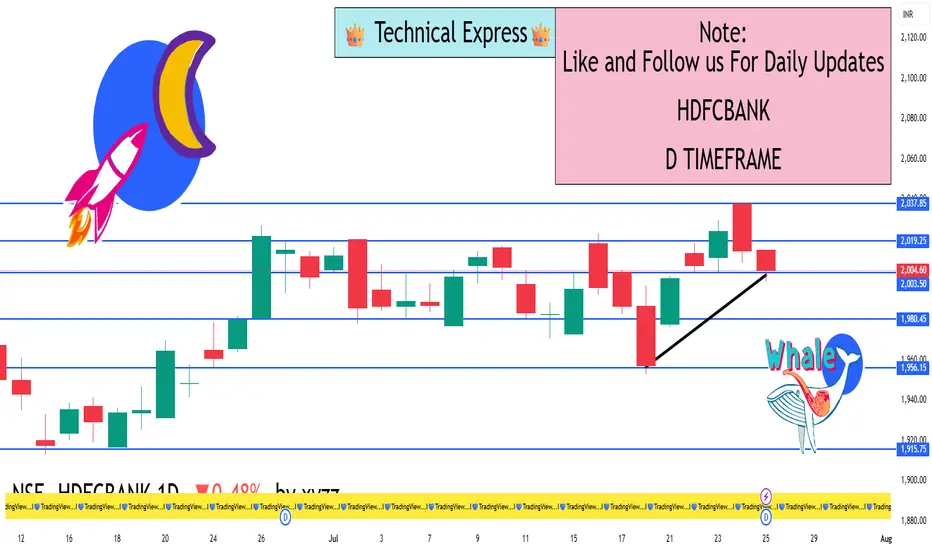
HDFCBANK – Bullish Potential Post Results, But OI Shows Bearish________________________________________________________________________________📈 HDFCBANK – Bullish Potential Post Results, But OI Shows Bearish Overhang
📅 Setup Date: 17.07.2025 | ⏱ Timeframe: Daily
📍 Strategy: Post-Earnings Reaction Play with Mixed Sentiment in Options
________________________________________________________________________________
🔍 Overall View
Spot Price: ₹1957.4
Trend: Mixed – Strong Q1 results (profit ↑12%, bonus/dividend declared), but price action weak
Volatility: High IVs — Calls ~23–25%, Puts ~29–32% → post-result event premium still elevated
Ideal Strategy Mix: Neutral-to-bullish spreads with defined risk or post-IV crush contrarian longs
________________________________________________________________________________
1️⃣ Bullish Trade (Contrarian Setup with Fundamental Trigger)
Best CE: Buy 1980 CE @ ₹24.2
Why:
• Strong earnings + corporate action (bonus/dividend) → triggers potential sentiment reversal
• CE 1980 saw Short Build-Up (+144% OI), premium ↓25% → ideal for short-covering setup
• Delta ~0.41 with high IV (~24.3%) → moderate leverage & gamma in case of price breakout
• Use only if price breaks and sustains above ₹1975 with strong candle + volume
________________________________________________________________________________
2️⃣ Bearish Trade (Trend Following)
Best PE: Sell 1900 PE @ ₹16.65
Why:
• PE 1900 saw massive Long Build-Up (+70%) but IV surged → may now face decay pressure
• Selling this deep OTM PE gives ~₹57 buffer from spot (≈3% downside cushion)
• Post-results, downside may be limited → good candidate to play post-IV crush
• Spot stability around 1950–1960 invalidates aggressive downside
________________________________________________________________________________
3️⃣ Strategy Trade (Defined Risk Based on Mixed Setup)
Strategy: Bull Call Spread → Buy 1980 CE / Sell 2020 CE
→ ₹24.2 / ₹10.7
Net Debit: ₹13.50
Max Profit: ₹40 (spread width) – ₹13.5 = ₹26.5
Max Loss: ₹13.50
Risk:Reward: ≈ 1 : 1.96 ✅
Lot Size: 550
Total Risk: ₹7,425
Max Profit: ₹14,575
📊 Breakeven Point: ₹1993.5
📉 Reversal Exit Level: Exit if Spot < ₹1940 (invalidates breakout + earnings move fade)
________________________________________________________________________________
Why:
• Bullish news (Q1 beat, bonus/dividend) could trigger CE short covering if price moves above 1980
• Limited risk strategy — works well if post-result rally is moderate
• High IVs favour spread over naked options (caps loss from premium crush)
• CE OI from 1960–2060 mostly short → if momentum picks up, rally could be fast
________________________________________________________________________________
📘 My Trading Setup Rules
Avoid Gap Plays
→ Check pre-open price action to avoid trades influenced by gap-ups/gap-downs.
Breakout Entry Only
→ Enter trades only if price breaks previous day’s High (for bullish trades) or Low (for bearish trades).
Watch Volume for Confirmation
→ Monitor volume closely. No volume = No trade.
Enter on Strong Candle + Volume
→ Execute the trade only if a strong candle appears with increasing volume in the direction of the trade.
Defined Risk:Reward Only
→ Take trades only if R:R is favourable (ideally ≥ 1:2).
Premium Disclaimer
→ Option premiums shown are based on EOD prices — real-time premiums may vary during execution.
Time Frame Preference
→ Trade with your preferred time frame — this strategy works across intraday or positional setups.
________________________________________________________________________________
⚠ Disclaimer (Please Read):
• These Trades are shared for educational purposes only and is not investment advice.
• I am not a SEBI-registered advisor.
• The information provided here is based on personal market observation.
• No buy/sell recommendations are being made.
• Please do your own research or consult a registered financial advisor before making any trading decisions.
• Trading involves risk. Always use proper risk management.
I am not responsible for trading decisions based on this post.
________________________________________________________________________________
