Learn Institutional Trading Part-7🎯 What is Institutional Trading?
Institutional trading is the process by which large entities — such as investment banks, hedge funds, mutual funds, and proprietary trading firms — participate in the market using large volumes of capital. These institutions don’t follow the strategies used by most retail traders. Instead, they use techniques that are based on market structure, liquidity, and logic, not indicators or news.
When you master institutional trading, you learn how to think like the smart money. You understand why price moves, not just how. This knowledge allows you to anticipate large moves instead of reacting to them late.
🔍 Key Concepts to Master
✅ Market Structure Phases
Institutions move through four major phases:
Accumulation – Quiet buying or selling in a range
Manipulation – False moves to trap retail traders
Expansion – Sharp move in the real direction
Distribution – Profit-taking while the crowd enters late
Understanding these phases helps you spot entries early and avoid fakeouts.
✅ Liquidity & Stop Hunts
Institutions need liquidity to enter large positions. They often drive price toward zones full of stop-losses or breakout traders, then reverse the market. These areas are called liquidity pools.
Retail traders get stopped out — smart traders enter after the trap, with the institutions.
✅ Order Blocks & Imbalances
Institutions often leave footprints through large unbalanced candles or zones (called order blocks and fair value gaps). These areas act as magnets for future price moves. Mastering these zones gives you high-accuracy entries with solid risk-reward.
💼 Why It Works
Retail traders lose because they follow emotion and indicators. Institutional traders win because they:
Wait for precision setups
Manage risk with discipline
Trade based on logic, structure, and liquidity
Don’t chase trades — they let the market come to them
When you master institutional trading, you adopt this same mindset. You become patient, calculated, and consistent
Trade ideas

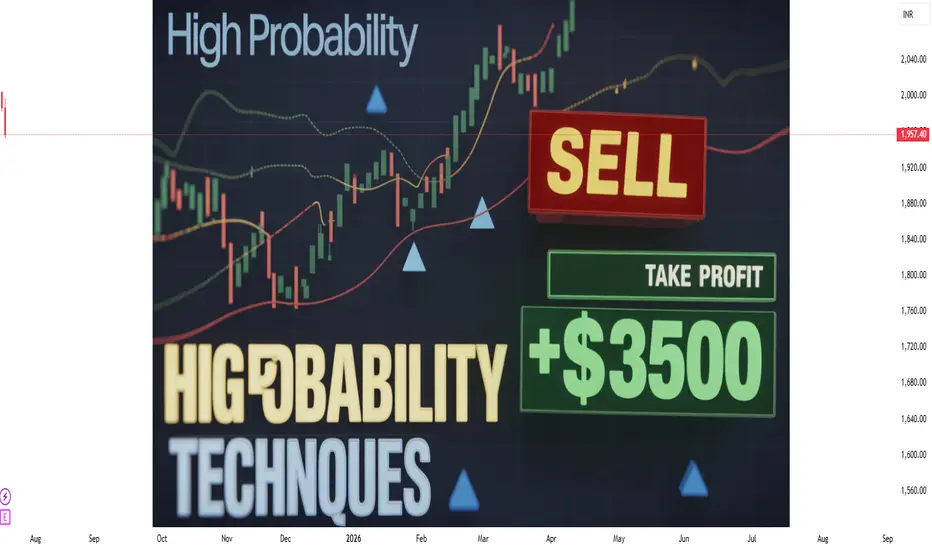
High-Probability Scalping Techniques🔍 What Is Scalping?
Scalping is a fast-paced intraday trading style where traders aim to take multiple small profits throughout the trading day. Instead of holding trades for hours or days, scalpers may be in and out of trades within minutes or even seconds.
Scalping is all about:
Quick entries and exits
High accuracy
Controlled risk
Small but frequent gains
The core idea? “Many small wins add up to a big win.”
Scalping works best in liquid markets, like Nifty, Bank Nifty, large-cap stocks, or high-volume futures and options.
💡 Why Do Traders Choose Scalping?
Scalping is perfect for traders who:
Have limited capital but want to grow it steadily
Prefer not to hold positions overnight (no gap-up/gap-down risk)
Love short-term action and decision-making
Want to trade professionally in 1-2 hours daily
Also, scalping can reduce your exposure to market news, global events, or overnight uncertainty.
But remember: scalping isn’t easy. It’s a skill. You need discipline, speed, and a proven strategy.
🎯 Key Characteristics of High-Probability Scalping
To make scalping successful, your strategy must include:
Factor Requirement
Speed Fast entries and exits with minimal slippage
Liquidity Trade only stocks/indexes with high volume
Precision Narrow stop losses, clear targets
Discipline No emotions, stick to plan
Risk Management Small risk per trade, compounding over time
🧠 Scalper's Mindset: Think Like a Sniper, Not a Machine Gunner
You’re not shooting randomly. You’re waiting patiently for high-probability opportunities where the odds are clearly in your favor.
Scalping is not about trading more—it’s about trading better.
🔧 Tools Every Scalper Needs
Before we dive into strategies, here’s what you must have in place:
Fast internet connection
Live market depth / Level 2 data
5-min, 1-min, and tick charts
Hotkeys for fast order placement
Broker with low brokerage per trade
Scalping involves dozens of trades per session, so costs matter!
🛠️ High-Probability Scalping Techniques (Explained in Human Language)
Let’s now explore some proven techniques that many experienced scalpers use.
🔹 1. VWAP Bounce Strategy
VWAP = Volume Weighted Average Price. It tells you the average price where most volume happened during the day.
📌 Concept:
In a trending market, price often bounces off VWAP before continuing the trend.
You trade that bounce.
✅ Rules:
Identify trend (price above VWAP = uptrend, below = downtrend)
Wait for a pullback to VWAP
Look for confirmation (like a bullish candle in uptrend)
Enter trade with tight SL below VWAP
Target = 0.5% to 1% move
🔍 Chart Timeframe:
1-minute or 5-minute candles
Ideal for: Nifty/Bank Nifty, Reliance, HDFC, SBIN, INFY
🔹 2. Opening Range Breakout (ORB)
This is a classic scalping setup used in the first 15–30 minutes of market open.
📌 Concept:
First 15-min range defines the initial battle between buyers/sellers.
Breakout from this range = strong momentum.
✅ Rules:
Mark high and low of 15-min candle from 9:15 to 9:30
Buy when price breaks above the high + volume rises
Sell when price breaks below the low + volume rises
SL = below/above opposite side of the range
Target = 1:1 or trail profit
💡 Tip:
Works best on trending news days or earnings release days.
🔹 3. Scalping Breakouts with Volume Confirmation
A breakout is only real if volume supports it. Otherwise, it’s a trap.
✅ Rules:
Use 5-minute chart
Identify consolidation (flat price action with narrow range)
Watch for breakout with spike in volume
Enter with SL just outside the range
Exit with a 1:1 or 1.5:1 risk-reward
🎯 Indicators:
Bollinger Bands tightening
Volume histogram
Price breaking upper/lower band
🔹 4. RSI Divergence Scalping
You can scalp reversal points using RSI divergence.
✅ Rules:
Use 5-min or 3-min chart
RSI near 70 or 30 signals overbought or oversold
If price makes higher high but RSI makes lower high → Bearish divergence
If price makes lower low but RSI makes higher low → Bullish divergence
Enter for quick reversal scalp
SL = recent swing high/low
Target = VWAP or recent pivot
🔹 5. News-Based Scalping
Scalping on earnings releases, news events, or market-moving headlines can be profitable—but risky.
✅ Approach:
Stick to high-volume large-cap stocks
Avoid holding more than a few minutes
Use Level 2 order book to watch supply/demand shifts
Trade the initial burst, exit quickly
📈 Ideal Indicators for Scalping
VWAP
RSI (5 or 14-period)
Bollinger Bands
EMA crossover (e.g., 8 EMA vs 21 EMA)
MACD (fast settings for short-term signals)
But remember: indicators are tools, not guarantees. Always combine them with price action and volume.
📉 Risk Management: The Scalper’s Shield
This part matters even more than the strategy itself.
Rule Explanation
Risk only 0.5% to 1% of capital per trade Protects you from wipeout on a bad day
Always have a stop-loss No SL = no survival
Don’t average losing trades You’re scalping, not investing
Exit on SL or target—no emotion Don’t hope, don’t pray
Track your win-rate Aim for 60%+ with 1:1 risk-reward
🧮 Sample Scalping Day Plan
Time Action
9:15–9:30 AM Watch first 15-min candle for ORB
9:30–11:00 AM Take 2-3 high-quality trades (VWAP bounce, RSI scalp)
11:00–2:00 PM Avoid choppy markets or only scalp consolidations
2:00–3:00 PM Look for afternoon breakouts
3:00–3:20 PM Avoid taking fresh trades, exit open ones
🔁 Scalping Checklist
Before you place any trade, ask yourself:
✅ Is the setup clear and backed by volume?
✅ Am I trading with the trend or against it?
✅ Is my SL defined and within risk limit?
✅ Am I emotionally calm and focused?
✅ Is this a high-probability or random trade?
📊 Example of a High-Probability Scalping Trade
Stock: Reliance
Chart: 1-min
Setup: VWAP bounce + bullish engulfing candle
Entry: ₹2,950
Stop-Loss: ₹2,944
Target: ₹2,958
Result: Profit of ₹8 per share in 3 minutes
This may look small—but scalpers do 5–10 such trades a day, scaling with quantity.
🚨 Common Mistakes to Avoid
❌ Overtrading (more is not better)
❌ No plan or random entries
❌ Chasing trades late
❌ Holding scalps like swing trades
❌ Trading during news without preparation
❌ Ignoring transaction costs
🧾 Final Words: Is Scalping Right for You?
Scalping is not for everyone. It requires:
High focus and speed
Strong discipline
Quick decision-making
Excellent risk control
But if you develop the skill, it can provide:
Daily consistency
Limited overnight risk
Quick compounding
Full control over trades
✅ Start small.
✅ Practice on paper or low quantity.
✅ Use one strategy, track results, then scale up.
Trade Like Istitution Why Learn to Trade Like Institution?
Financial markets are not random. They are highly manipulated and structured systems, controlled by major financial entities. When you trade like institution, you stop guessing and start understanding:
Where the big players place their orders.
How liquidity zones work.
Why certain price levels are targeted before major moves.
How you can identify smart money footprints and follow the dominant trend.
This approach teaches you to trade strategically, patiently, and professionally — eliminating the emotional rollercoaster most traders experience.
What You Will Learn in “Trade Like Institution”
✅ Smart Money Trading Concepts
Understand how institutions manipulate markets, create liquidity, and trap retail traders. Learn the basics of accumulation, manipulation, and distribution phases.
✅ Market Structure and Order Flow
Read the market from an institutional perspective using pure price action and market structure analysis. Identify break of structure (BOS) and change of character (CHoCH) signals that reveal when the market is about to move.
✅ Order Block Identification
Learn to locate order blocks, where institutions place their large orders. These zones are often the key areas where price reverses or explodes in a specific direction.
✅ Liquidity Zones and Stop-Loss Hunting
Discover how to identify liquidity pools, understand stop-loss hunting techniques, and position yourself for trades after liquidity grabs.
✅ Risk Management Like Institutions
Master the art of risk management, learning how big players manage risk efficiently to stay profitable long-term, even after losses.
✅ High-Probability Trade Setups
Get access to reliable entry techniques with precise stop-loss placement and optimal reward-to-risk setups that minimize risk and maximize returns.
✅ Live Market Application
Learn through real-world market examples, live sessions, and chart analysis to see how institutional concepts apply in active markets like forex, stocks, indices, and crypto.
Who Should Learn to Trade Like Institution?
This course is designed for:
📊 New traders who want to start the right way without falling into retail traps.
💡 Intermediate traders who have experience but struggle with consistency.
💼 Full-time or part-time traders who wish to level up their skills.
📈 Investors who want to actively manage and grow their wealth.
🎯 Ambitious traders who want to make trading a serious and professional income source.
Benefits of Trading Like Institution
✅ Stop being a victim of market manipulation and start trading with the market movers.
✅ Eliminate confusion, follow clean price action, and trade with confidence.
✅ Avoid low-probability trades by understanding where the real market action happens.
✅ Build strong discipline and follow a professional trading process.
✅ Achieve long-term profitability by managing risk like professionals.
✅ Become a confident, independent trader capable of thriving in any market condition.
Trading success comes from learning the truth behind market movements and following the professional path. This course will completely transform your approach to the markets. With Trade Like Institution, you’ll stop guessing, start predicting, and trade with an edge just like the top institutional traders do every single day

HDFCBANK 1d investment levelKey Support (Buy-on-Dip) Levels
(Where buyers tend to show up)
₹1,985 – ₹1,986 (S1 – Classic Pivot)
First support zone based on classic pivot calculations
₹1,973 – ₹1,974 (S2 – Fibonacci Pivot)
Stronger cushion in case of deeper pullbacks
₹1,954 – ₹1,955 (S3 – Classic Pivot)
Final buffer zone—breaking it may signal deeper weakness
🚧 Key Resistance (Profit-Taking) Levels
(Where selling might appear)
₹2,015 – ₹2,016 (R1 – Classic/Fibonacci Pivot)
Immediate resistance and possible profit-booking zone
₹2,033 – ₹2,034 (R2 – Classic/Fibonacci Pivot)
Next hurdle; be prepared to take partial profits
₹2,045 (R3 – Classic Pivot)
A stronger resistance zone; breaking it could signal fresh upside
🎯 Action Tips
Buying: Enter around ₹1,985, and add at ₹1,973 if dip deepens. Use ₹1,954 as a stop-loss trigger.
Selling (Profit Booking): Trim part of your position near ₹2,015, and more near ₹2,033–₹2,045 if momentum slows.
Breakout Strategy: A clean daily close above ₹2,045 with volume may trigger fresh upside moves.
Risk Control: If price dives below ₹1,954, re-evaluate—broader market risk may be rising.
🧠 Why These Levels Matter
Pivot levels are watched closely by traders and algorithms, making them natural turning points in daily price action
HDFC Bank’s technical signals are currently neutral to slightly bearish, making dip-buying near supports more advantageous than chasing highs .
✅ Final Word (Plain Language)
Look to buy dips in the ₹1,985–1,974 range with a tight stop below ₹1,954.
Take profits around ₹2,015 and ₹2,033–₹2,045 based on your risk appetite.
Watch closely above ₹2,045—that’s your breakout level for potential new highs
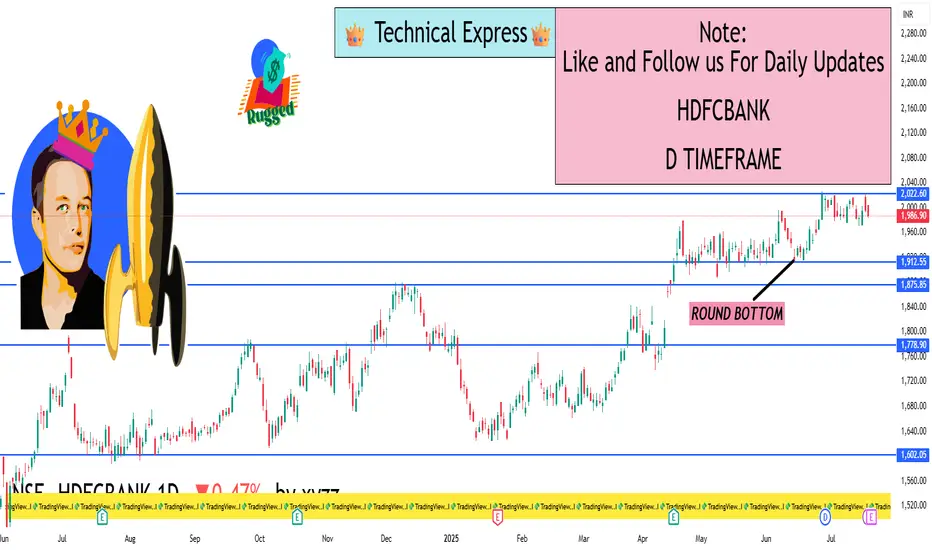
HDFCBANK 1D Timeframe✅ Holding HDFC Bank Already?
Stay invested. The stock is in a strong daily uptrend
Expect potential partial profit-taking near ₹2,021–₹2,025 or ₹2,039–₹2,040.
🟢 Planning to Buy?
First entry zone: ₹1,977–₹1,980 — safe to buy on minor dips.
Deeper buy range: ₹1,960–₹1,963 — ideal for long-term accumulation.
Place a stop-loss just below ₹1,947, especially on deeper entries.
🔵 Breakout Play?
A clean daily close above ₹2,039–₹2,040 with strong volume could launch a fresh rally.
You can add more positions after confirmation
Day-to-Day Tips
Use dips to enter near support levels with disciplined stop-losses.
Scale out or lighten positions near resistance levels.
Add more only after a confirmed breakout with strong volume.
LEARN INSTITUTIONAL TRADING🔍 What Is Institutional Trading?
Institutional trading is how large financial organizations operate in the markets. They don’t buy based on tips or random indicators — they use price action, volume data, liquidity zones, and market structure to accumulate and distribute positions quietly, often without the retail crowd noticing.
Learning institutional trading means learning:
How markets truly move
How smart money traps retail traders
How to follow big money footprints
🧠 Key Concepts You’ll Learn
1. Market Structure Mastery
Understand how institutions analyze market structure:
Break of Structure (BoS)
Change of Character (ChoCH)
Trends, ranges, and consolidation zones
2. Liquidity and Order Blocks
Learn how to identify:
Institutional order blocks (entry zones of banks)
Liquidity grabs (stop loss hunting zones)
Fair value gaps and imbalance areas
3. Smart Money Concepts (SMC)
SMC is the foundation of institutional trading. You’ll learn:
Wyckoff accumulation & distribution
Internal vs. external market structure
Entries based on premium-discount theory
4. Volume and Manipulation
Learn how volume, price action, and timeframes work together to show:
Hidden buying/selling
Trap zones
Institutional accumulation patterns
5. Entry & Exit Planning
How institutions plan:
Low-risk, high-reward entries
Multi-timeframe confirmation
Managing trades with scaling in/out
📊 Why Institutional Trading Is Powerful
Institutions:
Have deep capital
Move the market
Use strategies based on logic and patience
When you learn how to think like an institution, you stop chasing signals and start trading with confidence and structure.
👨🏫 Who Should Learn Institutional Trading?
Beginners looking for the right trading foundation
Intermediate traders tired of inconsistent results
Advanced traders seeking deeper strategy and psychology
Intraday, swing, and positional traders
✅ What You'll Gain:
A complete mindset shift in how you view the markets
Strategies with clear entry, stop loss, and target rules
Tools to trade any market: stocks, forex, indices, crypto
Confidence to follow smart money — not get trapped by it
🚀 Start Your Journey Now
Stop trading like the 90%. Learn how the 10% think, plan, and profit.
"Learn Institutional Trading" is your opportunity to elevate your market skills and build long-term trading success with a professional edge.

Commodity Supercycle 2025: Metals & Energy⚒️ Metals: The Foundation of Industrial Growth
Why are metal prices booming?
Let’s break it down in human terms:
Massive Infrastructure Projects
India, US, China, and Europe are all spending billions on roads, bridges, railways, smart cities, and housing.
All of that needs steel, cement, aluminum, copper, etc.
Clean Energy = More Copper & Aluminum
Solar panels, EVs, and wind turbines need a lot more copper, lithium, and rare metals than conventional energy.
This creates a demand explosion for base metals.
Supply Chain Bottlenecks
Mines across the world (especially in Africa, Chile, and Australia) are facing labour shortages, political instability, or environmental restrictions.
Less mining = less supply = prices go up.
China’s Comeback
China is the largest consumer of metals globally.
After a slow period in 2022–23, it’s back with a stimulus to revive housing and infrastructure — adding massive demand pressure.
🔋 Energy: Fuel for the Supercycle
What’s happening in oil, gas, and coal?
Crude Oil Above $90/Barrel
Conflicts (Russia-Ukraine, Middle East) + OPEC production cuts = tight supply
Despite the push for renewables, the world still runs on oil for transport and manufacturing
Natural Gas Shortages in Europe/Asia
War-related disruptions in Russian supply have caused natural gas prices to skyrocket
LNG imports from the US and Qatar are booming — good for companies in that ecosystem
Coal Prices Rising Again
Despite climate goals, India, China, and others are still using coal for base power
Coal India and related PSUs have seen strong earnings due to volume demand + price support
🧾 How This Affects the Indian Market
India is both a major consumer and a growing exporter of various commodities.
Winners in the Supercycle:
1. Metal Stocks (Steel, Aluminum, Copper)
Company Why It’s Benefiting
Tata Steel Global presence + rising prices = higher margins
JSW Steel Export growth + capex-driven demand
Hindalco Aluminum giant + Novelis (US-based unit)
Hindustan Copper India’s only copper miner; global demand rising
2. Energy Stocks (Oil, Gas, Coal)
Company Why It’s Benefiting
ONGC Rising crude prices = stronger profitability
Oil India Smaller PSU with strong rally potential
Coal India Massive volumes, dividend, pricing power
Reliance Petrochemicals + oil refining benefits
3. Ancillary & Export-Based Stocks
Company Role in Supercycle
NMDC Supplies iron ore – key to steelmakers
MOIL Manganese supplier for steel industry
APL Apollo Tubes Beneficiary of infra + steel boom
Welspun Corp Pipes for oil & gas pipelines
📊 Real Performance: Numbers Don’t Lie
Let’s take a quick look at recent returns (approx. from Jan 2023 to July 2025):
Stock Price in Jan 2023 Price in July 2025 Approx % Gain
Tata Steel ₹110 ₹170+ 55%+
JSW Steel ₹690 ₹930+ 35%+
Hindalco ₹430 ₹675+ 55%+
Coal India ₹220 ₹450+ 100%+
ONGC ₹150 ₹270+ 80%+
These are fundamentally driven rallies — not pump-and-dump moves. That’s the beauty of supercycles.
📈 Technical Outlook in July 2025
Nifty Metal Index:
📌 Near all-time highs (~9,000+ zone)
📈 Trend: Strong bullish
🔁 Expect periodic corrections of 5–7%, but uptrend likely to continue
Nifty Energy Index:
📌 In a broad uptrend, thanks to Coal India, ONGC, Reliance
📈 Breakouts seen in power generation and refining stocks
🎯 Next resistance at 30,000+, support at 28,500
🧠 What Traders & Investors Should Do
🧭 For Traders:
Focus on volume breakouts in metal & energy stocks
Watch for sectoral momentum using indices like Nifty Metal, Nifty Energy
Use Futures & Options (F&O) strategies like:
Call buying on breakout confirmation
Bull call spreads in ONGC, Hindalco, Tata Steel
Short straddles for sideways phases in Coal India
📆 For Swing Traders:
Identify weekly breakout patterns (flags, cup & handle, triangle)
Use trailing SL and partial booking (these stocks move fast)
Best timeframe: 2–4 week swings, especially in trending names
💼 For Long-Term Investors:
Allocate 10–15% of your portfolio to core metal/energy stocks
Focus on low-debt, dividend-paying companies (e.g., Coal India, ONGC)
SIP or staggered entries work well in a volatile commodity cycle
Expect volatility — supercycles are not linear
❗ Risks & Cautions
Every rally has its risks. Here’s what to keep in mind:
Risk Impact
Global Recession Could reduce commodity demand globally
China Slowdown Big impact on copper/steel demand
Currency Volatility Affects import/export profitability
Policy Changes Carbon tax, ESG push may hurt coal/oil stocks
Overheating Stocks may correct 15–20% if valuations get stretched
Always use risk management — especially in leveraged trades.
🗺️ Global Supercycle Factors to Watch in 2025–26
🛢️ Crude oil production quotas (OPEC+ decisions)
🏗️ China’s stimulus on construction and EVs
🌱 ESG push: Will governments ban/restrict dirty fuels faster?
💹 US Fed rate cuts/inflation outlook (affects commodity pricing)
🧾 Mining policies in resource-rich countries (Africa, Latin America)
These global forces shape how long the current commodity upcycle will last.
✍️ Final Thoughts
The commodity supercycle in 2025 is real and being driven by multi-year global trends in infrastructure, energy transformation, and supply limitations. This is not just a short-term rally — it’s part of a structural shift.
If you’re a trader — this sector is offering sharp, trend-friendly price action.
If you’re an investor — this is your chance to ride secular growth in India’s industrial backbone.
💡 “When the world builds, commodities boom. And when that boom is real, wealth is created.”

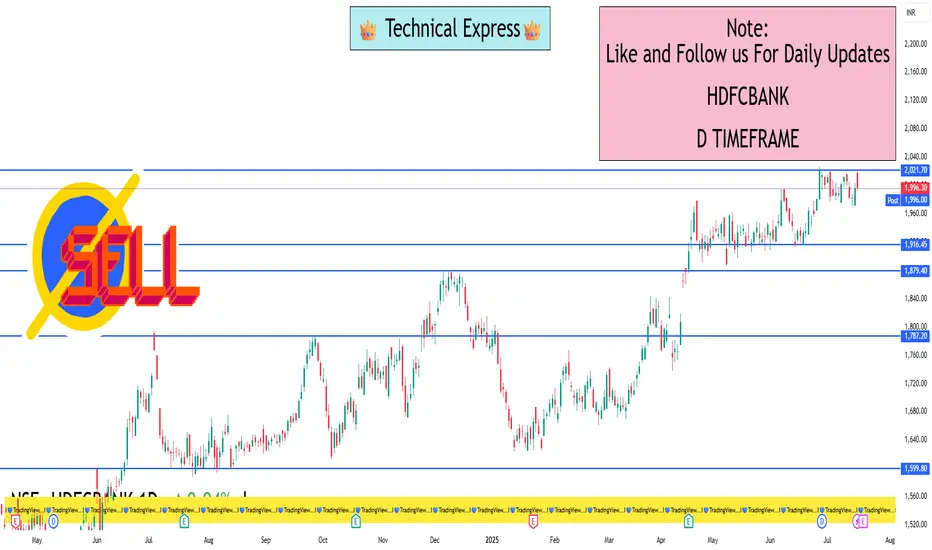
HDFCBANK 1D Timeframe📊 Current Snapshot
Price: Around ₹1,995 (~₹1,990–₹2,000 range)
52-week range: ₹1,588 – ₹2,027 — just below the recent high
✅ Technical Momentum
Overview: Daily technical summary is a "Strong Buy", with moving averages and indicators like RSI (55.3), Stoch, ADX, and CCI all in buy territory
Pivot Level Support: Standard pivots are around ₹1,995
RS Rating (ADR): Strong (83) — above the 80 mark, but extended — suggesting good trend; watch pullbacks
🛡️ Key Price Zones
Support / Buy-on-Dip Areas
₹1,995–₹1,998 – Daily pivot zone
₹1,982–₹1,990 – Standard S1 support
₹1,960–₹1,970 – Deeper Fibonacci/S2 pivot zone
₹1,932–₹1,940 – Strong long-term support (S3–S4 levels)
Resistance / Profit Exit Zones
₹2,007–₹2,015 – Immediate upside pivot resistance (R1–R2)
₹2,024–₹2,025 – R2 zone
₹2,030+ – R3/R4 zone — breakout territory
🧭 Action Plan
1. Currently Holding?
Stay invested — indicators are still bullish.
Think about taking partial profits in the ₹2,015–₹2,025 range, especially if the market overall gets choppy.
2. Planning to Buy?
Best entry: around ₹1,982–₹1,990 (safe zone).
If broader markets dip more, ideal accumulation range is ₹1,960–₹1,970.
Aggressive buying can start near ₹1,995 but keep stop-loss close.
3. Breakout Strategy
A clean, daily close above ₹2,025–₹2,030 on good volume opens up fresh upside toward all-time highs (~₹2,027+).
Can add more after breakout with confidence.
4. Risk Management
Entry around ₹1,982–₹1,990 → set stop-loss below ₹1,960.
If buying near ₹1,960–₹1,970 → stop-loss could be ₹1,930.
Option TradingInstitutional Trading – The Backbone of Markets
✅ Who Are Institutional Traders?
They are big market participants such as:
Pension Funds
Insurance Companies
Hedge Funds
Mutual Funds
Foreign Institutional Investors (FIIs)
✅ Why Are They Important?
Provide liquidity in markets
Trade with large volumes
Influence market trends

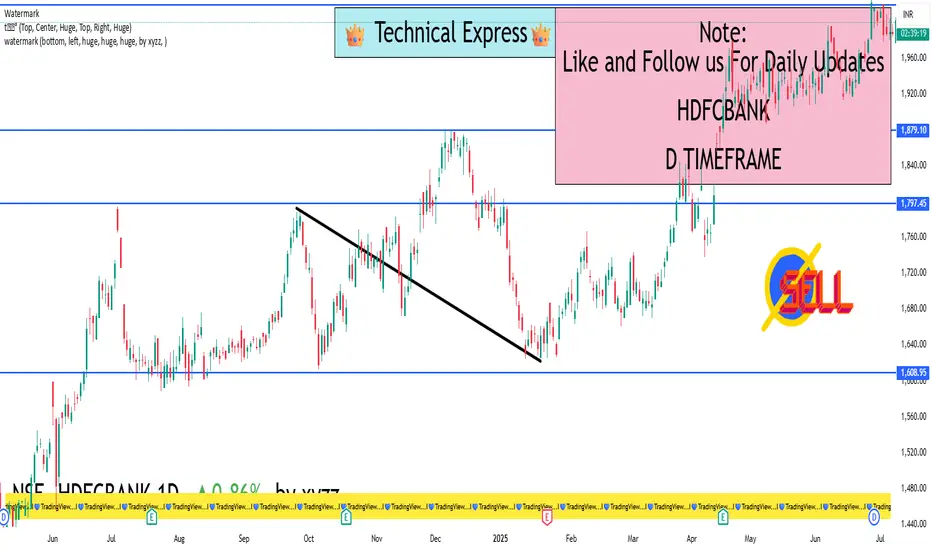
HDFCBANK – Heavy Call Writing Near 2000 Zone________________________________________
📈 HDFCBANK – Heavy Call Writing Near 2000 Zone | OI + Price Action Analysis
🕒 Chart Type: 15-Minute
📆 Date: July 7, 2025
________________________________________
🔍 What’s Catching Our Eye:
HDFCBANK closed at ₹1987.4, and the entire Call side from ₹1980 to ₹2100 is showing strong Short Build-Up, clearly suggesting resistance building up ahead, especially around ₹2000–₹2040 levels.
Meanwhile, Put side shows Long Unwinding at ₹2000 PE, suggesting lack of bullish confidence at current levels.
________________________________________
📌 What We’re Watching For:
Watch the zone between ₹2004.70 – ₹2007.90 very closely – it’s a visible Supply Zone based on price rejection + heavy CE OI.
If HDFCBANK fails to break and sustain above ₹2009.30 (SL), bears may take control again and drive it back to ₹1980 or below.
________________________________________
📊 Volume Footprint:
Heavy CE volumes hint at active resistance:
• ₹2000 CE – 9.3k+ contracts
• ₹2060 CE – 7.8k+ contracts
• ₹2020 CE & ₹2040 CE – ~5.6k contracts each
→ Strong presence of Call writers near current levels, pressuring the upside.
________________________________________
📈 Option Chain Highlights:
Calls (Short Build-Up):
• ₹2000 CE: +1,93,600 OI | Price ↓ 8.87%
• ₹2060 CE: +10,04,300 OI | Price ↓ 16.67% ✅ Major resistance buildup
• ₹2020 CE: +6,90,800 OI | Price ↓ 11.42%
• ₹2040 CE: +5,83,550 OI | Price ↓ 15.13%
• ₹1980 CE: +2,17,800 OI | Price ↓ 6.44%
• ₹2100 CE: +2,00,200 OI | Price ↓ 17.76%
Puts:
• ₹2000 PE: -84,150 OI | Price ↓ 0.87% → Long Unwinding = Bullish weakness
• ₹1980 PE: +6,050 OI | Price ↓ 2.33% → Weak Short Build-Up
📌 Inference:
Call writers are dominating the entire upper side. There’s no strong Put writing, and PE writers are exiting positions at ATM — this confirms limited bullish conviction.
________________________________________
🔁 Trend Bias:
🔴 Bearish to Range-Bound – unless ₹2009.30 gets taken out on closing basis
________________________________________
🧠 Trade Logic / Reasoning:
• Heavy Short Build-Up in all major CE strikes
• Lack of Put writing near spot
• Supply Zone aligning perfectly with Option Chain resistance
→ Expect rejection or pause unless strong buyers break ₹2009.30 with volume.
________________________________________
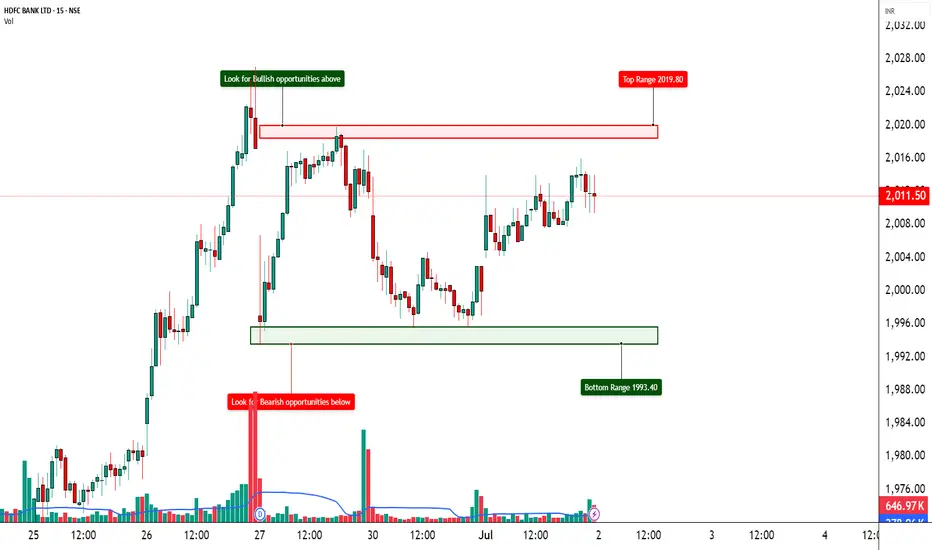
📍 Important Levels to Mark:
🔺 Top Range (Resistance): ₹2008
🔻 Bottom Range (Support): ₹1980
________________________________________
🎯 Trade Plan (Educational Purpose Only):
✅ Best Buy (Equity): Above ₹2009.30 with a bullish candle and volume
✅ Best Sell (Equity): Below ₹2004.70 for quick move to ₹1980
✅ Best CE to Long: None – CE side is under Short Build-Up
✅ Best PE to Long: ₹1980 PE if price starts rejecting ₹2000 zone again
🟢 Demand Zone: ₹1965 – ₹1980 (Intraday Bounce Possible)
🔴 Supply Zone: ₹2004.70 – ₹2007.90 (SL: ₹2009.30)
⚠️ Invalidation Levels (With Logic):
🔻 Bullish View Invalid Below: ₹1980 – breaks structure and confirms weakness
🔺 Bearish View Invalid Above: ₹2009.30 – a breakout above this level with volume + PE Short Build-Up will invalidate bearish trades
________________________________________
⚠️ Disclaimer:
This analysis is for educational purposes only.
STWP is not a SEBI-registered advisor.
No buy/sell recommendations are made.
Please consult your financial advisor before trading.
STWP is not responsible for trading decisions based on this post.
________________________________________
💬 Rejection from ₹2000 or breakout above ₹2009?
What’s your view on HDFCBANK? Comment below ⬇️
🔁 Share this if you're tracking the zone
✅ Follow STWP for clean Price Action + OI Trades
🚀 Let’s trade with clarity and confidence!
________________________________________

Option Trading ClassThe Institutional Trading Process is highly strategic and complex, combining deep research, advanced technology, and strict compliance. Institutions leverage their size and tools to execute efficiently without heavily impacting the market.
Introduction to Option Trading
What are Options?
Options are contracts giving the right, but not the obligation, to buy (Call) or sell (Put) an underlying asset at a predetermined price within a specific time.
Types of Options:
Call Option: Right to buy
Put Option: Right to sell
Key Terms:
Strike Price, Premium, Expiry Date, Lot Size, Intrinsic Value, Time Value

Institution Option TradingInstitutional options trading refers to the large-scale use of options by financial institutions such as hedge funds, mutual funds, pension funds, banks, insurance companies, and proprietary trading firms. Unlike retail traders, institutional participants possess significant capital, advanced technology, and deep market insight, enabling them to deploy complex options strategies for hedging, speculation, and arbitrage purposes.
Institutional options trading plays a crucial role in shaping market dynamics. These large entities can influence volatility, liquidity, and price movements due to the size and frequency of their trades. Understanding how institutional traders operate provides retail traders with key insights to align their strategies effectively.
The Foundation of Options Trading
1. Understanding Options
Options are derivative contracts that give the buyer the right, but not the obligation, to buy or sell an underlying asset at a predetermined price (strike price) within a specified time frame.
Types of Options:
Call Options: Provide the right to buy.
Put Options: Provide the right to sell.
2. Key Option Terminologies
Premium: Price paid to buy the option.
Strike Price: Predetermined price to buy/sell the underlying asset.
Expiration Date: Last date the option can be exercised.
In-the-Money (ITM): Option with intrinsic value.
Out-of-the-Money (OTM): Option with no intrinsic value.

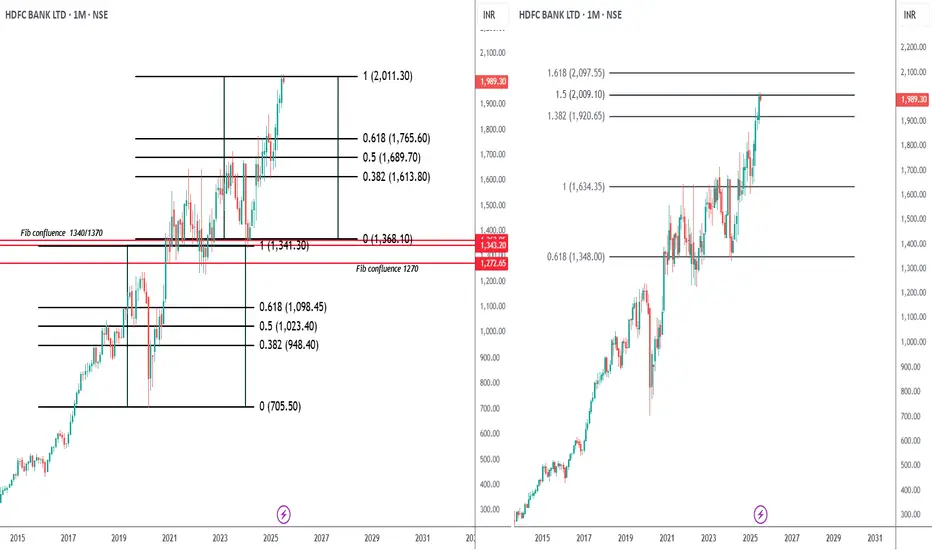
Two different methods, same resultHDFC Bank CMP 1989
Fibs - on the left the box has been made from the fib confluence which ended 2011. On the right is fib ext whose 1.5 is at 2009. Both made from diff zones but the result is the same.
Conclusion - Since composite has made a negative divergence on the monthly charts, expect a decent correction in this counter. In my view 1765 is the minimum as of now. Looking at this chart I can say with loads of confidence that BNF and Nifty are not making new highs.
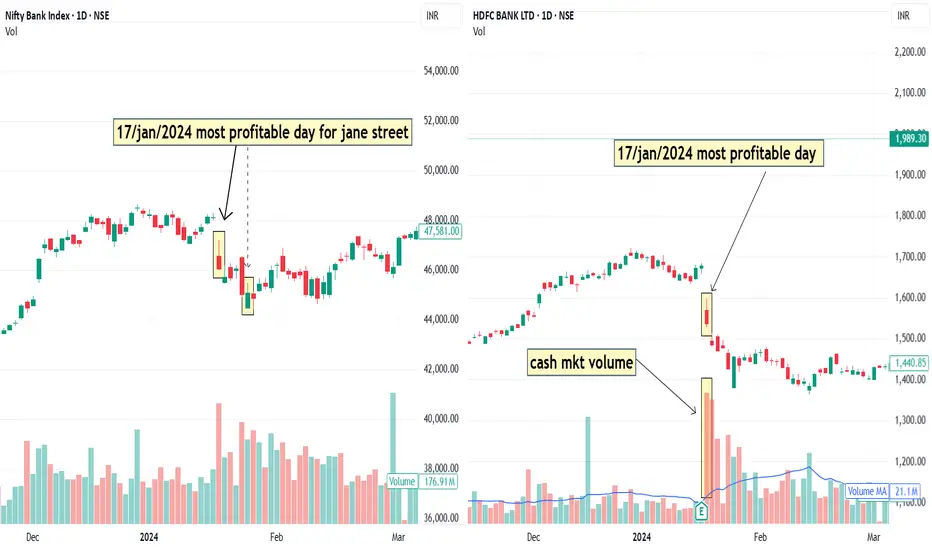
jane street manipulationjane street manipulation on 17 Jan 2024. I shows how small retail player are dominated by those who have large capital and manage index and create heafty profit so please avoid doing bank nifty or nifty call or put strategy is you do not no how to tread on in because you will blow your account and your self-confidence to in this market which is ruthless and is after jane street lots of firm is their which will continue to do this so be careful and avoid doing intraday strategy
Institutional Master class
Option Trading Explained
Options are financial derivatives that provide the right, but not the obligation, to buy or sell an underlying asset at a predetermined price within a specific period.
Types of Options:
Call Option: Right to buy the underlying asset.
Put Option: Right to sell the underlying asset.
Components of an Option Contract:
Strike Price: The agreed price to buy/sell.
Premium: Price paid to acquire the option.
Expiration Date: Date when the option contract ends.
Option Trading Strategies:
Buying Calls/Puts: Simple directional bets.
Covered Call: Holding stock while selling a call option to generate income.
Protective Put: Buying a put option to hedge a long stock position.
Spreads: Combining options to limit risk and cost.

HDFCBANK – Stepping Into Bullish Territory?📈 HDFCBANK – Stepping Into Bullish Territory?
🔍 Strong Long Build-Up | Option Chain + Price Action Alignment
Chart Type: 15-min / 1H / Daily
Indicators: STWP Zones, Demand-Supply, Volume, OI Trends
🔹 What’s Catching Our Eye?
✅ Consistent Long Build-Up seen from 2000 CE to 2100 CE
✅ Massive OI Addition on 2040 CE (+6.33 lakh contracts = +50%)
✅ 2060 CE OI jumped +8.57 lakh = +82% – Serious bullish interest building up
✅ Put Writers exiting 2000 PE = Strong base forming around ₹2000
✅ Spot Price at ₹2012, sitting above psychological level
📊 What We’re Watching for:
📍 Breakout Zone: 2020–2040
📍 Targets: 2060 → 2080 → 2100
📍 Invalidation Below: 1985
📍 Momentum Confirmation: Strong close above 2040 with volume surge
📍 Option Chain Support: Heavy unwinding on 2000 PE confirms strength
📌 Trade Plan (Educational Purpose Only):
🔹 Bullish Idea: Buy above 2025 breakout with SL below 1985
🔹 Options: Look at 2040 or 2060 CE for directional exposure
🔹 BTST/Positional: If price closes above 2040 with rising OI and IV
⚠️ Disclaimer:
This post is for educational and learning purposes only.
It does not constitute buy/sell advice or investment recommendation.
Always consult your financial advisor before taking any positions.
STWP is not liable for any financial decisions based on this content.
📚 “Price is the headline, but data is the real story.”
💬 Will HDFCBANK reclaim its momentum zone, or is this just noise before the next move?
Institutional Option Trading Part -xTrading Techniques
Block Trading: Large, privately negotiated trades.
High-Frequency Trading (HFT): Using algorithms for rapid-fire trades.
Algorithmic Trading: Automated trading based on predefined criteria.
Technology in Institutional Trading
Low Latency Networks: For speed advantage.
Advanced Algorithms: For market making, arbitrage, and execution.
Data Analytics: Real-time analysis to inform trading decisions.
Market Impact and Regulations
Institutional traders can move markets, prompting regulatory oversight.
Regulatory Bodies:
SEC (U.S.): Securities and Exchange Commission.
FINRA (U.S.): Financial Industry Regulatory Authority.
SEBI (India): Securities and Exchange Board of India.
Key Regulations:
Reporting Requirements: Large trades must be reported.
Fair Trading Practices: Prevent market manipulation.
Risk Controls: Institutions must manage trading risks appropriately.

HDFC Bank Bullish IdeaWhy HDFC bank moved?
Confluence of EMA + AVWAP. Why AVWAP Matters and why short term moving average 20 ema is crucial.
ALong with that Volumes played a good role.

Learn Institutional Trading Part-4Technical Trading
Technical trading uses charts, patterns, and indicators to make decisions.
Traders study past price movements, volume, and signals to predict future trends instead of focusing on company financials.
Stock Market
The stock market is a place where shares of companies are bought and sold.
It’s like a big online shopping mall for stocks (e.g., NSE, BSE, NYSE). Prices go up and down based on demand, news, earnings, and investor emotions.

Learn Institutional Option Trading Part-4Recent Growth of Options in India:
Retail participation has surged.
Weekly expiry options (especially on Bank Nifty) have become extremely popular.
SEBI introduced lot size and margin regulations to control excessive speculation.
Investing in India
What is Investing?
Investing means allocating money into assets like stocks, mutual funds, bonds, gold, or real estate to earn returns over time.
Major Investment Options in India:
Equities (Shares)
Mutual Funds
Fixed Deposits
Public Provident Fund (PPF)
Gold (Physical and Digital)
Real Estate
Bonds and Debentures

Institutions Option Database TradingDatabase Option Trading is a powerful blend of market logic and data science. With structured data, intelligent scanning, and strategic execution, traders gain a massive edge over emotional/manual decisions. This approach is ideal for traders aiming for consistent performance, lower drawdowns, and systematic growth. The more you code, automate, and analyze—the better you trade.
Sample Strategy - PCR + OI Spike
Strategy Logic:
If PCR > 1.3 and Call OI Spike at ATM > 15%, initiate a Put Sell.
Exit when PCR drops below 1.1 or OI unwinds.
Backtest Results (NIFTY Options):
Win Rate: 72%
Avg Profit per Trade: ₹4800
Max Drawdown: ₹9800

Option Trading How Institutions Operate:
Use Option Greeks (Delta, Gamma, Theta, Vega) for precise positioning
Follow OI (Open Interest) data for liquidity zones
Monitor FIIs/DII data from NSE reports
Combine options with futures arbitrage or cash segment hedging
🔹 Tools Used by Institutions:
Bloomberg Terminal
Custom-built Quant Models
NSE Option Chain + IV Analysis
Algo-driven trading based on volatility signals

Support and Resistance Support Level:
A price level where demand is strong enough to prevent the price from falling further. It's like a floor—buyers enter here expecting prices to rise.
Example: If Nifty falls to 22,000 repeatedly and bounces back, 22,000 becomes a support level.
🔹 Resistance Level:
A price level where selling pressure overcomes buying, preventing prices from rising. It's like a ceiling—sellers dominate at this level.
Example: If Bank Nifty rises to 50,000 but fails to move above, 50,000 is resistance.
📊 How to Identify Them:
Historical price charts
Trendlines
Moving averages
Fibonacci levels
Volume analysis
📈 Use in Trading:
Buy near support
Sell near resistance
Use breakout strategy when price breaches either level
