What's in store for the big boy HDFCBANK?CMP: 1927
TF: daily
Looks like Bearish Crab pattern is in play on Daily TF, targeting 2040
Triangle pattern is observed - The entire may series has been sideways (and formed a nice triangle pattern) after a spectacular one way upmove in the month of April. The triangle pattern also compliments the 4th wave (counts are marked from 1624 levels). Pattern target too is placed at around 2050 levels.
There is a overhead resistance (trendline at the top from 2024 July.
The multi-year range consolidation pattern target is also at 2050 levels
The Fibs tells a different story though.. Finally and more importantly, the price couldn't close above the 1.382 Fib level at 1977.70
This could very well mean that, the entire upmove from the 1624 is B wave and we would possibly head lower to make one more low below 1624 to complete the C wave.
On the weekly chart, we seem to be almost completing the 5th wave ( I could be completely wrong here, if you consider fresh wave counts from Covid lows )
As much as it looks tempting to go long, I am not sure if I will trade for 100-150 points move on the upside. Rather, I would wait for the pattern to mature and capitalize on the profit booking trade with Low risk set up.
Disclaimer: I am not a SEBI registered Analyst and this is not a trading advise. Views are personal and for educational purpose only. Please consult your Financial Advisor for any investment decisions. Please consider my views only to get a different perspective (FOR or AGAINST your views). Please don't trade FNO based on my views. If you like my analysis and learnt something from it, please give a BOOST. Feel free to express your thoughts and questions in the comments section.
Trade ideas

Advanced Put Call Ratio (PCR)Slide 1: Introduction to Advanced Put Call Ratio (PCR)
The Put Call Ratio (PCR) is a widely used sentiment indicator in options trading. It measures the volume or open interest of put options relative to call options. Advanced analysis of PCR helps traders gauge market sentiment—whether fear or greed is dominant—and anticipate potential reversals or continuations.
Slide 2: Basic Formula and Types
PCR Formula:
Volume-based PCR = Total Put Volume / Total Call Volume
Open Interest-based PCR = Total Put OI / Total Call OI
Interpretation:
PCR > 1: Bearish sentiment (more puts)
PCR < 1: Bullish sentiment (more calls)
Key Types:
Index PCR – NIFTY, BANKNIFTY PCR
Stock PCR – For individual stocks
Slide 3: Advanced Interpretation of PCR
1. Contrarian Indicator:
Very high PCR (e.g., >1.5): Indicates excess fear, potential reversal upward
Very low PCR (e.g., <0.6): Indicates extreme optimism, potential market correction
2. Trend Confirmation:
Stable rising PCR in uptrend = Confirmed strength
Falling PCR in downtrend = Confirmed weakness
3. Divergence Signal:
If prices rise but PCR also rises → underlying caution (hidden bearishness)
If prices fall but PCR drops → lack of fear (hidden bullishness)
Slide 4: Using PCR with Other Tools
Combine PCR with:
Volume & OI Data – To confirm trader positions
Implied Volatility (IV) – High PCR + high IV = fear-based overreaction
Support/Resistance Levels – Look for breakout confirmations
Technical Indicators – RSI, MACD, VWAP with PCR for enhanced edge

Learn institution Trading Part -3How Option Prices Move – The Greeks
Delta: Sensitivity to price change in the underlying
Gamma: Rate of change of Delta
Theta: Time decay – loss in value as expiry nears
Vega: Sensitivity to Implied Volatility (IV)
Rho: Interest rate sensitivity
Understanding Greeks helps manage risk, adjust positions, and time trades better.
4. Why Traders Choose Options
Leverage: Control large positions with limited capital
Risk Control: Limited loss in buying options
Flexibility: Multiple strategies (bullish, bearish, neutral)
Hedging: Protect existing stock portfolios
Income Generation: Through writing options like covered calls

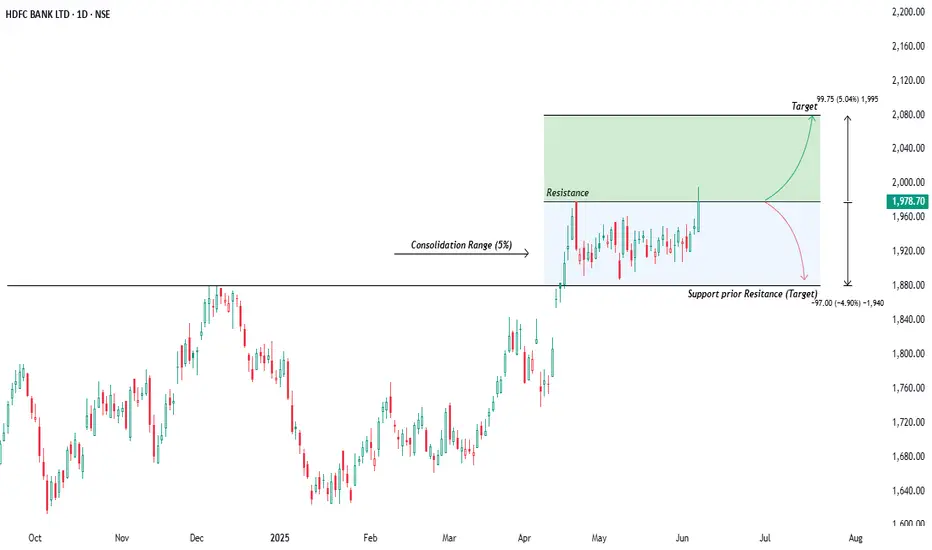
Hdfc Bank: Swing Trade IdeaHello Traders, Hope you're catching the right trends! so today we will discuss Hdfc bank on Daily chart as we can see that price formed a consolidation pattern following it's sharp uptrend in April. After a sustained rally, the share price paused and entered a sideways phase within a narrow 5% range, indicating temporary equilibrium between demand and supply. What makes this setup noteworthy is the position of the consolidation right above the prior resistance zone near 1880, which has now been tested as support. This behavior reflects classic price action dynamics, where old resistance turns into new supporta key trait of strength in trending markets.
Over the past weeks, the stock has been coiling within this tight rangeand creating a well defined rectangle pattern. The upper resistance of the range is marked around 1980. On the latest daily candle, the price has started to show intent to break out of this zone with momentum. If the breakout sustains with volume confirmation, it opens up the potential for a bullish continuation toward the projected target of 2080, a measured move equal to the height of the consolidation zone.
However it's important to remain objective if the price fails to sustain above the 1980 resistance and instead shows signs of rejection or downward traction, the breakout attempt may be considered a false move. In such a case, a reversal toward the lower end of the consolidation becomes likely. This opens up a short opportunity, targeting the support below which prior was resistance and marked on chart too. A breakdown from this range would further confirm bearish sentiment in the near term.
Risk management-: Invalidation is defined by a daily close in the opposite direction of the trade.
This publication is meant for only learnig purpose and not contains any kind of trading advice.
Good trades ahead, Amit.
Trading with Experts What is Option Trading?
Option trading is a financial strategy where traders buy and sell options contracts — financial instruments that derive value from underlying assets like stocks or indices. Each option gives the buyer the right (not obligation) to buy (Call) or sell (Put) at a specified price before expiry.
🔹 Types of Options:
Call Option – Right to Buy
Put Option – Right to Sell
Index Options – Based on Nifty, Bank Nifty, etc.
Stock Options – Based on individual stocks (e.g., Reliance, HDFCBANK)
🔹 Key Components:
Strike Price – Agreed price to buy/sell
Premium – Price paid for the option
Expiry Date – Validity of the contract
Lot Size – Fixed quantity of shares per contract
ITM, ATM, OTM – In-the-money, At-the-money, Out-of-the-money
🔹 Why Trade Options?
✅ Leverage with less capital
✅ Hedging portfolio risk
✅ Strategic plays (Bullish, Bearish, Neutral)
✅ Income generation via selling options

Option Trading Master ClassOption Trading Master Class – Overview
🔹 Module 1: Basics of Options
What are Options? (Call vs Put)
Terminologies: Strike Price, Premium, Expiry, Lot Size
European vs American Options
🔹 Module 2: Options Pricing & Greeks
Intrinsic vs Extrinsic Value
Option Greeks: Delta, Gamma, Theta, Vega, Rho
How volatility affects option price
🔹 Module 3: Strategies for Beginners
Covered Call, Protective Put
Bull Call Spread, Bear Put Spread
Pros & Risks of each strategy
🔹 Module 4: Advanced Strategies
Iron Condor, Straddle, Strangle
Butterfly Spreads, Calendar Spreads
Adjusting positions for risk
🔹 Module 5: Live Market Application
Using Option Chain Analysis
Open Interest & Volume Interpretation
Entry/Exit points with technical support
🔹 Module 6: Psychology & Risk Management
Avoiding overtrading & expiry traps
Position sizing, SL rules
Emotional discipline in volatile markets

HDFC Bank 1600 make or break.HDFC Bank trading at support level and demand zone ,previously it spent lot of time in this area before taking off from ,1600 keep checking price action here to long for the target of recent highs long term hold.
Education purpose only do your own research before taking entries.

HDFC Downside Possibilities Are Higher AS Per Scenario Here is a **detailed business model of HDFC Bank Ltd**, one of India’s leading private sector banks:
---
## 🏦 **HDFC Bank Ltd – Business Model Overview**
### 🔹 1. **Core Business Segments**
#### A. **Retail Banking**
* Provides banking services to individual customers.
* Products:
* Savings & Current Accounts
* Personal Loans, Auto Loans, Home Loans
* Credit Cards
* Fixed Deposits, Recurring Deposits
* Digital Banking (NetBanking, Mobile App)
#### B. **Wholesale/Corporate Banking**
* Services for large companies, SMEs, and institutions.
* Products:
* Working capital finance
* Trade services
* Cash management
* Treasury & Forex services
* Corporate loans
#### C. **Treasury Operations**
* Manages the bank’s own investments and liquidity.
* Involves:
* Government securities
* Bonds and money market instruments
* Forex trading and derivatives
#### D. **Other Services**
* Investment advisory
* Wealth management
* Bancassurance (Insurance distribution)
* Mutual fund distribution
* Demat & trading accounts
---
### 🔹 2. **Revenue Streams**
| **Source** | **Details** |
| ----------------------------- | --------------------------------------------------------------------------------- |
| **Net Interest Income (NII)** | Interest earned from loans minus interest paid on deposits |
| **Fee-Based Income** | Charges from credit cards, account services, mutual fund & insurance distribution |
| **Treasury Income** | Income from investments in securities and Forex transactions |
| **Other Operating Income** | Miscellaneous fees, commissions, and services |
---
### 🔹 3. **Customer Segments**
* Individuals (salary accounts, savings, loans)
* Small & Medium Enterprises (SMEs)
* Large Corporates and MNCs
* NRIs (Non-Resident Indians)
* Government institutions
---
### 🔹 4. **Digital & Technology Focus**
* Strong digital infrastructure: NetBanking, Mobile App, WhatsApp Banking
* AI-driven chatbots, UPI, Digital Loans & Onboarding
* Partnerships with fintechs and startups
* Focus on **“Phygital” model** – physical + digital reach
---
### 🔹 5. **Distribution Channels**
* Over 8,000 branches & 20,000+ ATMs (including merged HDFC Ltd branches)
* Relationship Managers (RM)
* Mobile & Internet Banking
* BC (Business Correspondents) in rural areas
* Call Centers & IVR Support
---
### 🔹 6. **Key Strengths**
* Large customer base (\~90 million+)
* High CASA (Current Account Savings Account) ratio
* Prudent risk management
* Low NPAs (Non-Performing Assets)
* Leadership in digital banking
* Strong credit rating and investor confidence
---
### 🔹 7. **Recent Growth Drivers**
* Merger with **HDFC Ltd** (completed in 2023): creates India’s largest private sector lender
* Cross-sell of home loans to banking customers
* Expansion in rural and semi-urban markets
* Increasing focus on sustainable finance and ESG
---
### 🔚 **Conclusion**
**HDFC Bank** operates a **diversified, stable, and technology-driven business model** that balances interest income from loans with fee income from a wide array of services. Its **customer-centric approach**, **digital innovation**, and **strong financial discipline** have made it a top-performing bank in India and Asia.
---
Learn Institutional options trading Part-5Future of Options Trading in India
What Lies Ahead:
More weekly expiries (e.g., MIDCPNIFTY)
Improved retail education
Stricter compliance and reporting
Rise in algo trading and automation
Integration with global exchanges (GIFT City)
With platforms like NSE IFSC, Indian traders may soon get access to international stock derivatives from Indian soil.

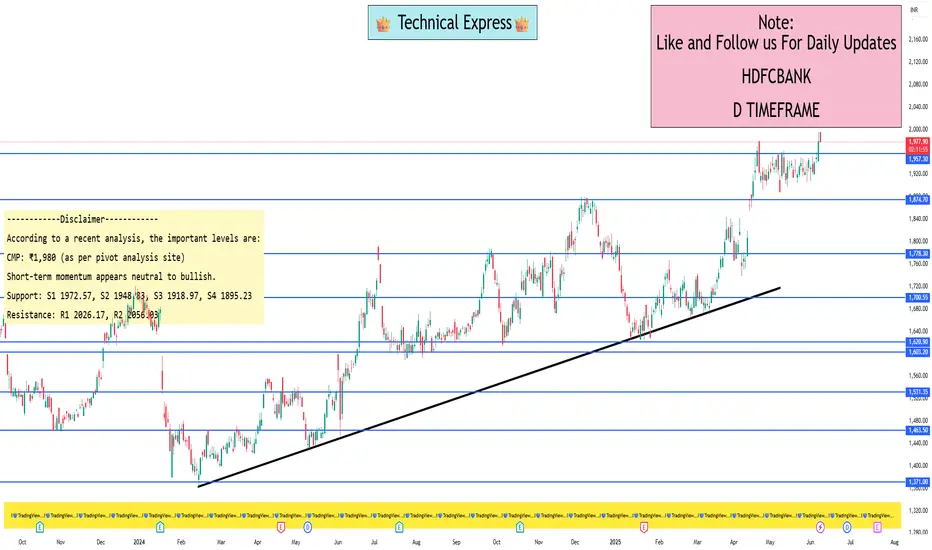
HDFC Bank levels for swing tradingAccording to a recent analysis, the important levels are:
CMP: ₹1,980 (as per pivot analysis site)
Short-term momentum appears neutral to bullish.
Daily Pivot (Classic Standard) – significant for intraday/swing entries
Pivot: 2002.43
Support: S1 1972.57, S2 1948.83, S3 1918.97, S4 1895.23
Resistance: R1 2026.17, R2 2056.03
CPR (Daily):
BC: 1969.50
P: 1972.57
TC: 1975.63
Weekly Pivot – key for multi‑day swing setups
Pivot: 1961.00
Support: S1 1925.70, S2 1872.70, S3 1837.40
Resistance: R1 2049.30, R2 2102.30
CPR (Weekly):
BC: 1952.15
P: 1961.00
TC: 1969.85
Advance Institutions Option Trading - Lecture 3Options trading might feel like gambling on a single trade, but informed decisions make it fundamentally different. Reckless trading without a plan can resemble gambling but is not the proper way to trade. With discipline and skill, options trading stands apart from luck-based activities.
Options involve risk and are not suitable for all investors. Certain requirements must be met to trade options. Before engaging in the purchase or sale of options, investors should understand the nature of and extent of their rights and obligations and be aware of the risks involved in investing with options.

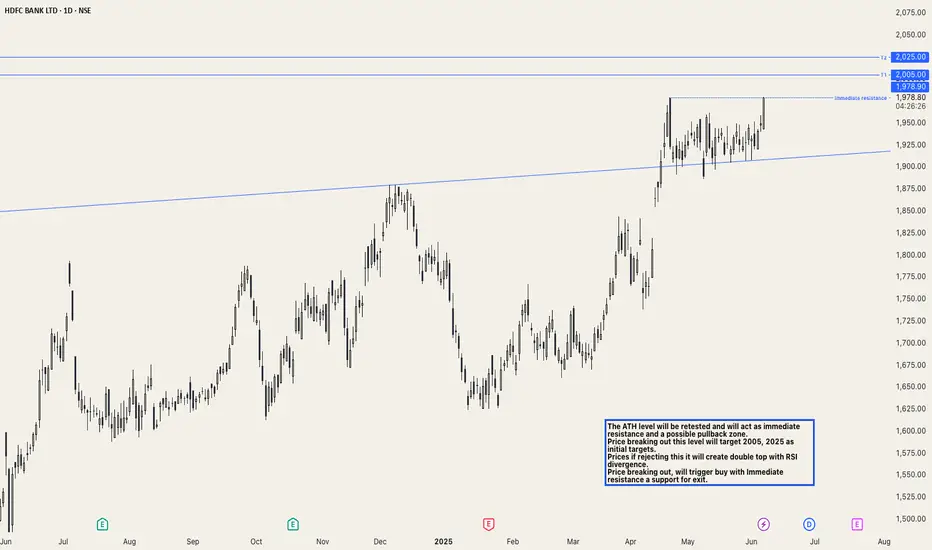
HDFCBANK: All Time High retest, for new ATH.The ATH level will be retested and will act as immediate resistance and a possible pullback zone.
Price breaking out this level will target 2005 and 2025 as initial targets.
Prices if rejecting this, it will create a double top with RSI divergence.
Price breaking out will trigger a buy, with Immediate resistance a support for exit.
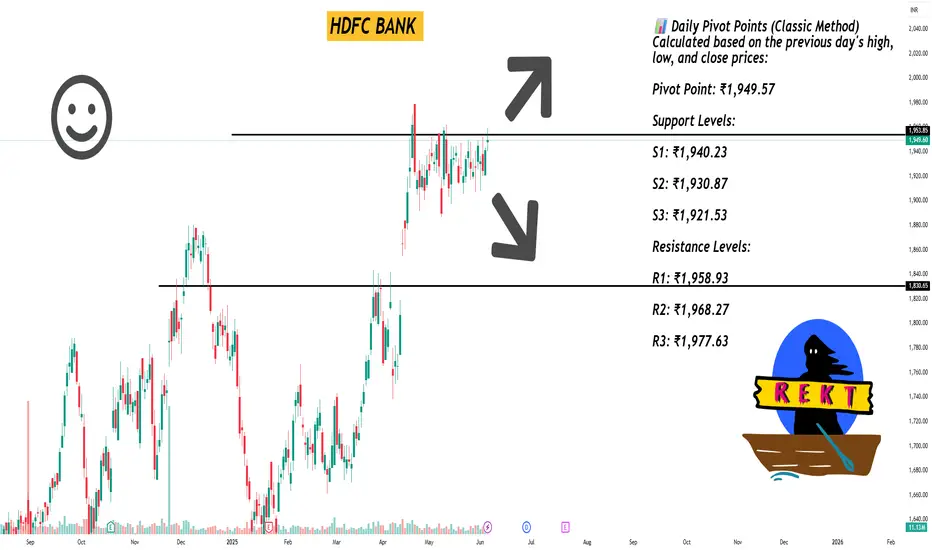
HDFC BANK As of June 6, 2025, HDFC Bank Ltd. (NSE: HDFCBANK) is trading at approximately ₹1,944.90. Here's a detailed technical analysis focusing on daily support and resistance levels:
📊 Daily Pivot Points (Classic Method)
Calculated based on the previous day's high, low, and close prices:
Pivot Point: ₹1,949.57
Support Levels:
S1: ₹1,940.23
S2: ₹1,930.87
S3: ₹1,921.53
Resistance Levels:
R1: ₹1,958.93
R2: ₹1,968.27
R3: ₹1,977.63
Source: Top Stock Research
📈 Fibonacci Support & Resistance Levels
Based on Fibonacci calculations:
Support Levels:
S1: ₹1,942.42
S2: ₹1,938.01
S3: ₹1,930.87
Resistance Levels:
R1: ₹1,956.71
R2: ₹1,961.12
R3: ₹1,968.27
🔍 Camarilla Pivot Points
These levels are derived using the Camarilla method:
Support Levels:
S1: ₹1,947.89
S2: ₹1,946.17
S3: ₹1,944.46
Resistance Levels:
R1: ₹1,951.31
R2: ₹1,953.03
R3: ₹1,954.74
📌 Trading Insights
Immediate Support: ₹1,940.23 (Classic S1)
Immediate Resistance: ₹1,958.93 (Classic R1)
Traders may consider these levels for setting stop-loss and take-profit orders. A break above ₹1,958.93 could signal bullish momentum, while a drop below ₹1,940.23 might indicate bearish pressure.
Divergence Based Trading Divergence occurs when an asset's price and a technical indicator move in opposite directions, indicating a possible change in trend momentum. Traders use bullish or bearish divergence to anticipate reversals.

HDFC BANK 1HRSWING TRADE
- EARN WITH ME DAILY 10K-20K –
HDFC BANK Looking good for upside..
When it break level 1961 and sustain.. it will go upside...
BUY@ 1961
Target
1st 2005
2nd 2044
FNO
HDFCBANK JUN FUT – LOT 5 (Qty-2750)
HDFCBANK JUN 1940 CE – LOT 5 (Qty-2750)
Enjoy trading traders.. Keep add this STOCK in your watch list..
Big Investor are welcome..

Option Chain Analysis An option chain is a comprehensive listing of all available options contracts for a specific underlying asset, like a stock, index, or commodity, organized by strike prices and expiration dates. It's essentially a table that provides detailed information about call and put options for that asset, including strike prices, expiration dates, premiums, open interest, volume, implied volatility, and last traded price.

Candlestick patterns part 1Candlestick patterns are graphical representations of price movements over a specific time period, used in financial technical analysis to identify potential trend reversals or continuations. Each candlestick shows the opening, closing, high, and low prices of a financial asset. Corporate Finance Institute explains that by observing these patterns, traders can gain insights into the market sentiment and potential future price movements.

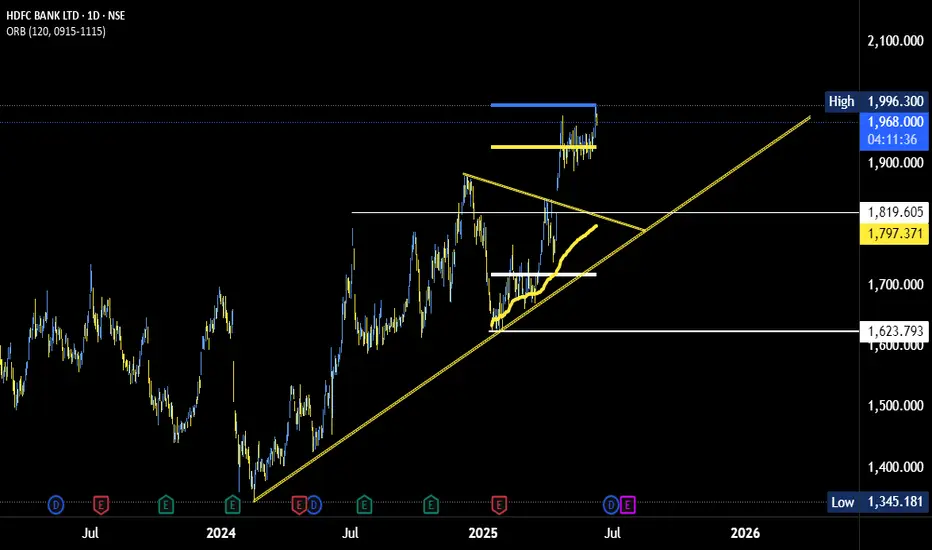
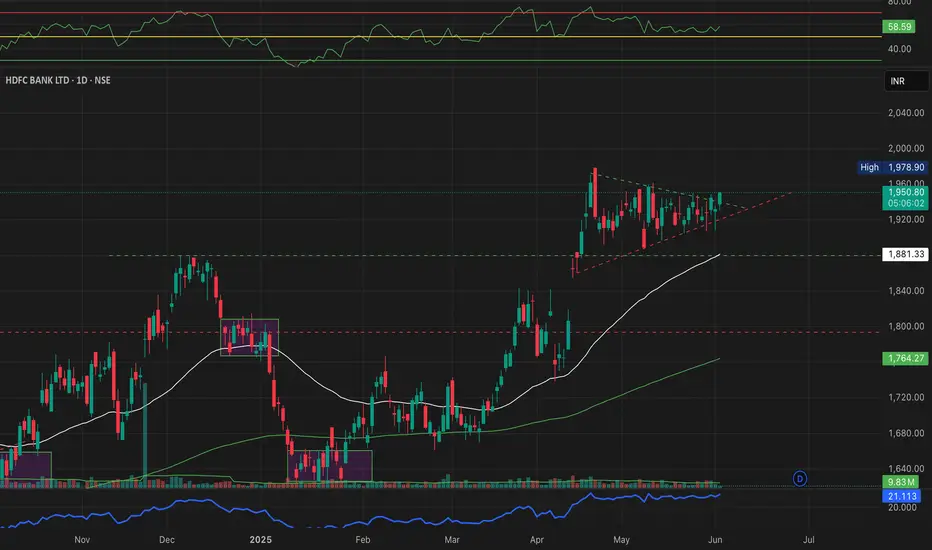
HDFC BANK , Near Symmetrical Triangle Pattern? Symmetrical Triangle Tightening With Price Hovering Near Apex. Breakout Looks Imminent.
Price is also above 50 EMA, RSI around 56 - no extreme overbought zone, giving room for movement.
THIS LEVELS ARE PURELY BASED ON MANUAL PRICE ACTION - NO AUTO INDICATORS USED.
Will the triangle break upward or fakeout below? Let's Discuss in the comments!
All Levels hand - marked by Mayur Jayant Takalikar - based on clean structure & momentum zone spotting.
#HDFCBANK #PRICEACTION #TRADINGVIEWINDIA #CHARTANALYSIS #BREAKOUTSETUP #TRIANGLEPATTERN #SUPPORTRESISTANCE
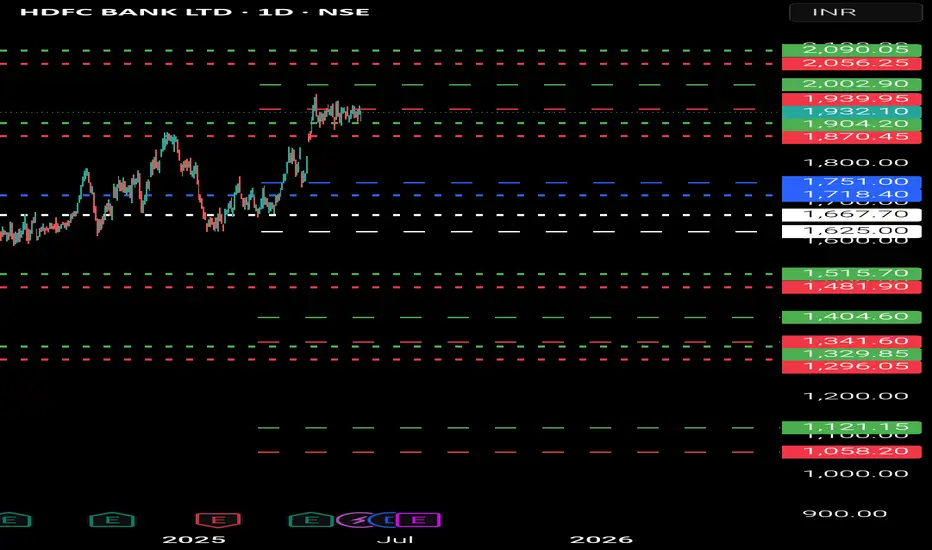
HDFCBANK (HDFC Bank Ltd)- Analysis Caution? Bullish Levels -if sustain above 2022 then 2056 to 2090 above this hold more bullish
Bearish levels :- if sustain below 1870 then 1751 to 1718 swing trade exit below this if sustains for 2-3 days then 1667 to 1625 then last hope 1515 with SL of 1481 below this more bearish then 1400 to 1296 below this more bearish.
**Consider some Points buffer in above levels
**Disclaimer -
I am not a SEBI registered analyst or advisor. I does not represent or endorse the accuracy or reliability of any information, conversation, or content. Stock trading is inherently risky and the users agree to assume complete and full responsibility for the outcomes of all trading decisions that they make, including but not limited to loss of capital. None of these communications should be construed as an offer to buy or sell securities, nor advice to do so. The users understands and acknowledges that there is a very high risk involved in trading securities. By using this information, the user agrees that use of this information is entirely at their own risk.
Thank you.
Advanced Options Trading Advanced options trading ventures beyond basic buying and selling of calls and puts. It involves useful combinations of options contracts to achieve specific trading goals.

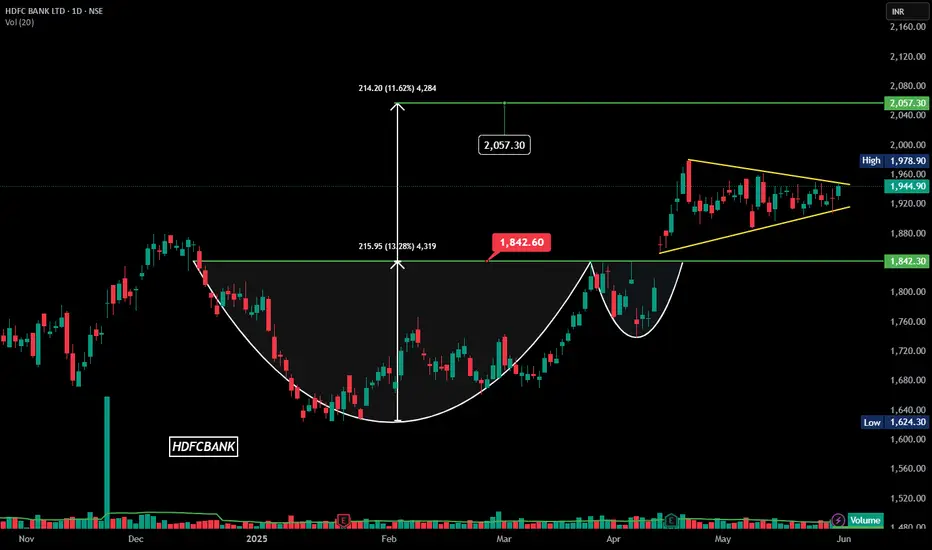
HDFCBANK | Symmetrical Triangle | Daily |Watchlist### **Technical Analysis of HDFC Bank Ltd. (NSE)**
The **daily candlestick chart** of **HDFC Bank Ltd.** highlights key technical patterns, suggesting potential bullish momentum.
### **Key Observations:**
1. **Cup and Handle Formation:**
- A well-defined **cup and handle** pattern is visible, indicating prolonged accumulation.
- Breakout above **1,960.00 INR** confirms bullish sentiment.
- **Projected Target:** **2,057.30 INR**, a **11.62% upside** from breakout.
2. **Symmetrical Triangle Breakout:**
- Price action consolidating within a **symmetrical triangle**, leading to breakout confirmation.
- Strong move above **1,944.90 INR**, validating upward momentum.
3. **Volume & Price Action:**
- **Volume:** **14.37M** surpassing 20-day moving average of **10.13M**, confirming strength.
### **Support & Resistance Levels:**
- **Support:** **1,842.00 INR**, acting as a key cushion in case of pullbacks.
- **Resistance:** **2,057.30 INR**, aligning with the measured move projection.
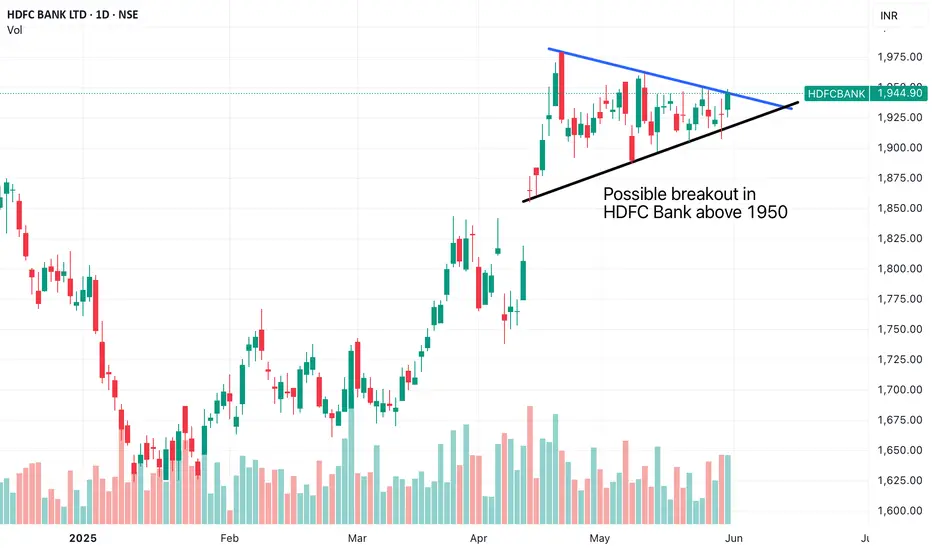
HDFC Bank Breakout above 1950Watch out HDFC Bank next week. If it closes above 1950, it will be confirmation of breakout and we will see 200-300 points rally in coming days
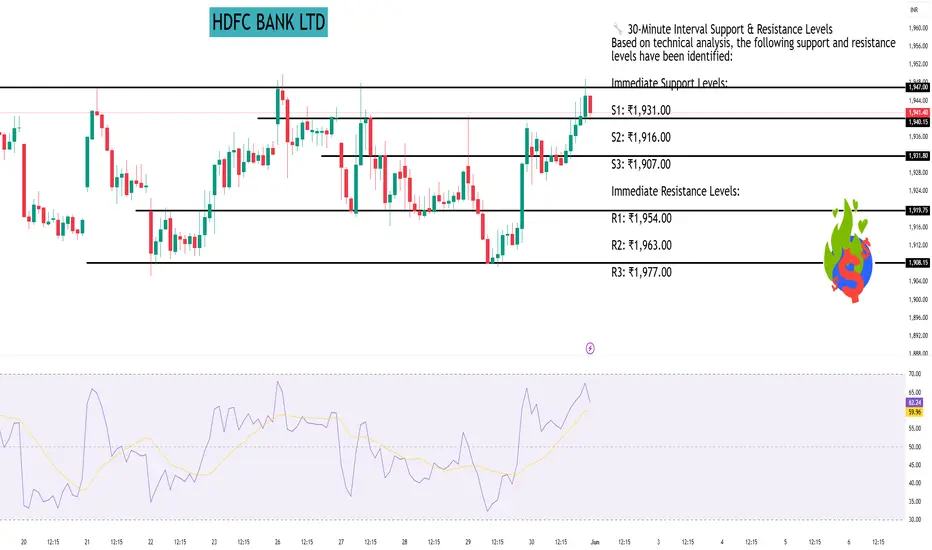
HDFC BANK LTDAs of May 30, 2025, here are the 30-minute interval support and resistance levels for HDFC Bank Ltd (NSE: HDFCBANK), based on the latest available data:
📊 Current Price Snapshot
Last Traded Price: ₹1,944.90
Day’s Range: ₹1,925.10 – ₹1,948.60
52-Week Range: ₹1,490.00 – ₹1,978.90
Market Capitalization: ₹14.77 trillion
Beta: 0.77
Volatility: 1.22%
🔧 30-Minute Interval Support & Resistance Levels
Based on technical analysis, the following support and resistance levels have been identified:
Immediate Support Levels:
S1: ₹1,931.00
S2: ₹1,916.00
S3: ₹1,907.00
Immediate Resistance Levels:
R1: ₹1,954.00
R2: ₹1,963.00
R3: ₹1,977.00
📈 Technical Indicators Summary
Relative Strength Index (RSI): 55.32 (Neutral)
MACD: 0.333 (Bullish)
ADX: 16.63 (Indicates a weak trend)
Stochastic RSI: 55.28 (Neutral)
Supertrend: ₹384.44 (Bullish)
Parabolic SAR (PSAR): ₹385.89 (Bullish)
🧭 Trading Outlook
Trend: Neutral to Slightly Bullish
Recommendation: The stock is trading near its immediate resistance level of ₹1,954.00. A breakout above this level could indicate a bullish trend, while a drop below the immediate support of ₹1,931.00 might suggest bearish momentum. Traders should monitor these levels closely for potential entry or exit points.