HDFCBANK (Bullish)A very good consolidation, any breakout towards upside can propel price upto 2000. This same trend can also be seen and captured in BankNifty.
Trade ideas

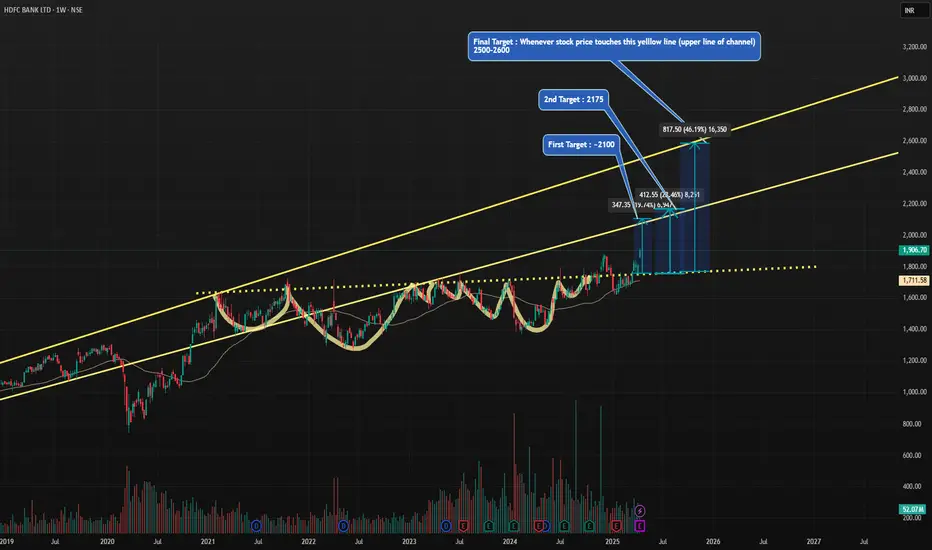
HDFC BANK : 45-50% upside possible in 1.5 Years. BODHi friends,
Targets are mentioned in the self explanatory chart .
HDFC Bank is the largest private sector bank having all time high profitability & sells .
It has well controlled gross and net NPA compared to its peers .
There is a very good probability for the stock to reward its investors with ~50% return .
Its a BOD (BUY ON DIPS) as per my analysis .
Please feel free to comment or share your views on my analysis .
Note : I am not SEBI registered advisor . Please consider my analysis for education purpose only .
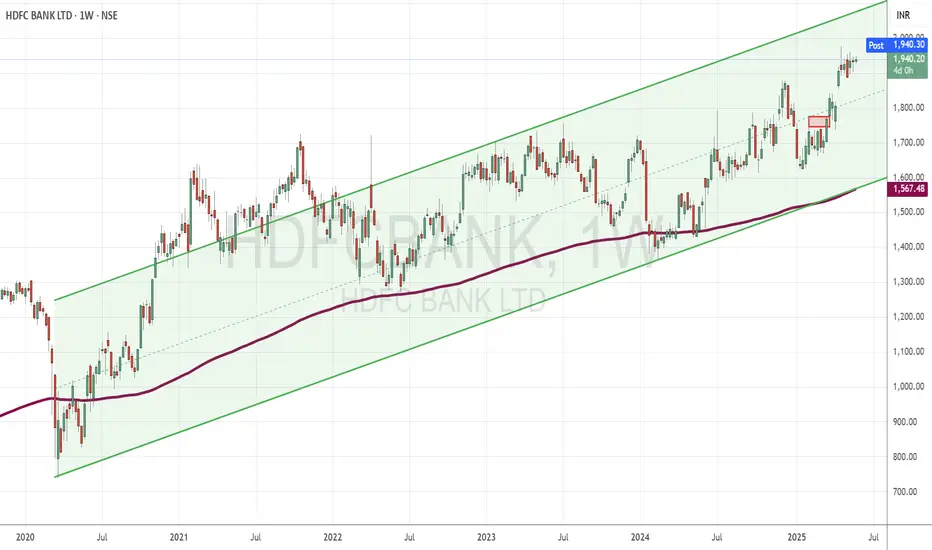
HDFC Bank Surges to Lifetime High Within a Defined Bullish ChannTopic Statement:
HDFC Bank is on a strong bull run, steadily climbing within a well-defined uptrending channel.
Key Points:
* The stock is trading within a bullish uptrending channel, offering clear opportunities for channel-based trading
* It is currently at its lifetime high, reflecting strong investor confidence and momentum
* The price has significantly overextended above the 200-day EMA, indicating the stock is highly overbought and may be due for consolidation or a pullback
Divergence SecretsDivergence moves in the opposite direction of the technical indicator.
Divergence occurs when there is a high probability of price retracement.
Divergence analysis is recommended only if you observe double top, double bottom, higher high, and lower low formation.

Support and Resistance part 2Support is a price point below the current market price that indicate buying interest. Resistance is a price point above the current market price that indicate selling interest. S&R can be used to identify targets for the trade. For a long trade, look for the immediate resistance level as the target.

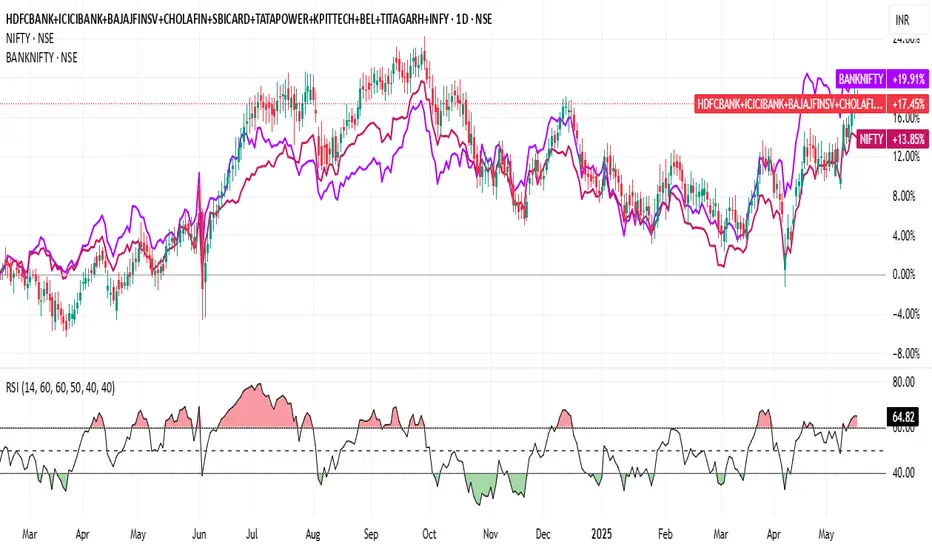
Customize you stock profile indexCustom indexing is the process of setting specific parameters on the stocks you'd like to invest money in, allowing you to personalize your investments based on your individual values, goals, preferences, risk tolerance and tax positioning.
Here I add my best Profile 10 stock :
HDFCBANK+ ICICIBANK+BAJAJFINANCE+CHOLAMANDALAM+SBICARD+TATAPOWER+KPIT+BEL+TITAGARH
As per Today stock total unit Price :-
1937.10
1447.00
2037.20
1635.00
913.90
408.60
1343.90
363.00
935.80
1557.90
Total =12579.40
Let see, can this (10 stocks) Index better perform or not!
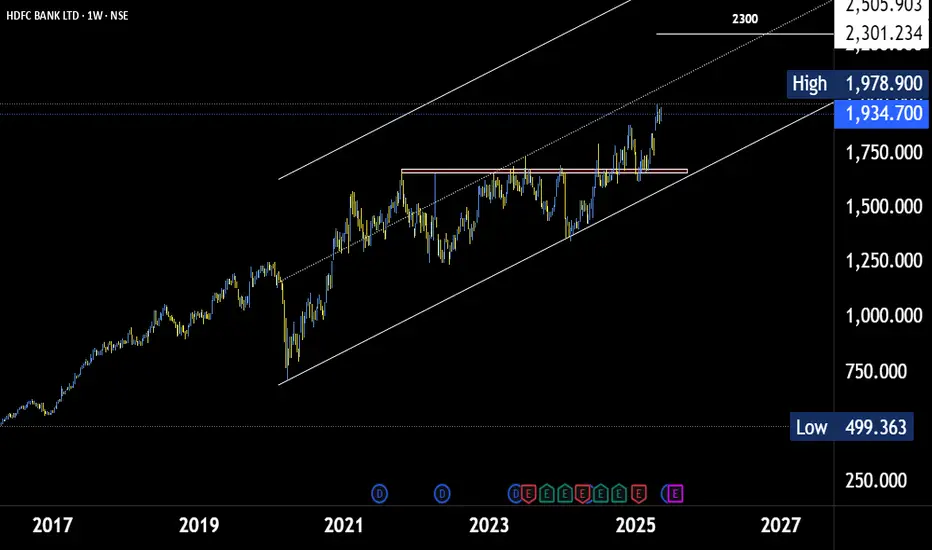
HDFC Bank Fresh Upside Findout of Rs 2500HDFC Bank Limited is India's largest private sector bank by assets and market capitalization, headquartered in Mumbai. Established in August 1994, the bank commenced operations as a Scheduled Commercial Bank in January 1995. ( , )
### Key Highlights
* **Market Position**: As of April 2024, HDFC Bank had a market capitalization of \$145 billion, making it the third-largest company on Indian stock exchanges. ( )
* **Merger with HDFC Ltd**: In July 2023, HDFC Bank completed its merger with Housing Development Finance Corporation (HDFC Ltd), India's largest housing finance company. ( )
* **Global Standing**: As of August 2023, HDFC Bank was recognized as the world's fifth-largest bank by market capitalization. ( )
* **Systemic Importance**: The Reserve Bank of India has identified HDFC Bank as a Domestic Systemically Important Bank (D-SIB), indicating its critical role in the Indian banking system. ( )
### Financial Overview (FY24)
* **Revenue**: ₹3,36,367 crore
* **Net Profit**: ₹73,440 crore( )
* **Market Capitalization**: ₹14.8 lakh crore
* **Profit Growth**: 21% CAGR over the last 5 years( )
* **Dividend Payout**: Maintained a healthy payout ratio of 23.3% ( )
### Leadership
* **Chairperson**: Atanu Chakraborty, a retired IAS officer, has been serving as the chairperson since July 2021.
* **Former CEO**: Aditya Puri led the bank from its inception until October 2020, earning accolades such as inclusion in Barron's Top 30 Global CEOs.
### Subsidiaries and Services
HDFC Bank offers a comprehensive range of financial services, including:
* **Retail and Corporate Banking**
* **Investment Banking**
* **Treasury Operations**
* **Insurance and Asset Management**
Key subsidiaries include HDFC Life, HDFC ERGO, HDFC Securities, HDFC Mutual Fund, HDB Financial Services, and HDFC Capital Advisors.
### Recent Developments
In September 2024, HDB Financial Services, a subsidiary of HDFC Bank, announced plans to raise ₹25 billion through an initial public offering (IPO). This move aligns with new RBI regulations requiring large non-banking financial companies to be listed by September 2025.
For more detailed information, you can visit the official HDFC Bank website
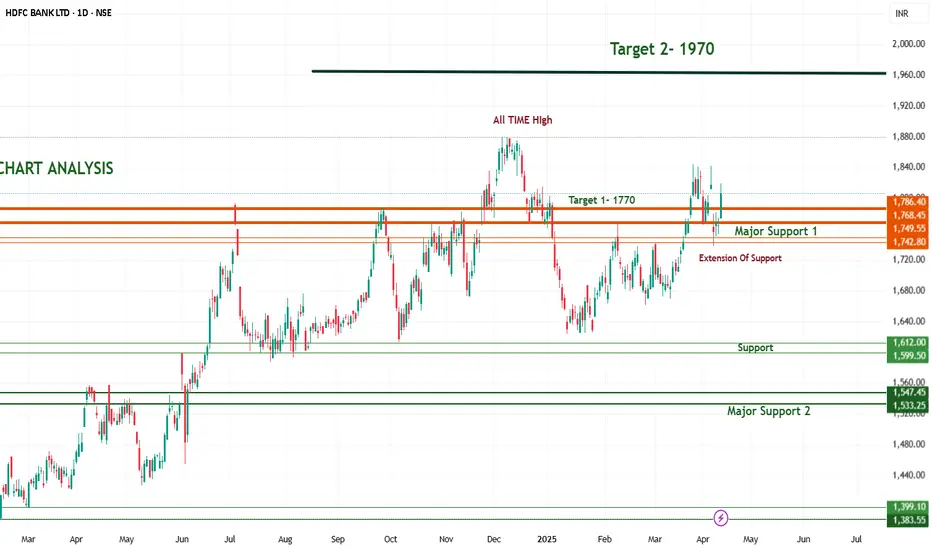
HDFC Bank confirm target 1970 in 2025 HDFC Bank confirm target 1970 in 2025
HDFC Bank's stock presents a potential upside ranging from approximately 9% to 23% over the next year. The bank's strong financial performance and positive analyst sentiments support this optimistic outlook.
Analyst Price Targets for 2025
1. Motilal Oswal: Recommends a 'Buy' rating with a target price of ₹2,050, suggesting a potential upside of approximately 21% from the current price .
2. Prabhudas Lilladher: Maintains a 'Buy' recommendation with a target of ₹2,025 .
3.Trendlyne Consensus: Reports an average target of ₹1,972.27 based on inputs from 12 analysts .
4.TradingView Forecast: Provides a median price target of ₹2,034.19, with estimates ranging between ₹1,627 and ₹2,660 .
All-Time High
The stock made an all-time high slightly above ₹1,900, which acts as a psychological and technical resistance
Overall Market Condition and HDFC bank Trend are Bullish , So It Will Easily Achive Target of 1970 .
RSI ExplainedThe Relative Strength Index (RSI) is a technical indicator that measures the speed and magnitude of recent price changes in an asset, like a stock or currency. It helps traders identify potential overbought or oversold conditions and can signal potential trend reversals. The RSI is calculated on a scale of 0 to 100 and typically uses a 14-day period.

Candle Sticks Pattern Candlestick patterns are a type of chart signal used in technical analysis to interpret price movements in financial markets, according to 5paisa. They are graphical representations of price action over a specific period, helping traders identify potential trend reversals or continuations, says 5paisa. Each candlestick shows the opening, high, low, and closing prices (OHLC) of an asset, providing insights into the day's price action.

Institutional TradingInstitutional trading involves the buying and selling of financial assets, like stocks and bonds, by large financial institutions. These institutions, such as hedge funds, mutual funds, and pension funds, manage money on behalf of others and trade in significant volumes, potentially influencing market prices. They often require specialized services and technology to execute large trades.

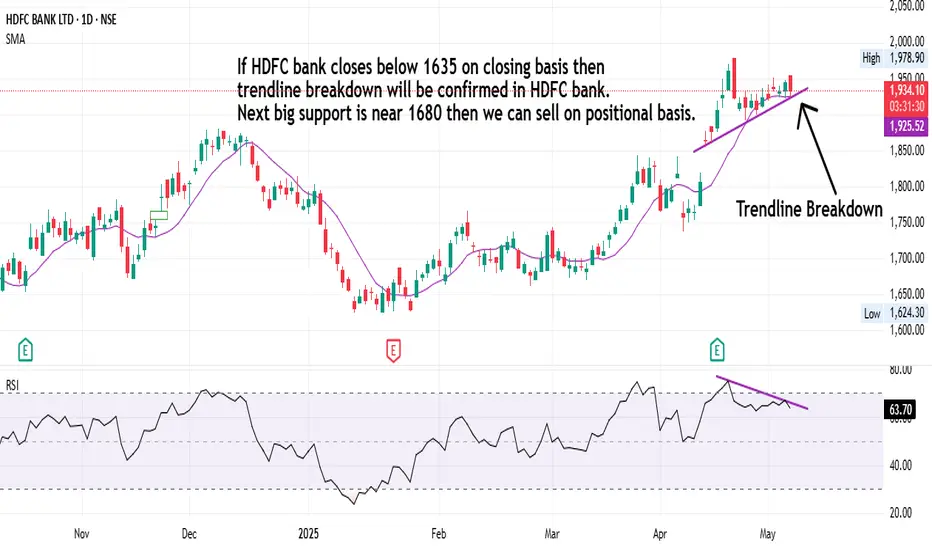
HDFC Bank Swing Trading Strategies!If HDFC bank closes below 1635 on closing basis then trendline breakdown will be confirmed in HDFC bank. Next big support is near 1680 then we can sell on positional basis.
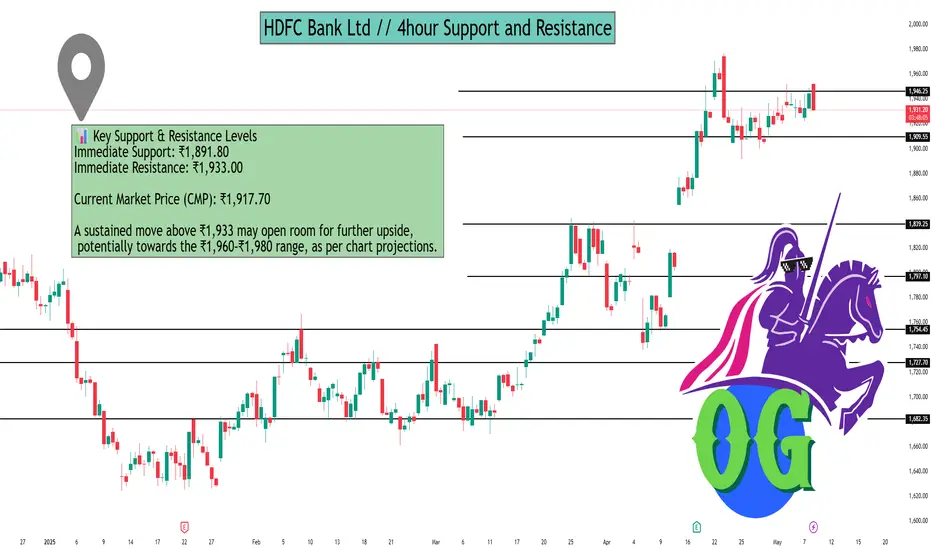
HDFC Bank Ltd // 4hour Support and ResistanceAs of May 8, 2025, here are the key 4-hour support and resistance levels for HDFC Bank Ltd (NSE: HDFCBANK), based on recent technical analyses and pivot point calculations:
📊 Key Support & Resistance Levels
Immediate Support: ₹1,891.80
Immediate Resistance: ₹1,933.00
Current Market Price (CMP): ₹1,917.70
A sustained move above ₹1,933 may open room for further upside, potentially towards the ₹1,960–₹1,980 range, as per chart projections.
🔁 Pivot Point Levels (Daily)
Pivot Type Support Levels Resistance Levels
Classic S1: ₹1,938.90S2: ₹1,929.10S3: ₹1,912.60 R1: ₹1,965.20R2: ₹1,981.70R3: ₹1,991.50
Fibonacci S1: ₹1,938.90S2: ₹1,928.85S3: ₹1,912.60 R1: ₹1,955.15R2: ₹1,965.20R3: ₹1,981.70
Camarilla S1: ₹1,943.19S2: ₹1,940.78S3: ₹1,938.37 R1: ₹1,948.01R2: ₹1,950.42R3: ₹1,952.83
Woodie S1: ₹1,940.57S2: ₹1,932.45 R1: ₹1,958.75R2: ₹1,966.87
Demark S1: ₹1,934.00 R1: ₹1,960.30
📈 Technical Indicators
Relative Strength Index (RSI): 72.46 (Strong Uptrend)
Stochastic RSI: 0.92 (Strong Uptrend)
Commodity Channel Index (CCI): 130.18 (Strong Uptrend)
Money Flow Index (MFI): 86.61 (Strong Uptrend)
These indicators suggest a strong bullish momentum, indicating potential upward movement if buying interest continues.
📌 Trading Insights
Bullish Scenario: A decisive breakout above ₹1,933 could lead to a rally towards ₹1,960–₹1,980.
Bearish Scenario: If the price falls below ₹1,891.80, it may test lower support levels around ₹1,870.69.
Neutral Zone: The area between ₹1,891.80 and ₹1,933 is critical; price action within this range may indicate consolidation before the next significant move.
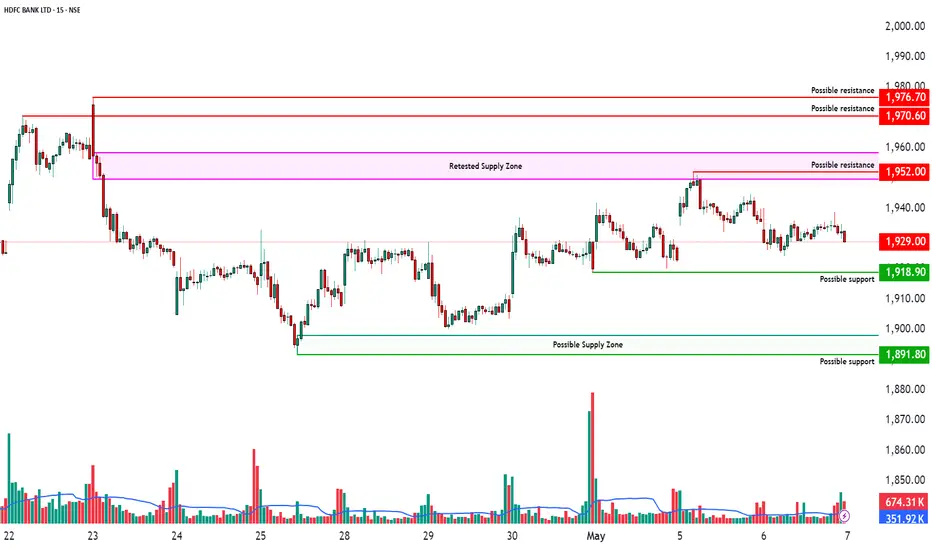
Range-Bound Between Key Supply & Demand Zones🏦 HDFC Bank Ltd – Range-Bound Between Key Supply & Demand Zones 📊
Timeframe: 15-Minute | Exchange: NSE | Date: May 6, 2025
CMP: 1,929.00
🔴 Retested Supply Zone: 1949.60 - 1958.40
This zone previously acted as resistance after a sharp fall.
Price revisited the zone but was rejected, indicating potential selling pressure.
A breakout above this level could trigger bullish continuation.
🟢 Possible Demand Zone: 1898 - 1891.80
Price rebounded from this zone earlier, showing possible accumulation by buyers.
Not confirmed yet with multiple tests, but worth watching for potential support.
Breakdown below this may open the door to further downside.
📌 Current Price Action
HDFC Bank is currently consolidating between these two zones.
No clear trend yet; price is oscillating sideways.
Volume is decreasing, indicating lack of momentum in either direction.
📈 Levels to Watch
Breakout Zone: 1,959+
Breakdown Zone: 1,890-
🔍 Observational Bias
Bearish Bias: If price revisits 1949.60 - 1958.40 zone and shows rejection, potential short setups may emerge.
Bullish Bias: If price retests 1898 - 1891.80 with bullish confirmation, long trades may be considered.
Option Trading AnalysisRelative Strength Index (RSI) The relative strength index (RSI) is one of the most commonly used indicators. ...
Bollinger Bands. ...
Intraday Momentum Index (IMI) ...
Money Flow Index (MFI) ...
Put-Call Ratio (PCR) Indicator. ...
Open Interest (OI)

HDFC Bank ltd // 3hour Support and ResistanceAs of May 5, 2025, here are the key support and resistance levels for HDFC Bank Ltd. (NSE: HDFCBANK) based on the 3-hour chart:
📊 3-Hour Pivot Points
Level Value (₹)
S3 1,689.18
S2 1,701.12
S1 1,714.03
Pivot 1,725.97
R1 1,738.88
R2 1,750.82
R3 1,763.73
These levels are calculated based on the previous day's high, low, and close prices and are used to identify potential support and resistance zones.
📈 Technical Indicators
Relative Strength Index (RSI): 72.46 (Strong Uptrend)
Stochastic RSI: 0.92 (Strong Uptrend)
Commodity Channel Index (CCI): 130.18 (Strong Uptrend)
Money Flow Index (MFI): 86.61 (Strong Uptrend)
These indicators suggest a strong bullish momentum, indicating potential upward movement if buying interest continues.
📌 Summary
Immediate Support: ₹1,689.18
Immediate Resistance: ₹1,738.88
Medium-Term Outlook: Bullish, with strong momentum indicators and positive moving averages.
Please note that technical analysis is subject to change based on market conditions. It's advisable to monitor these levels regularly and consider consulting with a financial advisor for personalized investment advice.

Support and Resistance part 2In technical analysis, support and resistance refer to price levels on a chart where the market's movement is expected to pause or reverse due to the forces of supply and demand. Support is a price level where the price has historically stopped falling, indicating that buyers are plentiful at that price point, and that the market is likely to bounce back upwards. Resistance, on the other hand, is a price level where the price has historically stopped rising, suggesting that sellers are abundant and the market is likely to fall back down.

Management and PsychologyTrading psychology refers to the emotional and mental state influencing a trader's decisions. It involves managing emotions like fear and greed, which can impact rational judgment and risk-taking, thus affecting trading outcomes. A disciplined mindset helps traders make logical decisions under pressure.

Divergence ConceptIn the stock market, divergence refers to a situation where the price of an asset (like a stock) is moving in the opposite direction of a technical indicator, such as an oscillator or momentum indicator. This discrepancy can signal a weakening trend or a potential reversal.

Technical ConceptA "technical concept" refers to a specific idea or principle within a technical field, like engineering, computer science, or a specific industry. It's a fundamental building block that helps explain how something works, what it does, and why it's used. These concepts are often complex and require a certain level of technical understanding.

Advanced Database Trading "Advanced Database Trading" typically refers to using advanced features and techniques within database management systems (DBMS) to handle complex data operations, enhance data management, and improve trading-related applications. This includes leveraging distributed databases, NoSQL systems, and techniques for real-time data processing and analysis.

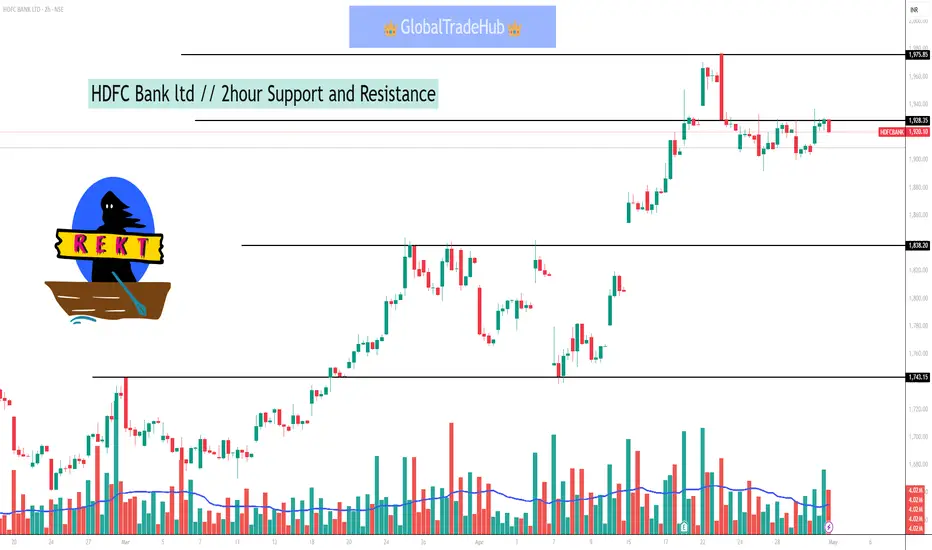
HDFC Bank ltd // 2hour Support and ResistanceAs of May 1, 2025, at 9:58 AM IST, HDFC Bank Ltd (NSE: HDFCBANK) is trading at ₹1,765. Based on recent technical analysis, here are the key support and resistance levels for the stock on a 2-hour (2H) chart:
📊 2-Hour Support and Resistance Levels
Immediate Support Levels:
₹1,746
₹1,732
Immediate Resistance Levels:
₹1,797
₹1,812
These levels suggest that if the stock price falls below the immediate support at ₹1,746, it may find the next support at ₹1,732. Conversely, if the price rises above the immediate resistance at ₹1,797, it could encounter the next resistance at ₹1,812 .
📉 Technical Indicators
ADX (Average Directional Index): 24.08, indicating a trending market.
MACD (Moving Average Convergence Divergence): Bearish crossover detected, suggesting downward momentum.
Parabolic SAR: Positioned at ₹1,714.70, indicating a bearish trend.
Super Trend: At ₹1,728.41, confirming bearish sentiment.
Bollinger Bands: Price is below the middle band (₹1,707.66), indicating potential for further downside .
Advanced Database TradingAdvanced database systems try to meet the requirements of present-day database applications by offering advanced functionality in terms of data modeling, multimedia data type support, data integration capabilities, query languages, system features, and interfaces to other worlds.
