Part 1 Ride The big Moves Introduction: The Power of Choice in the Market
Option trading is one of the most fascinating and flexible segments of the financial market. Unlike buying or selling shares directly, options give traders choices — the right, but not the obligation, to buy or sell an underlying asset at a specific price within a given time. This ability to control large positions with relatively small capital and manage risk precisely makes options attractive to both professional and retail traders.
An option is essentially a contract between two parties — a buyer and a seller — that derives its value from an underlying asset like a stock, index, commodity, or currency. Understanding how these contracts work and the logic behind their pricing helps investors make informed trading decisions.
Trade ideas

The Role of Shares in the Trading Market1. Understanding Shares
Shares are units of ownership in a company. When an investor buys a share, they essentially buy a fraction of the company’s capital. There are two main types of shares:
Equity Shares (Common Shares): These represent ownership in a company and provide voting rights in corporate decisions. Investors benefit from dividends and capital appreciation.
Preference Shares: These carry preferential rights over dividends and assets but typically do not provide voting rights. They are less risky than equity shares but offer limited upside potential.
Shares are issued by companies to raise capital for expansion, debt repayment, or other strategic initiatives. The issuing of shares is a critical function in the primary market, while their trading afterward happens in the secondary market.
2. Shares as Instruments of Capital Formation
One of the primary roles of shares in the trading market is facilitating capital formation:
Corporate Financing: Companies issue shares to raise funds without incurring debt. This enables firms to invest in new projects, research and development, infrastructure, or acquisitions.
Risk Distribution: By selling shares to multiple investors, a company distributes financial risk. Investors bear the risk of business performance, reducing the burden on the company.
Long-term Growth: Equity capital is permanent capital for a company, unlike debt, which needs repayment with interest. This allows firms to focus on long-term strategies without immediate repayment pressure.
In essence, shares are a mechanism through which companies tap into public and private funds, fueling economic growth.
3. Shares in the Secondary Market
Once shares are issued in the primary market, they are traded in the secondary market, such as stock exchanges. The secondary market serves several critical roles:
Liquidity Provision: Investors can buy and sell shares easily, providing liquidity to the market. This liquidity encourages more people to invest in shares, knowing they can exit when needed.
Price Discovery: Continuous trading of shares helps in establishing their fair market value, reflecting the company’s performance, investor sentiment, and broader economic conditions.
Market Efficiency: A vibrant secondary market ensures efficient allocation of capital. Companies that perform well see their shares rise, attracting more investment, while underperforming companies face corrective pressures.
Through secondary markets, shares act as a bridge between investors’ savings and companies’ capital requirements.
4. Role in Wealth Creation and Investment
Shares are a critical avenue for wealth creation:
Dividends: Companies distribute a portion of their profits to shareholders in the form of dividends, providing a steady income stream.
Capital Gains: Investors can sell shares at a higher price than their purchase price, generating capital gains. This is a major motivation for retail and institutional investors alike.
Portfolio Diversification: Shares allow investors to diversify across sectors, industries, and geographies, reducing overall investment risk.
By participating in share markets, individuals and institutions contribute to economic stability while growing personal and institutional wealth.
5. Role of Shares in Economic Growth
Shares are not only investment instruments; they are also vital for macroeconomic growth:
Encouraging Entrepreneurship: Access to share markets enables entrepreneurs to fund innovative projects and startups without depending solely on bank loans.
Mobilization of Savings: Shares provide a channel for channeling household savings into productive corporate investment.
Employment Generation: Companies that raise capital through shares expand operations, creating jobs across industries.
Economic Signaling: Share prices often reflect economic trends. Rising markets indicate investor confidence, while declining markets signal caution, guiding policymakers and investors alike.
In effect, shares act as a financial engine driving corporate activity, investment, and economic development.
6. Role in Corporate Governance
Shareholders, especially those holding significant stakes, play an active role in corporate governance:
Voting Rights: Equity shareholders influence major corporate decisions, including mergers, acquisitions, and board appointments.
Accountability: Management is accountable to shareholders, ensuring that the company operates transparently and efficiently.
Influencing Strategy: Institutional investors and shareholder committees can guide companies toward sustainable practices, ethical operations, and long-term profitability.
Through this governance mechanism, shares ensure that corporations remain aligned with investor interests and ethical business practices.
7. Shares and Market Sentiment
Shares also serve as indicators of market sentiment and economic expectations:
Investor Confidence: Rising share prices often reflect optimism about a company’s future, while falling prices may indicate concerns or economic downturns.
Speculation and Trends: Short-term trading in shares can amplify market trends, influencing broader economic conditions.
Global Integration: Stock markets are interconnected globally. Changes in one market can affect investor sentiment worldwide, showing how shares act as barometers of global economic health.
Investor behavior in share markets, therefore, has both micro and macroeconomic implications.
8. Technological Influence on Share Trading
The role of shares has evolved with technological advancements:
Online Trading Platforms: Digital trading has increased accessibility, allowing retail investors to participate actively.
Algorithmic Trading: Advanced algorithms enable faster execution and greater market efficiency.
Information Transparency: Real-time access to financial data, corporate announcements, and market analysis empowers investors to make informed decisions.
Technology has transformed shares from simple ownership instruments to dynamic tools for global trading and wealth management.
9. Regulatory and Risk Considerations
Shares operate within a regulated framework to ensure fairness, transparency, and investor protection:
Securities Exchanges Regulation: Stock exchanges and securities regulators monitor trading activities to prevent fraud, insider trading, and market manipulation.
Disclosure Requirements: Companies issuing shares must disclose financial statements, operational results, and strategic plans to inform investors.
Risk Awareness: Shares carry market risk, liquidity risk, and company-specific risk. Investors must balance potential rewards with these risks.
Regulation ensures that shares serve their economic function without jeopardizing investor trust.
10. Conclusion
Shares are more than just financial instruments; they are cornerstones of modern trading markets and economies. Their roles encompass:
Capital formation for companies, enabling growth and innovation.
Liquidity and price discovery in secondary markets, facilitating efficient trading.
Wealth creation for investors through dividends and capital gains.
Economic growth and employment generation, by channeling savings into productive investment.
Corporate governance, ensuring accountability and strategic alignment.
Market sentiment indicators, reflecting investor confidence and economic expectations.
Technological integration, making share trading more efficient, transparent, and accessible.
Without shares, modern financial markets would struggle to mobilize capital effectively. They link savers and enterprises, balance risk and reward, and act as a vital instrument for economic development. As global markets expand and technology advances, shares will continue to play an indispensable role in shaping investment landscapes, economic policy, and individual wealth.
STWP Analysis | ICICI Bank Showing Classic Breakout Behavior________________________________________
💼 ICICI BANK (NSE: ICICIBANK) | CMP ₹1436.60 (+1.36%)
Sector: Banking & Financial Services | Date: 19 Oct 2025
________________________________________
📊 Chart Summary
ICICI Bank closed strong at ₹1436.60, gaining +1.36% from its previous close of ₹1417.30.
Price made a high of ₹1439.60 — exactly around the Fibonacci resistance zone of ₹1439.85.
Volumes surged to 1.76x the average, with 1.70 crore shares traded against an average of 1.35 crore — indicating strong participation and renewed interest.
________________________________________
🟡 Technical Indicators Summary (Yellow Label Insight)
The chart highlights Bullish Momentum supported by a Strong Bullish Candle, indicating renewed buying interest.
A clear RSI breakout (68.36) confirms strengthening momentum, while the Bollinger Band breakout signals expanding volatility — often a precursor to a sharp directional move.
MACD at 8.33, CCI at 203.06, and Stochastic at 96.91 collectively point to short-term strength, while VWAP at 1427.77 serves as immediate support.
This confluence of volume + structure + volatility aligns perfectly for a potential breakout continuation.
________________________________________
📈 Price Action & Key Levels
The stock has been moving within a base range of ₹1342.6 – ₹1500, and has now approached the upper resistance band.
Immediate Resistance: 1447 / 1458 / 1476
Immediate Support: 1418 / 1400 / 1390
VWAP: 1427.77
A sustained close above 1439.60–1440 can confirm a bullish breakout, with upside potential toward 1466.30 → 1500 zone.
________________________________________
🧭 STWP Trade Analysis
Bias: Bullish
Breakout Level: Above 1439.60
Intraday Support: 1428
Swing Support: 1384
Intermediate Support: 1342
Momentum: Moderate
Trend: Bullish
Risk: Low
Volume: High
📌 Observation: The candle structure suggests a “volume-backed breakout” that may see short-term profit-booking near 1447 but remains structurally bullish if above VWAP.
________________________________________
🧾 Quick View: Q2 FY26 Results Snapshot
ICICI Bank reported a 5% YoY rise in PAT to ₹12,359 crore, supported by a 7.4% rise in Net Interest Income (₹21,529 crore) and improved asset quality.
Lower provisions and healthy loan growth kept the bottom line stable, while core operating profit rose 6.5% YoY.
With a clean balance sheet and improving credit metrics, the results complement the ongoing bullish technical setup — reinforcing confidence in trend continuation.
________________________________________
🧩 Final Outlook
ICICI Bank exhibits bullish momentum with low-risk positioning.
The current move represents a technical + fundamental confluence breakout, supported by strong volumes and improving financial health.
Traders may watch for price action near 1439–1447 zone for confirmation and potential swing continuation toward ₹1500 in the coming sessions.
________________________________________
🧠 Learning Note (Educational Purpose)
This setup perfectly demonstrates how volume expansion + momentum oscillator alignment + earnings strength often precedes meaningful breakouts in large-cap banking stocks.
Always track VWAP & RSI stability post-breakout — they often determine whether the move sustains or fades.
________________________________________
⚠️ Disclosure & Disclaimer (SEBI-Compliant)
This content is created solely for educational and informational purposes to help readers understand technical analysis and market structure.
It does not constitute investment advice, research recommendation, or a solicitation to buy or sell any security.
The author is not a SEBI-registered investment adviser or research analyst.
All charts, patterns, and levels are based on personal study and historical data available from public sources such as TradingView and NSE India.
Position Status: No active position in ICICIBANK at the time of publication.
Trading and investing involve risk. Market movements can be unpredictable, and losses may exceed invested capital.
Readers are strongly advised to consult a SEBI-registered investment adviser before making any trading or investment decisions.
By engaging with this post, you acknowledge that you take full responsibility for your own trades, decisions, and outcomes.
________________________________________
💬 Found this useful?
🔼 Boost this post to support structured learning content.
✍️ Share your thoughts, questions, or observations — let’s grow together!
🔁 Share with learners and traders to promote responsible market education.
👉 “If you liked this breakdown, follow for more disciplined, educational trade setups.”
🚀 Stay Calm. Stay Clean. Trade With Patience.
Trade Smart | Learn Zones | Be Self-Reliant 📊

Part 1 Support and Resistance Option Buyers vs. Sellers
Buyers have limited risk (only the premium paid) but unlimited profit potential.
Sellers (writers) have limited profit (the premium received) but potentially unlimited loss, especially in uncovered positions.
Leverage and Capital Efficiency
Options allow traders to control large positions with a small investment. This leverage magnifies both profits and losses, making options powerful but risky tools for speculation or hedging.

Part 10 Trade Like Institution Understanding the Concept of Options
Option trading involves financial contracts that give buyers the right, but not the obligation, to buy or sell an underlying asset—like a stock, index, or commodity—at a predetermined price within a specific period. The two main types are Call Options (buy rights) and Put Options (sell rights). Unlike owning shares directly, options let traders speculate on price movements with limited capital. The right to buy or sell comes at a cost known as the premium. Options are widely used for hedging, speculation, and income generation. Their value is influenced by factors such as volatility, time decay, and market sentiment. Understanding these dynamics helps traders manage risk and seize market opportunities efficiently.

Trade Rate Sensitive Assets: An In-depth Analysis1. Understanding Trade Rate Sensitive Assets
Trade rate sensitive assets refer to financial instruments or investments whose values fluctuate in response to changes in interest rates, trade volumes, or trade-related policies. The term combines two dimensions:
Interest Rate Sensitivity: Many financial assets, particularly fixed-income securities like bonds and debentures, exhibit price fluctuations when market interest rates change.
Trade Sensitivity: Assets involved in international trade, export-import businesses, or commodities often respond to shifts in trade policies, tariffs, currency fluctuations, and global demand-supply dynamics.
In essence, trade rate sensitive assets are influenced by both monetary factors (interest rates) and macroeconomic factors (trade activities).
2. Key Types of Trade Rate Sensitive Assets
A. Fixed-Income Securities
Bonds, debentures, and other debt instruments are classic examples of trade rate sensitive assets. Their prices are inversely related to interest rate movements. When interest rates rise, existing bonds with lower coupon rates lose market value, and vice versa.
Government Bonds: These are highly sensitive to interest rate changes due to their low risk and fixed coupon payments.
Corporate Bonds: The sensitivity varies depending on the credit rating and maturity period of the bond.
Treasury Bills (T-Bills): Short-term instruments whose yields are directly impacted by central bank rate changes.
Example: Suppose an investor holds a 10-year government bond paying 5% interest. If market rates rise to 6%, the bond’s market price falls because new bonds offer higher returns.
B. Equities of Interest Rate-Sensitive Sectors
Certain industries and companies are more affected by interest rate changes due to their capital structure, borrowing requirements, or trade exposure.
Financial Institutions: Banks and insurance companies are sensitive to interest rate fluctuations because they affect loan demand, net interest margins, and investment income.
Real Estate Companies: High debt dependency makes them vulnerable to rising interest rates.
Export-Oriented Industries: Companies engaged in international trade are sensitive to trade policies, tariffs, and currency exchange rates.
Example: A company exporting electronic goods to the US may experience profit fluctuations if rising interest rates in the US strengthen the dollar against the local currency.
C. Foreign Exchange and Trade-Linked Assets
Assets denominated in foreign currencies, or those linked to international trade, react to both interest rate changes and trade dynamics.
Forex Holdings: Exchange rates are influenced by differential interest rates between countries.
Trade Receivables in Foreign Currency: Companies may face gains or losses due to fluctuating currency rates and interest rate adjustments by central banks.
Commodity Exports: Prices of oil, metals, and agricultural products are sensitive to global demand and trade policies.
D. Derivatives and Structured Products
Derivative instruments such as interest rate swaps, futures, and options are inherently sensitive to interest rate changes. These tools are often used to hedge against or speculate on rate fluctuations.
Interest Rate Swaps: Allow companies to exchange fixed-rate debt for floating-rate debt to mitigate interest rate risk.
Options on Bonds: Their value changes as underlying bond prices fluctuate due to rate movements.
Currency Futures: Used by traders to hedge against foreign exchange and trade-related risks.
3. Factors Influencing Trade Rate Sensitive Assets
Several interrelated factors determine the performance of trade rate sensitive assets:
A. Central Bank Policies
Interest rate adjustments by central banks are among the most direct influencers of trade rate sensitive assets. For instance, rate hikes increase borrowing costs, reducing corporate profits and lowering bond prices. Conversely, rate cuts tend to boost asset values.
B. Inflation Expectations
High inflation often prompts central banks to raise interest rates, affecting both fixed-income and equity markets. Assets with longer maturities or high debt exposure are particularly vulnerable.
C. Global Trade Conditions
Trade-sensitive assets are influenced by international demand, tariffs, and supply chain disruptions. Changes in trade policies, such as import/export restrictions, can dramatically affect commodity-linked equities and currencies.
D. Currency Exchange Rates
Assets involved in cross-border trade are sensitive to exchange rate movements. Interest rate differentials between countries can strengthen or weaken currencies, impacting the value of trade-linked assets.
E. Economic Growth
Economic expansion or contraction influences interest rate decisions, trade volumes, and asset demand. For example, during a recession, central banks may lower interest rates, which typically supports bond prices but may depress export revenues due to reduced global demand.
4. Risks Associated with Trade Rate Sensitive Assets
Investing in trade rate sensitive assets carries multiple risks that investors must carefully consider:
A. Interest Rate Risk
This is the most direct risk, especially for fixed-income securities. Rising interest rates reduce the market value of existing bonds and increase borrowing costs for companies.
B. Currency Risk
Assets tied to foreign trade or denominated in foreign currency are exposed to currency fluctuations. Exchange rate volatility can amplify gains or losses.
C. Market Risk
Equities and commodities linked to trade are vulnerable to broader market swings and geopolitical events. Trade wars, sanctions, or supply chain disruptions can lead to sudden asset price changes.
D. Liquidity Risk
Some trade rate sensitive assets, particularly certain corporate bonds or niche commodities, may have limited market liquidity, making them difficult to sell without incurring losses.
E. Credit Risk
For corporate bonds or trade receivables, the possibility of default adds another layer of risk. Rising interest rates can strain financially leveraged companies, increasing default probability.
5. Measuring Sensitivity: Duration and Convexity
To quantify interest rate sensitivity, financial analysts often use metrics such as duration and convexity:
Duration: Measures the weighted average time it takes to receive bond cash flows. Higher duration implies higher sensitivity to interest rate changes.
Convexity: Accounts for the non-linear relationship between bond prices and interest rate changes. It refines duration estimates and helps in better risk management.
For equities and commodities, beta coefficients and sensitivity to macroeconomic indicators can measure their exposure to rate and trade-related fluctuations.
6. Strategies for Managing Trade Rate Sensitivity
Investors employ multiple strategies to manage risks associated with trade rate sensitive assets:
A. Diversification
Spreading investments across multiple asset classes, industries, and geographies can reduce the impact of interest rate or trade shocks.
B. Hedging
Using derivatives like interest rate swaps, options, and futures can hedge against adverse movements in interest rates or currency fluctuations.
C. Laddering Bonds
Investing in bonds with staggered maturities reduces exposure to interest rate risk and ensures liquidity over time.
D. Focus on Low-Volatility Sectors
Investors may prefer sectors less sensitive to interest rate changes, such as consumer staples or utilities, for stability during volatile periods.
E. Active Monitoring of Trade Policies
For trade-sensitive assets, monitoring international trade agreements, tariffs, and global supply-demand trends is crucial for timely adjustments.
7. Case Studies and Real-World Examples
A. US Federal Reserve Rate Hikes
When the Fed increases interest rates, US Treasury yields rise, causing the prices of existing bonds to drop. This also impacts equities in interest-sensitive sectors like real estate and utilities.
B. India’s Export-Oriented IT Companies
Indian IT exporters earn revenue in foreign currency. Appreciation of the Indian Rupee due to global rate hikes can reduce dollar-denominated profits, affecting stock prices.
C. Commodity Trade Disruptions
Oil prices, a trade-sensitive commodity, reacted sharply during global trade disputes and geopolitical tensions, highlighting how trade policies and international interest rates influence asset values.
8. Implications for Investors and Policymakers
Understanding trade rate sensitive assets is crucial for:
Investors: To optimize portfolio returns and manage interest rate and trade-related risks.
Corporations: To strategize financing, hedging, and trade operations efficiently.
Policymakers: To predict market reactions to interest rate changes, trade policies, and macroeconomic interventions.
Investors need to balance risk and return while factoring in global economic conditions, interest rate forecasts, and trade trends.
9. Conclusion
Trade rate sensitive assets are integral components of modern financial markets. Their values are intricately linked to interest rates, global trade dynamics, currency fluctuations, and economic policies. While they offer significant opportunities for returns, they also come with substantial risks that require careful assessment and strategic management.
By understanding the types of trade rate sensitive assets, the factors influencing their performance, and effective risk management techniques, investors can make informed decisions in both domestic and international markets. Whether through diversification, hedging, or active monitoring of trade policies, navigating the complexities of trade rate sensitive assets demands vigilance, analytical skill, and a proactive investment approach.
In an era of globalization, rapidly changing interest rates, and trade volatility, mastering the dynamics of trade rate sensitive assets is not just advantageous—it is essential for sustainable financial growth and risk management.
Part 1 Ride The Big Moves Understanding the Concept of Options
Option trading involves financial contracts that give buyers the right, but not the obligation, to buy or sell an underlying asset—like a stock, index, or commodity—at a predetermined price within a specific period. The two main types are Call Options (buy rights) and Put Options (sell rights). Unlike owning shares directly, options let traders speculate on price movements with limited capital. The right to buy or sell comes at a cost known as the premium. Options are widely used for hedging, speculation, and income generation. Their value is influenced by factors such as volatility, time decay, and market sentiment. Understanding these dynamics helps traders manage risk and seize market opportunities efficiently.

India’s Derivative Secrets: Unveiling the Dynamics of Derivative1. Introduction to Derivatives in India
A derivative is a financial instrument whose value is derived from an underlying asset, index, or rate. In India, derivatives are primarily traded on the National Stock Exchange (NSE) and Bombay Stock Exchange (BSE), with the NSE being the largest platform. The most common derivative instruments include:
Futures – Contracts to buy or sell an asset at a predetermined price on a future date.
Options – Contracts granting the right, but not the obligation, to buy or sell an asset at a specific price within a set time frame.
Currency Derivatives – Futures and options based on currency pairs like USD/INR.
Interest Rate Derivatives – Contracts based on interest rate movements, primarily used by institutional investors.
India’s derivatives market is not only a platform for speculation but also a sophisticated tool for hedging risk. The ability to lock in prices, hedge exposures, and leverage positions gives both institutional and retail investors a strategic advantage in volatile markets.
2. The Evolution of Derivatives in India
India’s derivatives market officially began in 2000, with the introduction of index futures on the NSE. Over the years, several key milestones shaped the market:
2001: Stock options were introduced, enhancing flexibility for traders.
2003: Introduction of single-stock futures, allowing hedging against individual stocks.
2008: Currency derivatives became accessible to retail investors, broadening participation.
2010 onwards: The market saw technological upgrades, automated trading systems, and higher liquidity, attracting foreign institutional investors.
This evolution has made India one of the largest derivatives markets in Asia by trading volume, second only to countries like Japan and China in certain segments.
3. Key Players in the Indian Derivatives Market
Understanding who participates in the market reveals some of its hidden dynamics:
Retail Investors – Individuals trading for speculation or hedging their portfolios. They often rely on technical analysis and market sentiment.
Institutional Traders – Banks, mutual funds, insurance companies, and hedge funds that engage in large-scale trading and hedging.
Foreign Institutional Investors (FIIs) – FIIs bring liquidity and often influence market trends through large transactions.
Market Makers – Entities that ensure liquidity by quoting buy and sell prices for derivatives.
The interaction among these participants creates opportunities for informed traders to capitalize on market inefficiencies, price misalignments, and short-term volatility.
4. Secrets Behind Successful Derivative Trading
While derivatives offer immense potential, success requires knowledge beyond basic concepts. Some hidden secrets include:
A. Leverage and Risk Management
Derivatives allow traders to control a large position with a relatively small capital outlay. However, leverage can be a double-edged sword. Indian regulators, like the Securities and Exchange Board of India (SEBI), have put safeguards in place, including margin requirements and position limits. Understanding how to balance leverage with risk is a fundamental secret of successful trading.
B. The Art of Hedging
Many retail traders view derivatives purely as speculative tools, but the real power lies in hedging. Hedging allows investors to protect against adverse movements in their underlying assets. For example:
A farmer can use commodity futures to lock in a selling price for crops.
An exporter can hedge currency risk using USD/INR futures.
Stock investors can buy put options to insure their portfolio during bearish markets.
The secret here is that derivative instruments, when used correctly, provide a risk-adjusted return advantage that simple stock trading cannot achieve.
C. Volatility Trading
India’s markets are inherently volatile due to domestic and global factors. Options trading in particular provides a way to profit from volatility without predicting the exact direction of the market. Traders use strategies like straddles, strangles, and iron condors to benefit from sudden price swings. Recognizing patterns in implied volatility versus historical volatility is a key insight many beginners overlook.
D. Time Decay Awareness
Options lose value as expiration approaches—a concept called theta decay. Seasoned traders exploit this by selling options in certain market conditions, capturing premium income while managing risk. Understanding the interplay of delta, gamma, theta, and vega can significantly improve trading performance.
E. Market Microstructure Secrets
Derivative prices are influenced not just by underlying assets but also by order flows, liquidity, and market sentiment. High-frequency traders, institutional desks, and market makers use sophisticated algorithms to anticipate price movements. Even retail traders can benefit by analyzing open interest patterns, volume spikes, and rollovers in futures contracts.
5. Regulatory Landscape
SEBI governs India’s derivatives market, ensuring transparency and protecting investors. Key regulations include:
Margin Requirements: Traders must maintain a margin to cover potential losses.
Position Limits: Restricts the maximum exposure a single trader can hold to avoid market manipulation.
Circuit Breakers: Automatic trading halts during extreme market movements.
Understanding these rules is crucial. For instance, failure to maintain margins can result in automatic liquidation, while exceeding position limits may attract penalties. Traders who study the regulatory nuances gain a competitive edge, often spotting opportunities where rules create predictable price movements.
6. Technological Edge
One of India’s derivative market secrets is the reliance on technology. From automated order routing to real-time risk monitoring, technology has transformed trading. Notable innovations include:
Algorithmic Trading (Algo-Trading): Uses pre-set rules to execute trades faster than humans.
Trading APIs and Platforms: Advanced retail traders now have access to real-time data, order book insights, and analytical tools.
Data Analytics: Big data and AI are increasingly used to predict market trends and volatility.
Retail traders who embrace technology can compete with institutional players on more equal footing than ever before.
7. Strategies Employed by Successful Traders
Several derivative trading strategies form the backbone of India’s market secrets:
A. Futures Hedging
A common practice among institutional traders is portfolio hedging using index futures. For example, if a mutual fund anticipates short-term market decline, it may short Nifty futures to offset losses.
B. Options Strategies
Advanced traders use options to construct bull spreads, bear spreads, butterflies, and condors. These strategies can limit risk while enhancing reward potential.
C. Pair Trading
Traders often engage in spread trading, taking opposite positions in correlated assets. This technique reduces market risk while exploiting relative price movements.
D. Arbitrage Opportunities
Derivative markets sometimes create mispricing between futures and underlying stocks. Traders exploit these arbitrage opportunities for low-risk profits. In India, cash-futures arbitrage is a popular strategy, where discrepancies between spot prices and futures prices are exploited.
8. Common Pitfalls and Myths
Despite the potential, many traders fall into common traps:
Over-leveraging: Taking excessive positions can wipe out capital in volatile markets.
Ignoring Market Sentiment: Technical and fundamental analysis must be combined with sentiment analysis.
Blindly Following Tips: Derivatives require personal strategy and risk management.
Neglecting Expiry Cycles: Options and futures have expiration dates that significantly impact pricing and liquidity.
Recognizing and avoiding these pitfalls separates successful traders from the rest.
9. The Role of Derivatives in the Indian Economy
Derivatives are not just for traders—they play a critical role in India’s broader economy:
Risk Management: Corporates hedge foreign exchange, interest rate, and commodity risks.
Liquidity Enhancement: Futures and options increase market liquidity, facilitating price discovery.
Foreign Investment Attraction: A sophisticated derivatives market encourages foreign participation.
Economic Stability: Hedging tools help mitigate extreme market volatility, indirectly supporting economic growth.
This makes derivatives a cornerstone of India’s financial ecosystem, often overlooked by casual investors.
10. Future Prospects and Opportunities
India’s derivatives market continues to evolve. Key trends include:
Commodity Derivatives Growth: Increasing interest in metals, energy, and agricultural products.
Index Options Expansion: More indices beyond Nifty and Bank Nifty are being introduced.
Retail Participation Rise: Greater financial literacy and technology adoption are expanding the retail base.
Integration with Global Markets: Cross-border derivatives trading and currency hedging will increase as India becomes a global financial hub.
The secret for future success is adaptability—traders who embrace innovation, data analytics, and regulatory foresight will dominate the landscape.
Conclusion
India’s derivatives market is a sophisticated arena where knowledge, strategy, and discipline converge. Its “secrets” lie not in shortcuts but in understanding leverage, risk management, hedging techniques, volatility strategies, and market microstructure. With proper education, analytical skills, and technological support, both retail and institutional traders can unlock immense potential.
Derivatives are more than speculative tools—they are instruments of financial empowerment, risk mitigation, and economic stability. The Indian market, with its unique regulatory framework, growing liquidity, and technological advancements, offers opportunities that are increasingly accessible to informed participants.
For anyone serious about trading or investment, unraveling India’s derivative secrets is not just a pathway to profit but also a window into the deeper mechanics of financial markets.

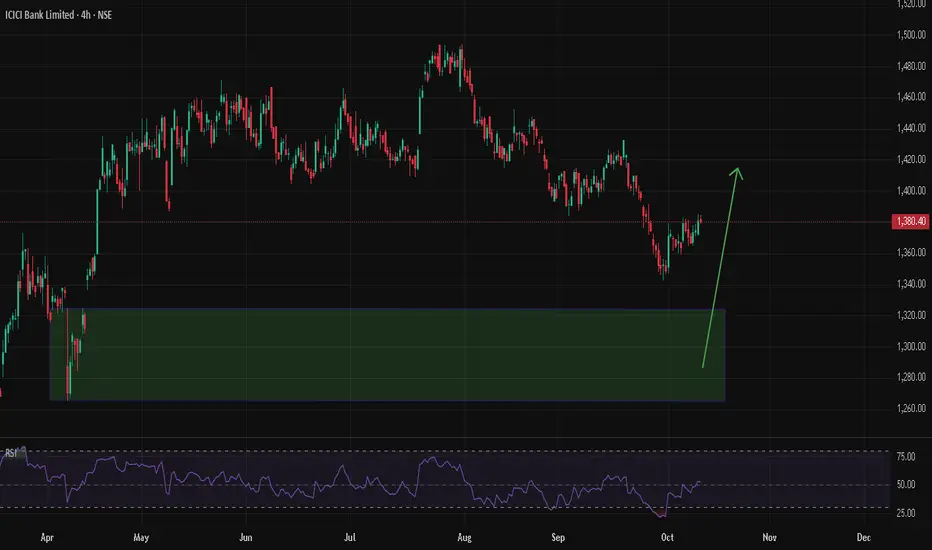
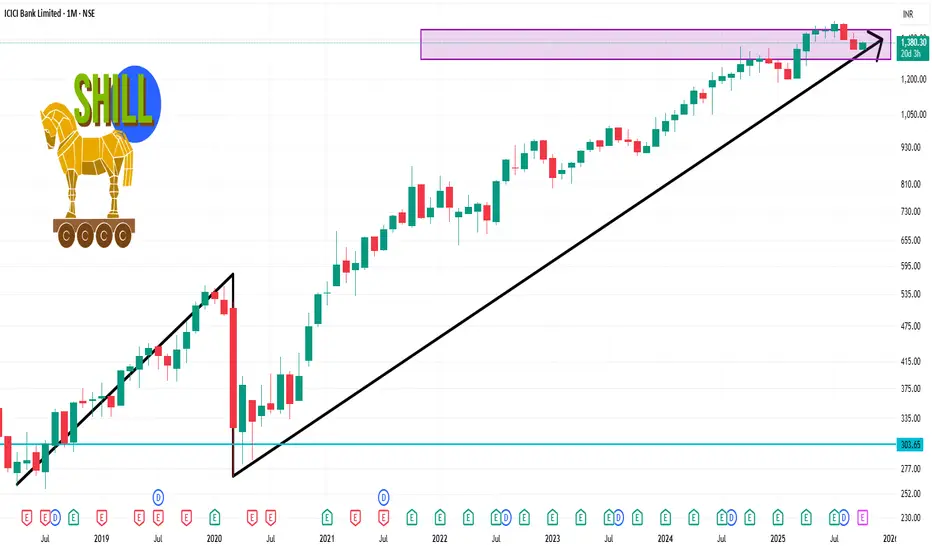
this is a 4hr zone but zone is big compare to risk reward(avoid) i can marked this zone more accurately but i dont want to so just leaving it as it is
intraday trade zone in 1 day time frame marked it after deeply analyse, before taking a long trade or buy do you own analysis first. people wil keep posted there analysis but you are the who has to decide whether to go for it or not after you analysis
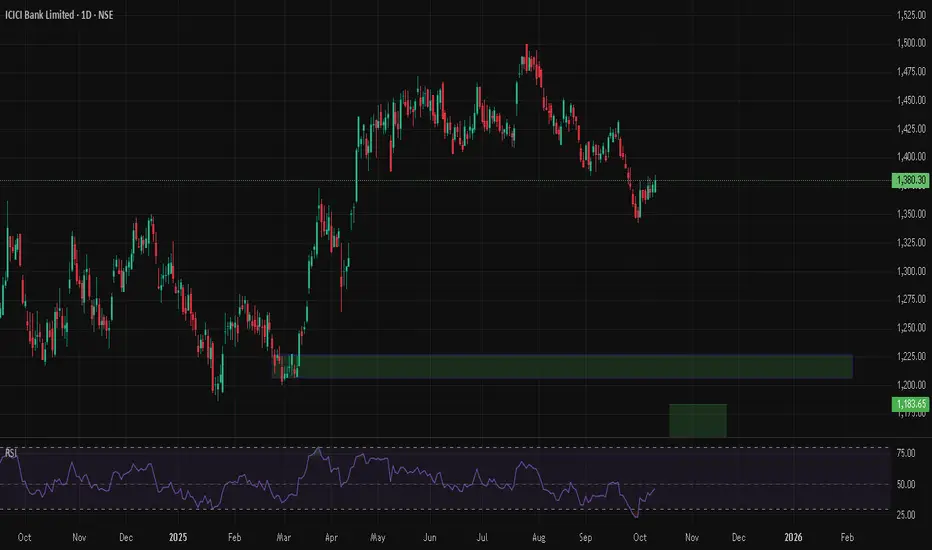
icici bank long term zones for best buying i have marked the 2 rare and best buying zones for icici if it comes here you should definitely look for a long term prospect

ICICIBANK 1 Month Time Frame 📊 Monthly Technical Levels
Pivot Point: ₹1,374.47
Support Levels:
S1: ₹1,316.13
S2: ₹1,284.27
S3: ₹1,225.93
Resistance Levels:
R1: ₹1,406.33
R2: ₹1,464.67
R3: ₹1,496.53
These levels are derived from standard pivot point calculations and can serve as key reference points for traders.
🔍 Technical Indicators
Relative Strength Index (RSI): Currently at 46.06, indicating a neutral condition, suggesting no immediate overbought or oversold conditions.
Moving Averages: The stock is showing a buy signal across various moving averages, with 8 buy signals and 4 sell signals, suggesting a bullish trend.
Technical Indicators: A strong buy signal is observed, with 10 buy signals and no sell signals, indicating positive momentum.
Institutional Trading Strategies1. Understanding Institutional Trading
Institutional trading involves the purchase and sale of large quantities of financial instruments — such as stocks, bonds, derivatives, commodities, and currencies — by organizations rather than individuals. These trades are executed through specialized desks, often using dark pools or algorithmic trading systems to minimize market impact.
The main objectives of institutional trading are:
Achieving superior risk-adjusted returns
Preserving and growing client capital
Ensuring liquidity for large trades without disrupting market prices
Managing portfolio exposure efficiently
Institutional traders possess several advantages over retail investors — access to superior technology, real-time data, exclusive research, and economies of scale. However, their size also poses challenges, particularly in executing large orders without moving the market.
2. Core Institutional Trading Strategies
Institutional traders employ a wide array of strategies that combine fundamental, technical, and quantitative analysis. Below are some of the most widely used institutional trading strategies.
2.1. Quantitative Trading (Quant Trading)
Quantitative trading relies on mathematical models, algorithms, and statistical analysis to identify and exploit market inefficiencies. Institutions use high-speed computing systems to process vast datasets and execute trades within milliseconds.
Key Techniques:
Statistical Arbitrage: Exploiting short-term pricing anomalies between correlated assets.
Mean Reversion: Assuming prices revert to their historical average after deviations.
Factor Models: Using multi-factor models (like Fama-French) to assess expected returns based on variables such as value, momentum, and size.
Machine Learning Models: Using AI and neural networks to detect complex patterns that traditional models might miss.
Example:
A hedge fund’s algorithm may detect that two correlated stocks (say, Coca-Cola and PepsiCo) have diverged unusually. The system buys the underperforming stock and sells the outperforming one, anticipating a reversion to the mean.
2.2. Algorithmic Trading (Algo Trading)
Algorithmic trading uses pre-programmed instructions to execute trades automatically. These instructions follow specific criteria — such as timing, price, volume, or market conditions.
Popular Algorithmic Strategies:
VWAP (Volume Weighted Average Price): Aims to execute orders close to the day’s average price weighted by volume.
TWAP (Time Weighted Average Price): Divides large orders into smaller chunks executed at regular intervals to minimize market impact.
Implementation Shortfall: Balances execution cost and market risk by optimizing trade timing.
Smart Order Routing (SOR): Directs orders to multiple venues (exchanges, dark pools) to find the best execution price.
Institutional Use Case:
A mutual fund seeking to buy 1 million shares of Infosys might use a VWAP algorithm to distribute the order throughout the day to avoid moving the price significantly.
2.3. High-Frequency Trading (HFT)
HFT is an advanced subset of algorithmic trading characterized by ultra-fast execution and extremely short holding periods. These systems use powerful servers colocated near exchange data centers to minimize latency.
Features:
Thousands of trades per second
Exploitation of tiny price inefficiencies
Reliance on speed, not long-term fundamentals
Common HFT Strategies:
Market Making: Continuously quoting buy and sell prices to capture bid-ask spreads.
Latency Arbitrage: Profiting from information delays between exchanges.
Event Arbitrage: Reacting instantly to news or data releases before others can.
Impact on Markets:
While HFT provides liquidity and tightens spreads, it can also cause “flash crashes” and sudden volatility spikes when algorithms malfunction.
2.4. Arbitrage Strategies
Arbitrage is the simultaneous buying and selling of an asset in different markets to profit from price discrepancies. Institutional traders specialize in multiple types of arbitrage.
Major Types:
Merger Arbitrage: Exploiting price gaps during mergers or acquisitions.
Convertible Arbitrage: Trading between convertible bonds and the underlying stock.
Index Arbitrage: Profiting from mispricing between index futures and constituent stocks.
Cross-Market Arbitrage: Taking advantage of price differences between global exchanges.
Example:
If Reliance Industries trades at ₹2,500 on NSE but ₹2,510 on BSE, an algorithm could buy on NSE and sell on BSE simultaneously to earn a ₹10 profit per share — before prices converge.
2.5. Fundamental Strategies
Not all institutional trading is algorithmic. Many funds still rely on deep fundamental analysis to identify undervalued or overvalued securities.
Approaches Include:
Value Investing: Focusing on undervalued stocks with strong fundamentals.
Growth Investing: Targeting companies with high earnings potential.
Event-Driven Trading: Investing around corporate events such as earnings reports, spin-offs, or bankruptcies.
Sector Rotation: Shifting investments between sectors based on macroeconomic cycles.
Institutional analysts use financial models like discounted cash flow (DCF), relative valuation ratios (P/E, P/B), and macroeconomic forecasts to support these strategies.
2.6. Momentum and Trend-Following Strategies
Momentum strategies exploit the tendency of assets that have performed well in the recent past to continue outperforming in the short term. Conversely, trend-following strategies look for longer-term patterns.
Tools Used:
Moving Averages (50-day, 200-day)
Relative Strength Index (RSI)
MACD (Moving Average Convergence Divergence)
Volume Trends
Example:
A hedge fund might go long on Nifty futures when the index crosses above its 200-day moving average — signaling an uptrend — and short when it dips below.
2.7. Market Neutral Strategies
Market-neutral strategies aim to remove systematic (market) risk by taking offsetting positions. The goal is to profit from relative performance rather than overall market direction.
Common Forms:
Long/Short Equity: Buying undervalued stocks and shorting overvalued ones within the same sector.
Pairs Trading: Trading correlated assets to exploit divergence.
Statistical Arbitrage: Using data models to balance exposure.
Benefit:
These strategies can yield profits even in bear markets, as gains on short positions offset long losses.
2.8. Global Macro Strategies
Global macro funds base their trades on macroeconomic trends such as interest rates, inflation, GDP growth, or geopolitical developments. They often trade across asset classes — currencies, bonds, commodities, and equities.
Example:
If a fund expects the U.S. Federal Reserve to cut rates, it might buy emerging market equities and bonds, anticipating capital inflows to higher-yielding assets.
Tools Used:
Economic indicators
Central bank policy analysis
Currency correlations
Commodity cycles
Global macro strategies were famously employed by George Soros when he shorted the British pound in 1992 — earning over $1 billion in profit.
3. Tools and Technologies Behind Institutional Trading
Institutional traders leverage state-of-the-art tools for execution and analysis. These include:
Bloomberg Terminal and Refinitiv Eikon: For data analytics, research, and trade execution.
Quantitative Software: MATLAB, R, Python, and SAS for model building.
Execution Management Systems (EMS): Handle large orders and optimize trade routing.
Risk Management Platforms: Measure VaR (Value at Risk), drawdowns, and exposure.
Machine Learning & AI Tools: Predict market behavior and automate strategy optimization.
Dark Pools: Private trading venues for executing large block trades anonymously.
These technologies ensure efficiency, transparency, and precision — vital for managing billions in assets.
4. Risk Management in Institutional Trading
Effective risk management is fundamental to institutional success. Key risk control mechanisms include:
Position Sizing: Limiting trade size relative to portfolio value.
Diversification: Spreading exposure across sectors and asset classes.
Hedging: Using derivatives like options or futures to mitigate risk.
Stop-Loss and Take-Profit Orders: Automating exit levels.
Stress Testing: Simulating adverse market conditions.
Compliance and Regulation: Adhering to rules set by SEBI, SEC, or ESMA.
Institutional risk managers continuously monitor exposure metrics, ensuring alignment with clients’ investment mandates and regulatory requirements.
5. The Influence of Institutional Trading on Markets
Institutional trading profoundly impacts market structure and behavior:
Liquidity Enhancement: Large trades ensure constant buying/selling activity.
Price Efficiency: Arbitrage and quant models correct mispricing rapidly.
Market Volatility: Large orders and algorithms can amplify short-term swings.
Price Discovery: Institutional research drives fair value assessments.
Benchmarking: Their activity often sets reference prices for smaller participants.
However, excessive automation or leverage can occasionally lead to systemic risks, as seen during the 2010 “Flash Crash” and the 2008 financial crisis.
6. Ethical and Regulatory Considerations
Institutional traders operate under strict regulatory oversight to prevent market manipulation, insider trading, and unfair advantages.
Key Regulations:
MiFID II (Europe) – Enhances transparency in algorithmic trading.
SEBI Guidelines (India) – Governs algorithmic and co-location trading.
SEC Rules (U.S.) – Monitors market fairness and reporting standards.
Ethical trading practices, compliance audits, and surveillance systems help maintain market integrity.
7. The Future of Institutional Trading
The next decade will redefine institutional trading through technological innovation and shifting market dynamics.
Emerging Trends:
Artificial Intelligence (AI): Predictive modeling and autonomous decision-making.
Blockchain & Tokenization: Transparent and faster settlement of trades.
Sustainability Investing (ESG): Integrating environmental and social criteria.
Quantum Computing: Accelerating portfolio optimization.
Alternative Data: Using satellite imagery, social media sentiment, and geospatial data for insights.
Institutional trading is moving toward hyper-personalization, ethical governance, and AI-driven efficiency — bridging human expertise and machine precision.
Conclusion
Institutional trading strategies represent the pinnacle of market sophistication — blending mathematical rigor, technological innovation, and financial intuition. From quantitative arbitrage to global macro positioning, these methods collectively shape global market movements. While retail traders often react to price action, institutional investors anticipate it, guided by data and disciplined execution.
As financial markets evolve with automation, data analytics, and AI, institutional traders will continue to lead innovation — defining how capital flows, risk is managed, and wealth is created in the modern economy.
ICICI Bank – Low-Risk Investment OpportunityFor positional investments , I prefer analyzing the weekly chart to filter out short-term noise and whipsaws.
The price has been consistently respecting the 50-week moving average (50 MA) since 2023 - a strong sign of trend stability.
The stock is currently trading near a demand zone, which also aligns with a previous resistance turned support area.
There’s a confluence of bullish factors - 50 MA support, horizontal demand zone, and a hidden bullish RSI divergence - all pointing to a potential reversal with a favorable risk–reward setup.
Overall, this setup presents a low-risk entry opportunity for medium- to long-term investors looking to ride the broader uptrend.

ICICI looking for a Strong 25% Possibl3 Return If it Tajes SuppoChart Speaks for Itself.
If ICICI is Able to Hold the Resistance at around 1320 levels. Looking at It's sustained Growth we Can expect around 25% returns in next 6-7 months

Part 2 Intraday Master ClassTraders use options for three main purposes:
Hedging: Investors use options to protect their portfolios from adverse price movements. For example, owning a put option can protect a stock investor from a market downturn.
Speculation: Traders buy or sell options to profit from expected movements in asset prices. Since options require a smaller initial investment compared to buying stocks directly, they offer higher potential returns—but also higher risk.
Income Generation: Many investors sell (write) options to earn premiums regularly. For example, covered call writing is a popular income strategy where investors sell call options on stocks they already own.
While options offer leverage and flexibility, they also carry risks—especially for sellers. The maximum loss for an option buyer is limited to the premium paid, but an option seller’s potential loss can be unlimited if the market moves sharply against them.

Advanced Option Strategies1. Understanding Advanced Option Strategies
Advanced option strategies involve combining multiple option positions in ways that optimize outcomes for specific market scenarios. Unlike straightforward buying or selling of single options, these strategies use combinations of calls, puts, or both, sometimes with different strike prices and expiration dates, to achieve nuanced profit/loss structures.
Traders use these strategies for several reasons:
Hedging: Protect existing portfolios against adverse price movements.
Speculation: Take calculated bets on the direction, volatility, or timing of price movements.
Income Generation: Earn premiums through selling options while controlling risk.
Volatility Trading: Profit from changes in implied volatility rather than price direction alone.
To successfully implement advanced option strategies, traders must have a deep understanding of option Greeks (Delta, Gamma, Theta, Vega, and Rho), as these metrics determine how option prices react to market movements.
2. Popular Advanced Option Strategies
2.1 Spreads
Spreads involve buying and selling options of the same type (calls or puts) on the same underlying asset but with different strike prices or expiration dates. Spreads can be broadly categorized into vertical spreads, horizontal spreads, and diagonal spreads.
2.1.1 Vertical Spreads
Vertical spreads involve buying and selling options with the same expiration date but different strike prices. They can be bullish or bearish.
Bull Call Spread: Buy a call at a lower strike and sell a call at a higher strike. This strategy limits both profit and loss and is profitable if the stock price rises moderately.
Bear Put Spread: Buy a put at a higher strike and sell a put at a lower strike. Profitable if the underlying declines moderately.
Example: A stock trading at $100:
Buy 1 call at $100 strike for $5
Sell 1 call at $110 strike for $2
Net cost: $3, Maximum gain: $7, Maximum loss: $3
2.1.2 Horizontal (Time) Spreads
Also called calendar spreads, horizontal spreads involve options with the same strike price but different expiration dates.
Long Calendar Spread: Buy a long-dated option and sell a short-dated option at the same strike. This strategy profits from low volatility and time decay.
2.1.3 Diagonal Spreads
A combination of vertical and horizontal spreads, diagonal spreads involve options with different strikes and expiration dates. These allow traders to take advantage of both time decay and directional moves.
2.2 Straddles and Strangles
These strategies are designed to profit from volatility, regardless of price direction.
2.2.1 Straddle
A straddle involves buying a call and a put at the same strike price and expiration date. Traders use straddles when they expect significant price movement but are unsure of the direction.
Pros: Unlimited profit potential if the underlying makes a large move.
Cons: High cost due to purchasing two options, risk of losing premium if the price remains stable.
2.2.2 Strangle
A strangle is similar to a straddle but uses out-of-the-money options. This makes it cheaper but requires a bigger price movement to be profitable.
Example: Stock at $100:
Buy 1 OTM call at $105
Buy 1 OTM put at $95
Outcome: Profitable if the stock moves significantly beyond $105 or below $95.
2.3 Butterfly Spreads
Butterfly spreads are limited-risk, limited-reward strategies that involve three strike prices. The most common is the call butterfly spread:
Buy 1 call at lower strike
Sell 2 calls at middle strike
Buy 1 call at higher strike
This strategy profits if the underlying price remains near the middle strike at expiration. Variants include put butterflies and iron butterflies.
Iron Butterfly: Combines a call and put spread, offering a strategy that benefits from low volatility with defined risk and reward.
2.4 Condors
Condor strategies, like butterflies, involve four strikes and aim to profit from a narrow price range.
Iron Condor: Sell an OTM put and OTM call, and buy further OTM put and call to limit risk.
Pros: Generates income in low volatility markets.
Cons: Limited profit, requires precise range predictions.
2.5 Ratio Spreads
Ratio spreads involve buying and selling options in unequal quantities. For instance, a trader might buy 1 call and sell 2 calls at a higher strike.
Pros: Can generate credit upfront, benefit from moderate moves.
Cons: Unlimited risk if the underlying moves sharply beyond the sold options.
2.6 Backspreads
Backspreads are the opposite of ratio spreads: they involve selling fewer options and buying more further out-of-the-money options. Traders use them when expecting large moves in the underlying asset.
Example: Sell 1 ATM call, buy 2 OTM calls.
Outcome: Profitable if the stock surges, limited risk if the stock drops slightly.
2.7 Synthetic Positions
Synthetic strategies replicate the payoff of holding the underlying asset using options:
Synthetic Long Stock: Buy a call and sell a put at the same strike and expiration.
Synthetic Short Stock: Sell a call and buy a put.
These strategies allow traders to gain exposure to price movements without actually holding the underlying stock.
2.8 Box Spread
A box spread is a combination of a bull call spread and a bear put spread, effectively creating a riskless arbitrage if executed correctly.
Profit/Loss: The spread’s value converges to the difference between strikes at expiration, usually used by professional traders for interest rate arbitrage.
3. Practical Considerations
Advanced option strategies require careful planning and risk management. Key considerations include:
Volatility: High implied volatility increases option premiums, affecting the profitability of debit vs. credit strategies.
Time Decay (Theta): Strategies like calendar spreads benefit from time decay, while long options lose value as expiration approaches.
Liquidity: Illiquid options can have wide bid-ask spreads, increasing execution costs.
Greeks Management: Understanding Delta, Gamma, Vega, and Theta is critical for predicting how positions respond to market changes.
Margin Requirements: Complex strategies, especially those with naked positions, may require significant margin.
4. Risk Management
Even advanced strategies carry risks. Techniques to manage risk include:
Diversification: Avoid putting all capital into a single underlying or strategy.
Stop-Loss Orders: Predefined exit points can prevent large losses.
Position Sizing: Limit exposure per trade to a fraction of the total portfolio.
Adjustments: Rolling or converting positions can mitigate adverse movements.
5. Advantages of Advanced Option Strategies
Flexibility: Traders can structure strategies for bullish, bearish, or neutral market conditions.
Defined Risk: Many strategies offer limited-risk exposure compared to outright positions in the underlying asset.
Profit from Volatility: Traders can earn profits even in sideways markets.
Portfolio Hedging: Protects against large moves without selling assets.
6. Challenges and Limitations
Complexity: Understanding multiple legs, Greeks, and expiration cycles can be challenging.
Execution Costs: Commissions and slippage can reduce profits.
Market Timing: Many strategies require precise timing and predictions.
Psychological Pressure: Multi-leg trades can be stressful and require constant monitoring.
7. Conclusion
Advanced option strategies offer traders sophisticated tools to manage risk, speculate on price movements, and generate income. From spreads and straddles to butterflies and synthetic positions, each strategy has unique characteristics suited for different market conditions. Success in these strategies requires a thorough understanding of option pricing, Greeks, volatility, and risk management techniques. While the rewards can be substantial, the complexity and risks demand disciplined execution, continual learning, and practice.
For traders willing to invest the time in mastering these strategies, options provide a versatile framework to navigate today’s dynamic markets and optimize portfolio performance.
Mastering Trade with Volume: The Hidden Key to Market Precision1. Understanding Volume in Trading
Volume refers to the total number of units traded for a particular asset within a given time period. It is commonly displayed as a histogram at the bottom of price charts. Volume tells traders how strong a price move is, and can provide insights into market psychology:
High volume often confirms trends or signals the climax of a move.
Low volume indicates weak conviction or a potential pause in the market.
Volume spikes can mark key turning points or breakout areas.
Volume is a measure of liquidity. Highly liquid markets with large volume enable smoother trading, while thin volume markets may show exaggerated price swings.
2. Why Volume Matters in Trading
Volume analysis is not just about counting trades—it’s about interpreting market intent. Here’s why it matters:
Confirming Trends: A rising price with increasing volume validates the uptrend. Conversely, a rising price on declining volume suggests weakening momentum.
Identifying Reversals: Sudden volume spikes during downtrends or uptrends often precede reversals.
Breakouts and Fakeouts: Breakouts from key support or resistance levels are more reliable when confirmed by volume.
Market Sentiment: Volume reveals the psychology of participants—buyers and sellers—showing whether a trend is driven by genuine interest or speculation.
3. Key Volume-Based Trading Tools
Several technical tools leverage volume to improve trading accuracy:
Volume Bars: The simplest tool, showing traded quantity per time period.
Volume Moving Average (VMA): Helps identify unusual volume relative to average.
On-Balance Volume (OBV): Cumulative measure of volume flow to detect buying/selling pressure.
Volume Price Trend (VPT): Combines price and volume to measure the strength of moves.
Volume Profile: Displays volume distribution across price levels to identify key zones of support/resistance.
Each of these tools offers traders a unique perspective on market dynamics and provides high-probability trade setups.
4. Volume and Market Structure
To trade effectively with volume, it’s critical to combine it with market structure analysis:
Support and Resistance: High volume near support/resistance confirms strong buying or selling interest.
Breakouts: Breakouts accompanied by volume spikes indicate genuine moves, while low-volume breakouts are likely false.
Trend Continuation: In an uptrend, higher volume on rallies and lower volume on pullbacks suggests a healthy trend.
Trend Exhaustion: When volume decreases at the end of a trend, it signals potential reversal or consolidation.
By aligning volume with price action and market structure, traders can filter noise and focus on high-confidence trades.
5. Volume Trading Strategies
Volume trading is highly adaptable across time frames, from intraday to long-term investing. Here are some proven strategies:
a) Volume Breakout Strategy
Identify key support or resistance levels.
Enter trades when price breaks out with above-average volume.
Use volume spikes to confirm the legitimacy of breakouts.
b) Volume Reversal Strategy
Look for extreme volume spikes after prolonged trends.
Price action with unusual volume may indicate trend exhaustion.
Combine with candlestick patterns or indicators for confirmation.
c) Volume Divergence Strategy
Compare volume trends with price trends.
If price rises but volume falls, it suggests weakening buying pressure.
Similarly, falling prices with declining volume may indicate sellers are losing control.
d) Volume-Weighted Average Price (VWAP) Strategy
VWAP shows average price based on volume and is widely used by institutional traders.
Traders can align entry and exit points with VWAP levels for better trade execution.
6. Psychological Insights from Volume
Volume analysis provides insights into market psychology:
Fear and Greed: Sudden surges in volume often reflect panic selling or aggressive buying.
Institutional Activity: Large volume spikes may indicate accumulation or distribution by institutional players.
Herd Behavior: Retail traders often follow price blindly, but volume analysis reveals true market participation.
Understanding these psychological cues helps traders anticipate future price action rather than reacting to it.
7. Combining Volume with Other Indicators
Volume works best in combination with other technical tools:
With Moving Averages: Confirms trend strength.
With RSI/Stochastic: Volume validates overbought/oversold conditions.
With Price Patterns: Breakouts, triangles, and flags are more reliable with volume confirmation.
With Market Depth: Combines volume data with order book analysis for precision.
8. Common Mistakes in Volume Trading
Even experienced traders make errors:
Ignoring Relative Volume: Not all volume is meaningful; compare with average levels.
Overtrading on Volume Spikes: Volume spikes without context can lead to false signals.
Neglecting Trend Context: Volume must be analyzed within the current market structure.
Misreading Low-Liquidity Markets: Thinly traded instruments may produce misleading volume patterns.
Avoiding these mistakes ensures that volume becomes a powerful ally, not a misleading signal.
9. Practical Examples
Breakout Example: A stock breaks resistance at ₹150 with 3x average volume. Traders who wait for volume confirmation are more likely to profit.
Reversal Example: A prolonged downtrend shows a sudden surge in buying volume at ₹100. This often signals the bottoming phase.
Divergence Example: Nifty rises to new highs, but OBV falls. This warns of a weakening rally, prompting traders to tighten stops or take profits.
10. Conclusion
Volume is often called the “lifeblood of trading” for a reason. It tells the story behind the price, revealing the strength, conviction, and psychology of market participants. Traders who master volume analysis gain a critical edge—identifying high-probability trades, confirming trends, and spotting reversals early. By combining volume with price action, market structure, and other technical indicators, traders can transform their approach from guesswork to precision trading.
Ultimately, volume is not just a number—it is the pulse of the market, and learning to read it effectively is one of the most powerful skills a trader can acquire.
ICICI Bank: Resistance Turned Support Powers Next RallyTechnical Analysis
ICICI Bank showcases another remarkable wealth creation story spanning over two decades. The stock has delivered an extraordinary super bullish rally, transforming from ₹40 to the current trading level of ₹1,351 - representing an impressive 33.8x growth over 20+ years.
The ₹1,345-₹1,365 zone has historically acted as a strong resistance, tested multiple times. However, with the confirmation of strong FY25 results, the stock decisively broke out from this resistance zone and created a new all-time high at ₹1,500.
Following the breakout peak, the stock witnessed a sudden fall and is now trading back in the same zone at current market price of ₹1,351. This presents a critical juncture - if the earlier resistance zone transforms into support with bullish candlestick pattern confirmations, it could signal the next leg of the rally.
Entry Strategy: Enter only on confirmation of ₹1,345-₹1,365 zone acting as support with bullish patterns.
Targets:
Target 1: ₹1,400
Target 2: ₹1,450
Target 3: ₹1,500
Stop Losses:
Critical Support: ₹1,200 (crucial demand zone)
If ₹1,200 level doesn't sustain, no more expectations on this stock.
FY25 Financial Highlights (vs FY24 & FY23)
Total Income: ₹1,86,331 Cr (↑ +17% YoY from ₹1,59,516 Cr; ↑ +95% from FY23 ₹95,407 Cr)
Total Expenses: ₹1,30,078 Cr (↑ +31% YoY from ₹99,560 Cr; ↑ +48% from FY23 ₹87,864 Cr)
Financing Profit: ₹-32,775 Cr (Improved from ₹-14,152 Cr in FY24)
Profit Before Tax: ₹72,854 Cr (↑ +21% YoY from ₹60,434 Cr; ↑ +58% from FY23 ₹46,256 Cr)
Profit After Tax: ₹54,569 Cr (↑ +18% YoY from ₹46,081 Cr; ↑ +54% from FY23 ₹35,461 Cr)
Diluted EPS: ₹71.65 (↑ +14% YoY from ₹63.02; ↑ +47% from FY23 ₹48.74)
Fundamental Highlights
ICICI Bank delivered robust FY25 performance with 18% PAT growth to ₹54,569 crore, supported by strong 17% revenue growth. The bank announced Q4 FY25 net profit of ₹12,630 crore, marking 18% increase, and declared ₹11 per share dividend reflecting strong financial health.
Market cap stands at ₹9,71,186 crore (up 4.06% in 1 year) with total revenue reaching ₹1,90,830 crore and profit of ₹56,563 crore. Stock is trading at 3.08 times its book value, indicating reasonable valuation for quality franchise.
Asset quality continues to improve with gross NPA dropping to 1.97% in Q2FY25 from 2.48% in Q2FY24, while net NPA ratio remained healthy at 0.43% in Q1 FY25. This demonstrates effective risk management and strong credit discipline.
The bank shows strength near key support zone of 1370-1390 on daily charts, with technical indicators suggesting potential diamond pattern formation around 1380-1400 range. Analysts expect stable net interest margins and continued momentum.
Strong digital banking initiatives, expanding retail franchise, and consistent delivery of 14-18% profit growth across quarters validates the bank's operational excellence and market leadership position in private banking sector.
Conclusion
ICICI Bank's remarkable 20+ year journey from ₹40 to ₹1,500 all-time high, backed by strong FY25 fundamentals showing 18% PAT growth and ₹11 dividend, validates the sustained growth thesis. The critical ₹1,345-₹1,365 resistance-to-support transformation offers attractive entry opportunity for targeting ₹1,500 retest. Improving asset quality with 1.97% gross NPA, strong ROE profile, and digital transformation drive provide multiple growth catalysts. Key support at ₹1,200 provides risk management framework for this quality banking franchise.
Disclaimer: tinyurl.com

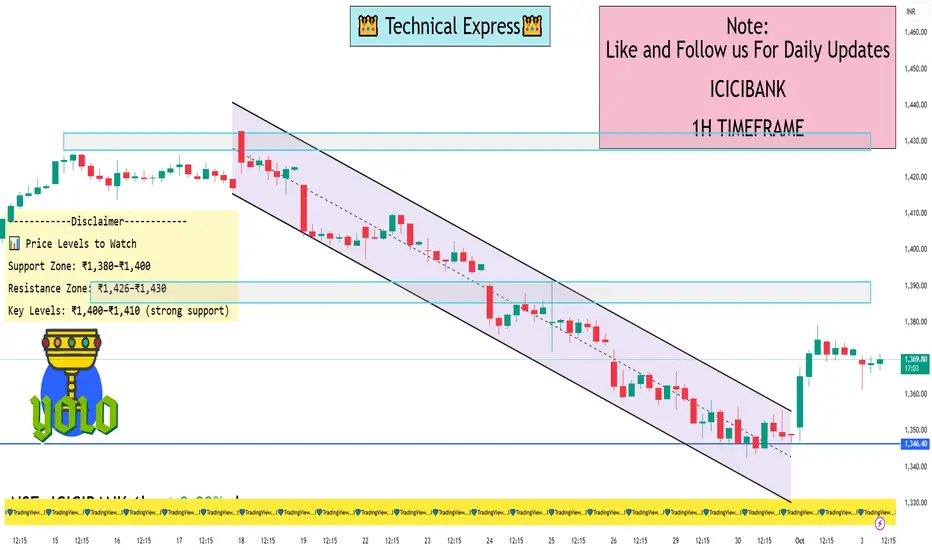
ICICIBANK 1 Hour View📊 1-Hour Timeframe: Key Levels
🔹 Support Levels
Immediate Support: ₹1,363.14
Key Support Zones: ₹1,352.93, ₹1,333.87
🔹 Resistance Levels
Immediate Resistance: ₹1,367.07
Key Resistance Zones: ₹1,385.23, ₹1,398.47
These levels are derived from standard pivot point calculations and are commonly used by traders to identify potential reversal points within the trading day.
📈 Technical Indicators (1-Hour Chart)
Relative Strength Index (RSI): 37.26 — indicates the stock is nearing oversold conditions, suggesting potential for a price rebound.
Moving Average Convergence Divergence (MACD): -16.11 — a negative value, which may indicate bearish momentum.
Average Directional Index (ADX): 23.81 — suggests a weak trend, implying indecision in the market.
Stochastic Oscillator: 13.21 — indicates the stock is oversold, potentially signaling a reversal.
Supertrend Indicator: ₹1,398.34 — indicates a bearish trend.
These indicators collectively suggest a bearish short-term outlook, with potential for a reversal if support levels hold.
📊 Price Levels to Watch
Support Zone: ₹1,380–₹1,400
Resistance Zone: ₹1,426–₹1,430
Key Levels: ₹1,400–₹1,410 (strong support)
🔄 Summary
ICICI Bank Ltd. is currently trading near its support levels on the 1-hour chart. The RSI indicates potential oversold conditions, while other indicators suggest a weak bearish trend. Traders should monitor the key support and resistance levels mentioned above for potential breakout or breakdown scenarios.
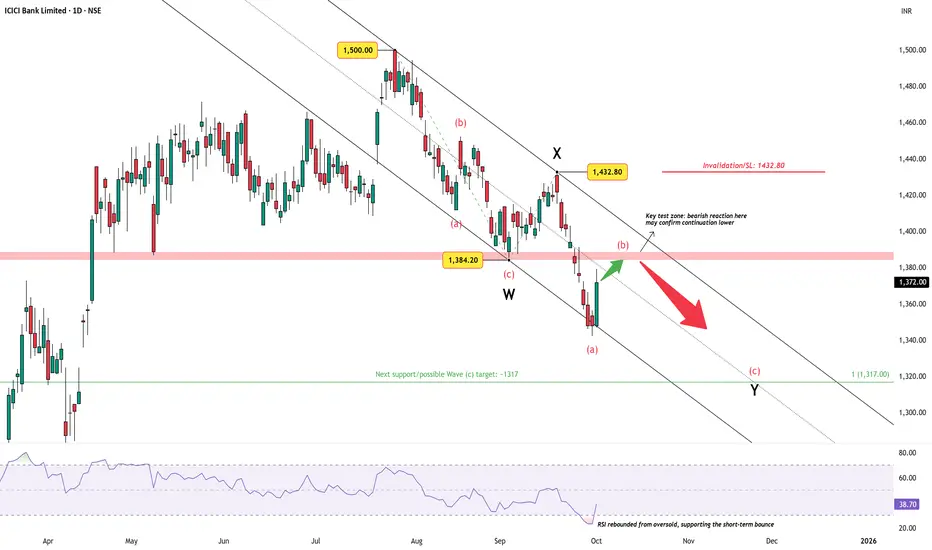
ICICI Bank – Relief Rally into ResistanceAfter topping at ₹1500 , ICICI Bank has corrected over 10% into late September, carving out a clear W–X–Y corrective structure. The recent bounce from oversold RSI levels was expected, but price is now heading straight into the crucial resistance band near ₹1384 .
A bearish reaction here would validate the ongoing correction, opening the path toward the next support / Wave (c) target at ~₹1317 .
However, any sustained move above ₹1432.80 would invalidate the bearish view and suggest a different structure in play.
Overall, the setup currently favors caution on rallies, with focus on whether sellers defend the resistance band.
Disclaimer: This analysis is for educational purposes only and does not constitute investment advice. Please do your own research (DYOR) before making any trading decisions.
Option Trading SecretsPart 1: Understanding Options – The Foundation of Secrets
1.1 What Are Options?
Options are financial derivatives that give the holder the right, but not the obligation, to buy or sell an asset at a predetermined price (strike price) before a certain date (expiry). There are two main types:
Call Options: Right to buy.
Put Options: Right to sell.
Secret Insight: Many traders fail because they focus on “predicting direction” rather than understanding the time value and volatility embedded in options prices.
1.2 Components of an Option
Strike Price – The predetermined price of the underlying asset.
Expiry Date – The date the option contract expires.
Premium – The price paid to buy the option.
Intrinsic Value – The value if exercised today.
Time Value – Additional value due to the time left until expiry.
Secret Insight: Time decay (Theta) is often overlooked. Successful option traders exploit time decay instead of fighting against it.
1.3 Why Trade Options?
Leverage: Small capital controls large positions.
Flexibility: Can profit in bullish, bearish, or neutral markets.
Hedging: Protects your stock portfolio against losses.
Income Generation: Selling options (writing calls/puts) can create steady cash flow.
Secret Insight: Most beginners try to predict market direction, while pros focus on probability, risk management, and strategic positioning.
Part 2: Core Option Trading Secrets
2.1 Volatility – The Hidden Force
Volatility is the heartbeat of option pricing.
Implied Volatility (IV): Market’s forecast of future volatility.
Historical Volatility (HV): Past price movement.
Secret Insight: Options are more expensive when IV is high. Selling options in high IV periods and buying in low IV periods can increase success probability.
2.2 The Greeks – Your Secret Weapons
Understanding the Greeks is crucial:
Delta: Sensitivity to underlying price.
Gamma: Rate of change of Delta.
Theta: Time decay effect.
Vega: Sensitivity to volatility.
Rho: Sensitivity to interest rates.
Secret Insight: Most traders obsess over price prediction. Successful traders control risk by managing Greeks, not just by buying/selling calls or puts.
2.3 The Myth of Directional Trading
While buying calls in a bullish market or puts in a bearish market is intuitive, it’s often a losing strategy if done without:
Timing
Volatility awareness
Strike price selection
Secret Insight: Many profits come from neutral strategies that capitalize on time decay or volatility changes.
Part 3: Advanced Option Strategies – Secrets of the Pros
3.1 Spreads – Reducing Risk and Cost
Vertical Spread: Buy and sell options of the same type and expiry but different strikes.
Horizontal/Calendar Spread: Exploit time decay differences.
Diagonal Spread: Combines vertical and horizontal spreads for advanced hedging.
Secret Insight: Spreads reduce cost and risk while keeping profit potential. Many retail traders ignore them, chasing naked options for huge gains and ending up in losses.
3.2 Iron Condors & Butterflies – Secrets for Range-Bound Markets
Iron Condor: Sell OTM calls and puts, buy further OTM options to hedge risk.
Butterfly Spread: Profit from minimal movement around a target price.
Secret Insight: The real secret is managing position size and probability. Profitable options trading often comes from small, consistent wins rather than rare big wins.
3.3 Protective Strategies – Hedging Like a Pro
Protective Puts: Own stock but buy puts to limit downside.
Covered Calls: Own stock and sell calls to generate income.
Secret Insight: The best traders treat options primarily as insurance and income tools, not just speculation.
Part 4: Risk Management Secrets
4.1 Position Sizing
Never risk more than 1–2% of capital on a single trade.
Adjust size based on volatility and Greeks.
Secret Insight: Even the best strategies fail without disciplined capital management.
4.2 Avoiding Common Traps
Buying deep OTM options as “lottery tickets.”
Ignoring IV crush after earnings.
Over-leveraging and underestimating Theta decay.
Secret Insight: Most traders fail psychologically before failing technically. Emotional control is a secret weapon.
4.3 The Power of Probability
Options trading isn’t gambling—it’s about stacking probabilities in your favor.
Favor high probability setups with defined risk.
Accept small consistent profits over chasing massive gains.
Part 5: Market Timing Secrets
5.1 Earnings and Events
Options react violently to earnings, FOMC, or geopolitical events.
Secret Insight: Use spreads or iron condors around events rather than naked buying. This controls risk while keeping upside potential.
5.2 Using Technical Analysis
Support/resistance levels, trend lines, and moving averages can guide strike selection.
Combine technicals with implied volatility for high-probability trades.
Secret Insight: Pros don’t blindly buy calls and puts—they combine technical triggers with probability and volatility analysis.
5.3 Psychological Edge
Patience beats impulsiveness.
Accept losses quickly; let winners run within limits.
Secret Insight: Trading psychology, discipline, and emotional control are the ultimate secrets that most books don’t emphasize.
Part 6: Building a System – From Secrets to Strategy
6.1 Developing a Personal Edge
Track historical trades and analyze winning patterns.
Identify setups where probability favors you.
Stick to trades that fit your risk tolerance.
6.2 Journaling & Review
Record each trade: entry, exit, rationale, and outcome.
Evaluate mistakes objectively.
Secret Insight: The market doesn’t care about your emotions. Your edge grows from systematic review and refinement.
6.3 Continuous Learning
Study options pricing models, volatility surfaces, and macro events.
Attend webinars, read research reports, and adapt strategies.
Conclusion
Option trading secrets are not magic formulas; they are disciplined habits:
Understanding volatility and Greeks.
Using spreads and hedges to control risk.
Managing position sizes and emotions.
Timing trades around probability and technical setups.
Constant learning and adaptation.
By mastering these secrets, traders can transform options trading from risky speculation to a high-probability, strategic, and disciplined pursuit.
icici bank BULLISH ICICI Bank's earnings are approaching, with weekly candles showing support at the 50-day moving average.
