Crucial Levels to Watch for ICICI BankICICI Bank has resistance near ₹1500 and strong support around ₹1300. Monitor these levels closely. If ₹1500 is broken, the next targets are ₹1638 and near ₹1700.
Trade ideas

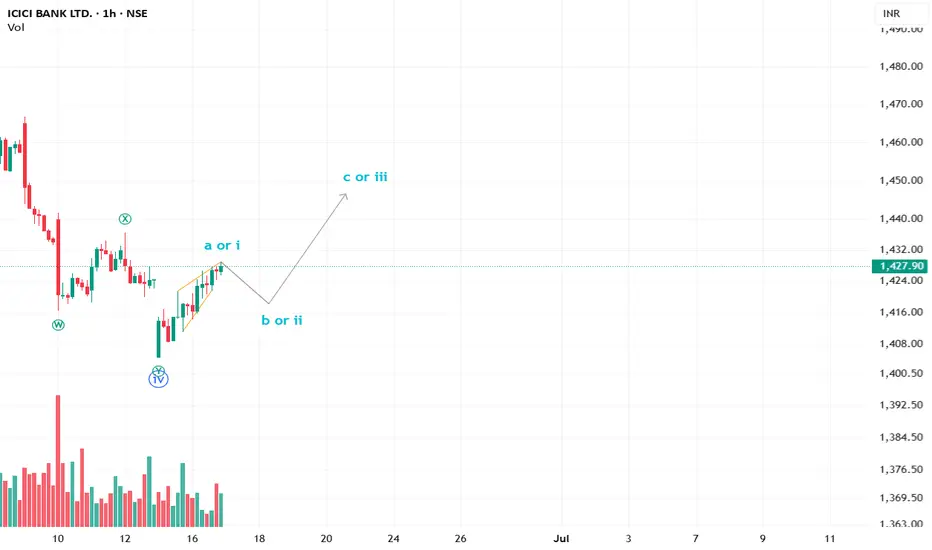
ICICIBANK can follow this path? Clues on the wayA beautiful leading diagonal in ICICI bank reflecting Wave a or i. We can see a minor downside tomorrow and an upside short-term move for a good options trade.
ICICI bank : Go long 1390-85Keep adding this bank giant with long term investment view - enter with small quantity @ 1400, 1370 holding sl 1250
We may expect it 2000, 2200 in around a year.
Accumulation strategy might workin such a big stocks.

ICICI bank Good short CandidateICICI Bank has formed an Ending Diagonal Pattern near its recent highs, typically signaling a potential reversal in trend. This pattern is often observed in the final stages of an uptrend and suggests exhaustion in bullish momentum.
Following the completion of the diagonal, the stock has broken down below the lower trendline, confirming the bearish setup. Furthermore, it has already completed a retest of the breakdown level, which strengthens the validity of the reversal signal.
From a trading perspective, this setup offers a favorable risk-reward ratio for initiating short positions, especially with a clearly defined invalidation level (above the retest zone) and a potential downside target aligned with prior support levels or Fibonacci retracement zones.
Summary:
Pattern: Ending Diagonal (Bearish)
Status: Breakdown and retest completed
Outlook: Short bias with favorable risk-reward
Watch levels: Retest zone (resistance), key support for profit booking

Icici in Buy zoneIcici 1425 is in buy zone.
After liquidity clearance it is showing positive movement
Volume supports the same.
We expect Icici could retest 1450 with support 1412 and possibility to break the resistance zone.

Time To Book Your Profit in ICICI BankHere is a detailed overview of **ICICI Bank's Business Model**:
---
## 🏦 **ICICI Bank: Company Overview**
* **Full Name:** Industrial Credit and Investment Corporation of India Bank
* **Established:** 1994 (as a bank; ICICI was originally founded in 1955)
* **Headquarters:** Mumbai, Maharashtra, India
* **Type:** Public Sector Bank (Private Sector Commercial Bank)
* **Listing:** NSE & BSE (India), NYSE (US – ADR)
* **CEO & MD (2024):** Sandeep Bakhshi
* **Tagline:** *“Hum Hai Na, Khayal Apka”*
---
## 🔷 **1. Core Business Segments**
| Segment | Description |
| --------------------------------- | --------------------------------------------------------------------------- |
| **Retail Banking** | Services for individuals – savings accounts, loans, credit cards, insurance |
| **Corporate & Wholesale Banking** | Banking for large businesses and corporates – working capital, loans, forex |
| **Treasury Operations** | Investments, trading in bonds, forex, derivatives |
| **Rural & Agriculture Banking** | Loans and financial inclusion products for rural India |
| **International Banking** | NRI services, overseas branches (UK, Canada, Dubai, Singapore, etc.) |
---
## 🔷 **2. Revenue Model**
ICICI Bank earns through a mix of **interest-based** and **non-interest income**:
| Revenue Stream | Source |
| -------------------- | ------------------------------------------------------------------------------------ |
| **Interest Income** | Loans to retail, corporate, SME, and agriculture customers |
| **Fee-Based Income** | Charges on cards, ATM, forex, processing, and insurance commissions |
| **Treasury Income** | Investments in government securities, derivatives, and forex |
| **Cross-Selling** | Distribution of insurance (via ICICI Prudential), mutual funds (via ICICI AMC), etc. |
> 🧾 **FY24 Revenue:** ₹125,000+ crore
> 💰 **Net Profit (FY24):** ₹41,000+ crore
> 🏦 **Net Interest Margin (NIM):** \~4.5%
---
## 🔷 **3. Key Products & Services**
### 🔹 **Retail Banking**
* Savings & Current Accounts
* Home Loans, Car Loans, Personal Loans
* Credit Cards (Coral, Rubyx, Amazon Pay ICICI)
* Digital Banking: iMobile app, internet banking
### 🔹 **Corporate & SME Services**
* Working Capital Loans
* Cash Management
* Forex & Trade Finance
* Supply Chain Financing
### 🔹 **Insurance & Investments**
* Life Insurance (via ICICI Prudential)
* General Insurance (via ICICI Lombard)
* Mutual Funds & Portfolio Services (ICICI Prudential AMC)
---
## 🔷 **4. Key Customer Segments**
| Segment | Description |
| -------------------------------------- | ----------------------------------------------------- |
| **Retail Customers** | Salaried professionals, self-employed, students, NRIs |
| **Corporate Clients** | Large listed companies, MSMEs, MNCs |
| **Rural Clients** | Farmers, SHGs, rural businesses |
| **High Net-Worth Individuals (HNWIs)** | Private banking & wealth management |
---
## 🔷 **5. Key Partners**
* **Subsidiaries**: ICICI Prudential Life, ICICI Lombard, ICICI Securities, ICICI AMC
* **Fintech Partners**: PhonePe, Google Pay, Razorpay, Paytm
* **Technology Providers**: Infosys (Finacle), IBM, Microsoft
* **Regulators**: RBI, SEBI, IRDAI
---
## 🔷 **6. Cost Structure**
* Employee costs
* IT infrastructure and branch operations
* Risk provisioning (for bad loans)
* Marketing and distribution
* Compliance & regulatory costs
---
## 🔷 **7. Distribution Channels**
* **Physical Branches:** \~5,900+ across India
* **ATMs:** \~17,000+
* **Digital Channels:** iMobile app, internet banking, WhatsApp banking
* **Phone Banking & Relationship Managers**
> ICICI is among India’s most digital-first banks with **\~90% transactions** happening via digital channels.
---
## 🔷 **8. Competitive Advantages**
* Strong digital ecosystem (early adopter of mobile & internet banking)
* Universal bank model with end-to-end services
* Strong retail and SME franchise
* Diversified income streams from subsidiaries
* High asset quality and robust capital adequacy
---
## 🔷 **9. Challenges**
* Competition from fintechs and neo-banks
* Regulatory risks (RBI tightening norms)
* Cybersecurity and data privacy
* Interest rate and credit risk cycles
* High exposure to retail credit (in case of economic slowdown)
---
## 🔷 **10. Business Model Canvas (Summary)**
| **Component** | **Details** |
| -------------------------- | ------------------------------------------------------------- |
| **Key Partners** | Subsidiaries, fintechs, payment platforms |
| **Key Activities** | Lending, deposit-taking, digital banking, investment services |
| **Value Proposition** | End-to-end financial services, secure digital platforms |
| **Customer Segments** | Retail, SMEs, Corporates, NRIs |
| **Customer Relationships** | Long-term, digital-first, personalized |
| **Channels** | Branches, iMobile app, website, contact centers |
| **Revenue Streams** | Interest income, fees, investment returns |
| **Cost Structure** | Branch operations, tech infrastructure, employee costs |
---
## 📈 **Subsidiaries of ICICI Group**
| Subsidiary | Domain |
| ------------------------- | --------------------------------- |
| **ICICI Prudential Life** | Life Insurance |
| **ICICI Lombard** | General Insurance |
| **ICICI Securities** | Stock Broking, Investment Banking |
| **ICICI Prudential AMC** | Mutual Funds |
| **ICICI Bank UK, Canada** | International Banking |
---
thanks
ICICI bank ready for fresh ATH buy on dip near support How My Harmonic pattern projection Indicator work is explained below :
Recent High or Low :
D-0% is our recent low or high
Profit booking zone: D13% -D15% is
range if break them profit booking start on uptrend or downtrend but only profit booking, trend not changed
SL reversal zone : SL 23% and SL 25% is reversal zone if break then trend reverse and we can take reverse trade
Target : T1, T2, T3, T4 and .
Are our Target zone

ICICIBANKChart formed false breakout on rsi yesterday currently trading at 50% fib range from last swing low , possible bounce from current levels with SL candle closing below

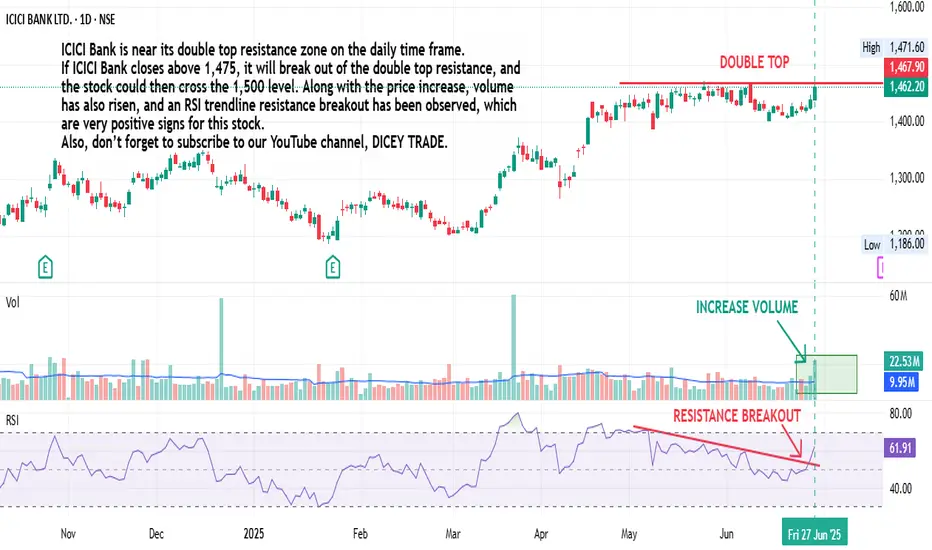
ICICI BANK Double Top Breakout: Is a Major Price Surge Ahead? ICICI Bank is near its double top resistance zone on the daily time frame. If ICICI Bank closes above 1,475, it will break out of the double top resistance, and the stock could then cross the 1,500 level. Along with the price increase, volume has also risen, and an RSI trendline resistance breakout has been observed, which are very positive signs for this stock. Also, don’t forget to subscribe to our YouTube channel, DICEY TRADE.
ICICI Bank - Trend change ICICI Bank: A Bullish Pulse Beats Stronger
After weeks of consolidation, ICICI Bank seems to be scripting a new chapter on the charts. A classic Double Bottom pattern has emerged on the 1-hour timeframe, signaling a potential trend reversal from its recent downtrend. What’s more, the price has confidently crossed above the 50 EMA, validating early bullish intent with a neat retracement that hints at healthy market structure.
The real story, though, is in the volume. On the daily chart, elevated volumes are whispering the tale of accumulation—perhaps the smart money is taking positions ahead of a breakout?
If the current momentum sustains and we see a confirmed breakout above the neckline, targets of ₹1,450 and beyond are well within reach. The setup feels like a coiled spring—technicals aligning with intent.

Icici in beraish trendIcici 1424 is bearish trend . Volume suggests weak bull strength. Resistance at 1447. Target 1396,1346.
On Valuation it is at fair value of 1438. With 12% returns it has potential to reach 1610 in 1 year time frame.

ICICI BANK – Strong Momentum Breakout | BTST + Swing SetupICICI BANK – Strong Momentum Breakout | BTST + Swing Setup Active
CMP: ₹1,427.10 | Chart: 5-min | Date: June 22, 2025
📌 Observations:
Sharp rally from ₹1,406 to ₹1,434 during the day—18+ point move
Volume surge seen during breakout phase post 2:30 PM – volume spiked from avg to 1.07M+
Price retested breakout zone around ₹1,425 and held—sign of strength & accumulation
Overall structure shows clean higher highs and higher lows formation
📈 Levels to Watch
Support Zones:
₹1,421 – breakout retest zone
₹1,407 – volume base
Resistance / Targets:
₹1,435 – intraday high
₹1,452 – short-term swing target
₹1,470 – 3–4 day potential breakout target
💡 Trade Setup
🔹 BTST / Intraday
📌 Entry: CMP ₹1,427.10 or minor dip to ₹1,424
🎯 Target: ₹1,435–₹1,440
🛑 SL: ₹1,418
🔹 3–4 Day Swing
📌 Entry: Any dip toward ₹1,420
🎯 Target 1: ₹1,452
🎯 Target 2: ₹1,470
🛑 SL: ₹1,407
📊 Indicators Confirming Move:
Volume Surge confirms institutional buying
Clean price structure — ideal for follow-through buying
RSI (not shown) previously cooled from overbought → now in bullish momentum zone
✅ Summary
📈 Price–volume breakout confirmed
🧠 Dip buying opportunity above ₹1,420
⏳ Ideal for intraday + short swing hold
🔔 Watch ₹1,435 zone closely tomorrow — price acceptance = continuation
📅 Review After: 9:50 AM, June 23
📉 Invalidation Below: ₹1,418 (tight) / ₹1,407 (swing)
#ICICIBANK #BTST #SwingTrading #BreakoutStock #Banking #TradingViewIndia #MomentumTrade #VolumeAnalysis #StockMarketIndia

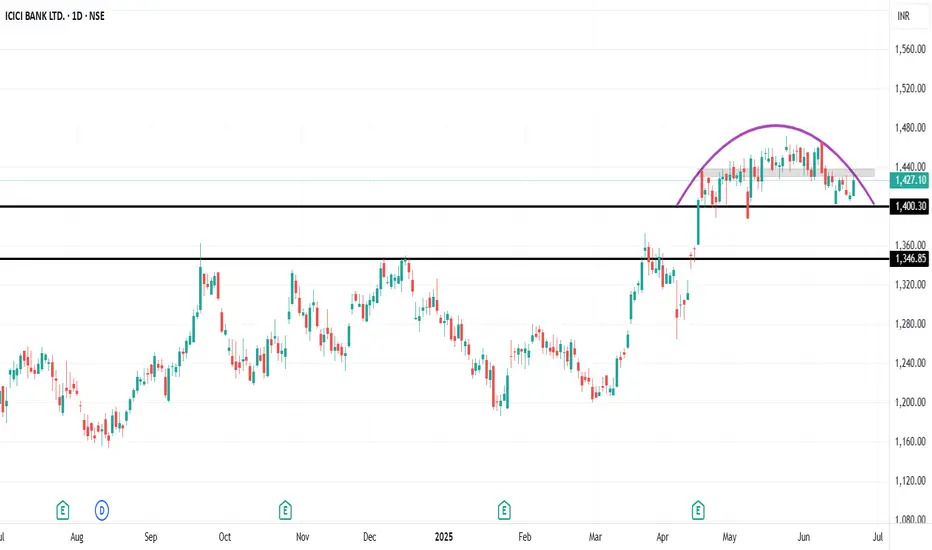
Icici round top patternICICI 1427 is showing round top pattern. If unable to pass through 1440 we shall expect ICICI to break the neck support 1400 and drop to 1326 which could be considered for entry.
On Fy25 EPS of 76.5 it is trading around 19.9 PE where Industrial PE is 13. With an average PE of 18 from 2023, its fair value is at 1300.
ICICIBK (BREAKOUT COMING $OON)he double bottom is a classic bullish reversal pattern in technical analysis. It resembles the letter "W", forming after a downtrend when the price hits a support level twice before breaking out upwards.
Key Features:
- Two distinct lows at roughly the same price level.
- A peak (neckline) between the two lows.
- Breakout confirmation when the price moves above the neckline.
Trading Strategy:
- Entry: Traders often enter a long position once the price breaks above the neckline.
- Stop-loss: Placed below the second bottom to manage risk.
- Target price: Typically measured by the distance between the neckline and the bottoms, projected upwards.
Would you like an example of how this pattern plays out in real market conditions?

ICICI Bank Ltd_Inside Bar Formed on DTFICICI Bank is in a low volatility contraction phase. Watch for a breakout from the inside bar range — the move could be sharp due to the tight setup.
Note :- Above view is only for educational purpose, no any buy or sell recommendations.

ICICI BANK SHORT - AT ANY UPSIDEPrice Rising, Strong Resistance @1464...Continuously unable to cross this level.
Price increasing but RSI showing decline. Negative Divergence on RSI.
Target 1385
Final Target 1350.
ICICI bank is bull or bear?One daily timeframe ICICI Bank clearly formed bull flag pattern, which means upward price movement can see in upcoming days , followed by a period of consolidation.
First resitance can be seen near 1466 followed by some consolidation.
We can plan buy trad with SL 1430.
If price break 1470 then it will create its new high.

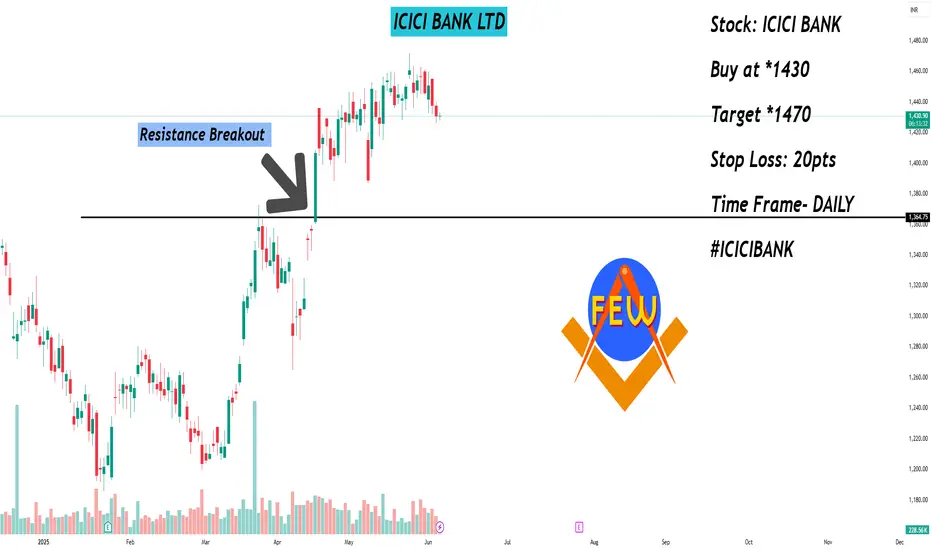
ICICI BANK LTDStocks to Focus on 5th Jun 2025
Stock: ICICI BANK
Buy at *1430
Target *1470
Stop Loss: 20pts
Time Frame- DAILY
#ICICIBANK
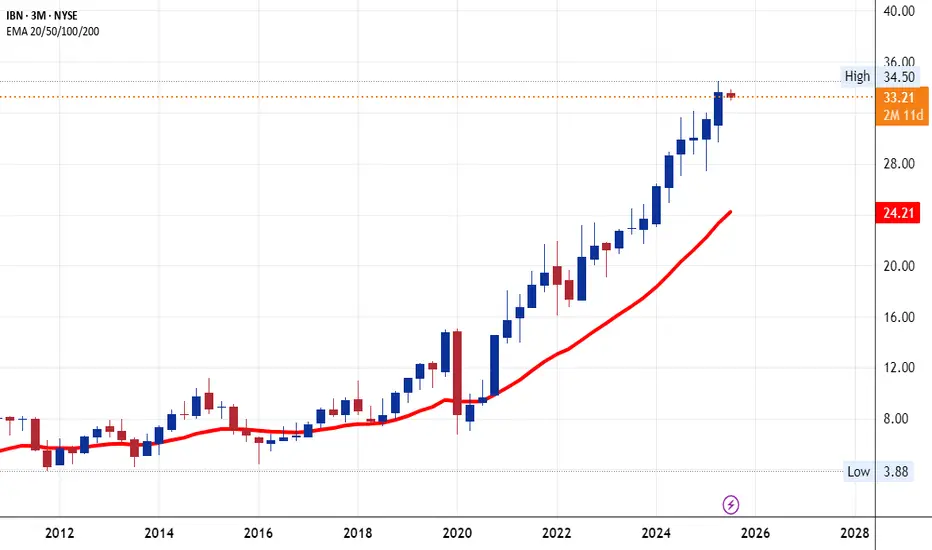
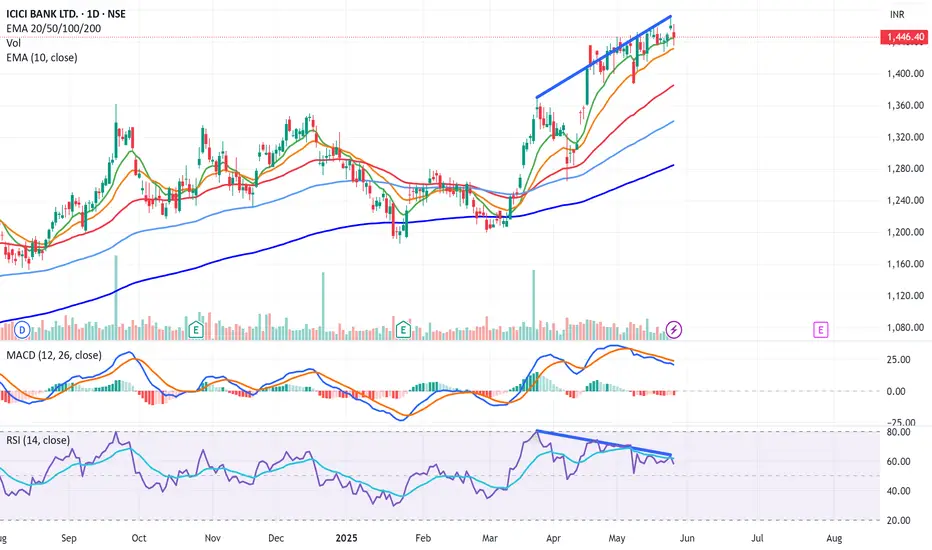
ICICI Bank Powers to Lifetime High Within a Strong Bullish ChannTopic Statement:
ICICI Bank is on a robust bull run, steadily advancing within a strong uptrending channel.
Key Points:
* The stock is moving upwards in a strong bullish uptrending channel, making channel-based trading highly effective
* It is currently trading at its lifetime high, reflecting continued strength and investor optimism
* The price has highly overextended above the 200-day EMA, indicating the stock is highly overbought and may be poised for a cooling-off phase

Technical Class 1Technical analysis is based on the fundamental idea that the price of a security moves in patterns or trends. Another essential assumption is that all fundamental considerations are reflected in the security price, which is a core concept of technical stock research.

Financial MarketsFinancial markets are platforms where individuals, companies, and governments trade financial instruments like stocks, bonds, currencies, and derivatives. These markets facilitate the flow of capital, enabling businesses to raise funds, individuals to invest, and governments to manage their finances.

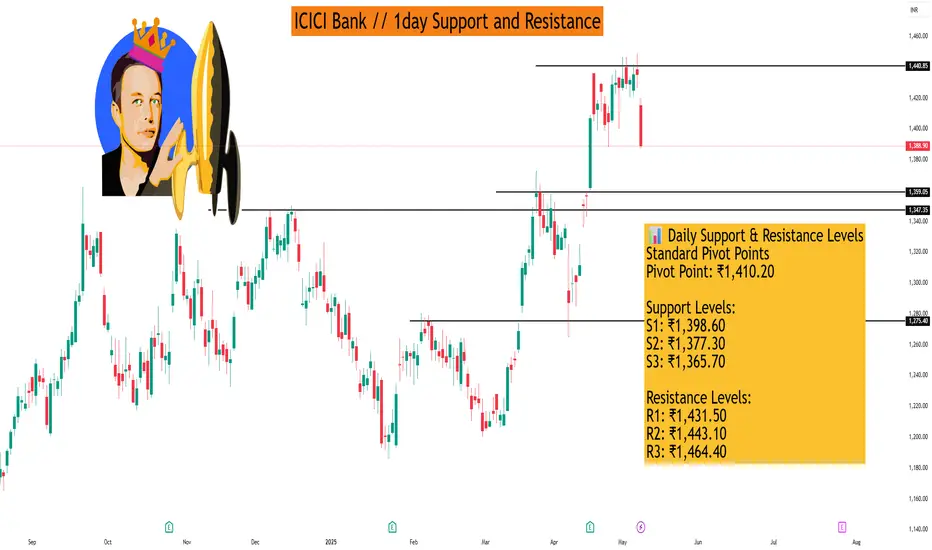
ICICI Bank // 1day Support and ResistanceAs of May 9, 2025, ICICI Bank Ltd. (NSE: ICICIBANK) closed at ₹1,388.90. Here are the key daily support and resistance levels based on various technical analyses:
📊 Daily Support & Resistance Levels
Standard Pivot Points
Pivot Point: ₹1,410.20
Support Levels:
S1: ₹1,398.60
S2: ₹1,377.30
S3: ₹1,365.70
Resistance Levels:
R1: ₹1,431.50
R2: ₹1,443.10
R3: ₹1,464.40
Fibonacci Levels
Pivot Point: ₹1,398.60
Support Levels:
S1: ₹1,386.03
S2: ₹1,378.27
S3: ₹1,365.70
Resistance Levels:
R1: ₹1,411.17
R2: ₹1,418.93
R3: ₹1,431.50
Camarilla Levels
Support Levels:
S1: ₹1,382.87
S2: ₹1,379.85
S3: ₹1,370.81
Resistance Levels:
R1: ₹1,394.93
R2: ₹1,397.95
R3: ₹1,407.00
Woodie's Levels
Pivot Point: ₹1,405.35
Support Levels:
S1: ₹1,396.18
S2: ₹1,372.45
Resistance Levels:
R1: ₹1,429.08
R2: ₹1,438.25
Demark Levels
Support Level:
S1: ₹1,371.50
Resistance Level:
R1: ₹1,404.40
🔍 Observations
The stock is currently trading below the Standard Pivot Point of ₹1,410.20, indicating potential bearish sentiment.
Immediate support is observed around ₹1,398.60 (Standard S1) and ₹1,386.03 (Fibonacci S1).
Resistance levels to watch include ₹1,411.17 (Fibonacci R1) and ₹1,431.50 (Standard R1).
ICICI BANKHello & welcome to this analysis
A bearish Harmonic Crab pattern has been activated in the daily time frame suggesting downside levels till 1350-1300 probable if it starts sustaining below 1390 which is a line of support as of now.
Its made a gap down today, any pullback till the gap area could witness another round of selling.
The pattern negates above 1465
