ICICI Bank-Aiming for Double Bottom Breakout?ICICI Bank – Technical Analysis & Trade Plan
📈 Trend Analysis:
Stock is in a strong uptrend with a higher high, higher low (HH-HL) structure intact.
Consolidating since September 2024, forming a base.
Double bottom formation visible, with a potential VCP (Volatility Contraction Pattern) at play.
Trading above key DMAs, confirming strength.
Sectoral strength: Finance & banking showing momentum and could lead the next market move.
📊 Market Context:
Broader market is showing slight improvement but still in a lower low, lower high (LL-LH) structure.
Index closed above 50 DMA, gaining some momentum, but another round of correction cannot be ruled out.
The main reason for selecting this stock is strong sector movement.
🔍 Trade Plan:
✅ Entry: Above ₹1,328
🚨 Immediate Resistance: ₹1,363
📌 Add more: If ₹1,363 is broken with strong volume
🎯 Positional Target: ₹1,555
❌ Stop Loss (SL - Closing Basis): ₹1,180.45
📉 Risk & Reward Calculation:
Risk (SL to Entry): ₹1,328 - ₹1,180.45 = ₹147.55 (~ 11.11% downside risk)
Reward (Entry to Target): ₹1,555 - ₹1,328 = ₹227 (~ 17.1% upside reward)
Risk-to-Reward Ratio (R:R): 1:1.54 (Moderate reward vs. risk)
⚠️ Risk Considerations:
Overall market still in LL-LH structure → Could just be a pullback within a broader downtrend.
Position Sizing Key:
Consider entering only 30% of the usual position size.
Gradual accumulation near ATH (All-Time High) levels is a wise approach.
📢 Disclaimer: This is not financial advice. Trading involves risk, and past performance does not guarantee future results. Always do your own research and use proper risk management .
Trade ideas

ICICI BANK LTD 15 MIN CHARTAs of May 2, 2025, the 15-minute intraday chart for ICICI Bank Ltd (NSE: ICICIBANK) indicates a bullish trend, with the stock trading at ₹1,250.05, up 0.49% for the day.
📈 Key Technical Levels
Resistance Levels:
R1: ₹1,245.82
R2: ₹1,259.55
R3: ₹1,275.00
Support Levels:
S1: ₹1,230.00
S2: ₹1,215.00
S3: ₹1,200.00
These levels are derived from recent price action and volume analysis, indicating potential breakout points and areas where the stock may find support.
📊 Chart Patterns
A recent Cup and Handle pattern has been observed, with the price breaking out from the handle formation. The measured move suggests a potential target of ₹1,342.35, contingent upon sustained volume and price momentum.
🔍 Market Sentiment
ICICI Bank's stock has shown resilience, with a 1.80% increase over the past week and a 16.05% rise over the past year. Analysts maintain a positive outlook, with price targets ranging from ₹1,290 to ₹1,675.

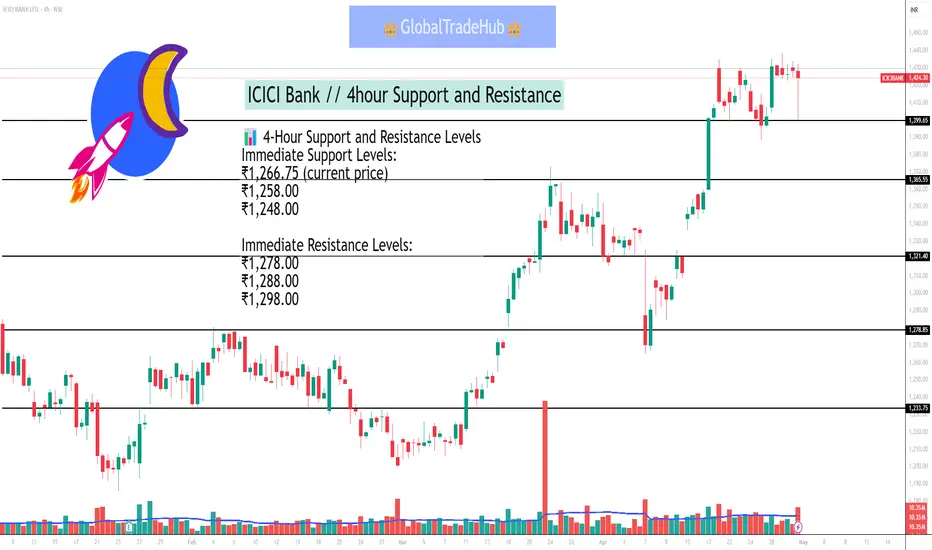
ICICI Bank // 4hour Support and ResistanceAs of May 1, 2025, at 10:08 AM IST, ICICI Bank Ltd (NSE: ICICIBANK) is trading at ₹1,266.75. Based on recent technical analysis, here are the key support and resistance levels for the stock on a 4-hour (4H) chart:
📊 4-Hour Support and Resistance Levels
Immediate Support Levels:
₹1,266.75 (current price)
₹1,258.00
₹1,248.00
Immediate Resistance Levels:
₹1,278.00
₹1,288.00
₹1,298.00
These levels suggest that if the stock price declines below ₹1,266.75, it may find support around ₹1,258.00 and ₹1,248.00. Conversely, if the price rises above ₹1,278.00, it could encounter resistance near ₹1,288.00 and ₹1,298.00.
🔍 Technical Indicators
ADX (Average Directional Index): 17.73 – indicates a weak trend.
RSI (Relative Strength Index): 55.87 – suggests neutral momentum.
MACD (Moving Average Convergence Divergence): 11.45 – indicates a positive trend.
CCI (Commodity Channel Index): 88.61 – suggests the stock is in an uptrend.
These indicators suggest a neutral to slightly bullish outlook for ICICI Bank in the short term.
ICICI Bank Cup and Handle breakout DailyICICI Bank (NSE) Technical Analysis
Pattern Observed:
A Cup and Handle breakout pattern is visible.
The cup formation is well-rounded, and the handle was a shallow correction before the breakout.
Key Levels:
Breakout Zone: ₹1,364 (handle resistance breakout).
Current Price: Around ₹1,428.
Resistance Levels:
₹1,436 (recent high, minor resistance).
Major Target: ₹1,538 based on the measured move of the cup depth.
Support Levels:
₹1,364 (previous breakout zone — now support).
₹1,190 (major historical support).
Volume Confirmation:
Breakout above the handle accompanied by a good surge in volume, confirming the strength of the breakout.
Target Projection:
Height of Cup = ~173 points.
Projected Target = Breakout Point + Height
₹1,364 + 173 ≈ ₹1,538 (matches with your chart).
Strength Indicator:
Strong bullish momentum post-breakout.
Volume increasing on up-days — a healthy sign for continuation.

ICICI Bank (ICICIBANK) BuyCurrent Price: ₹1,030
Trend: Uptrend
Catalyst: ICICI Bank's shares reached an all-time high, with gains of 0.9%, fueled by strong quarterly earnings and a depreciating U.S. dollar, which enhances foreign investment into emerging markets like India.
Reuter
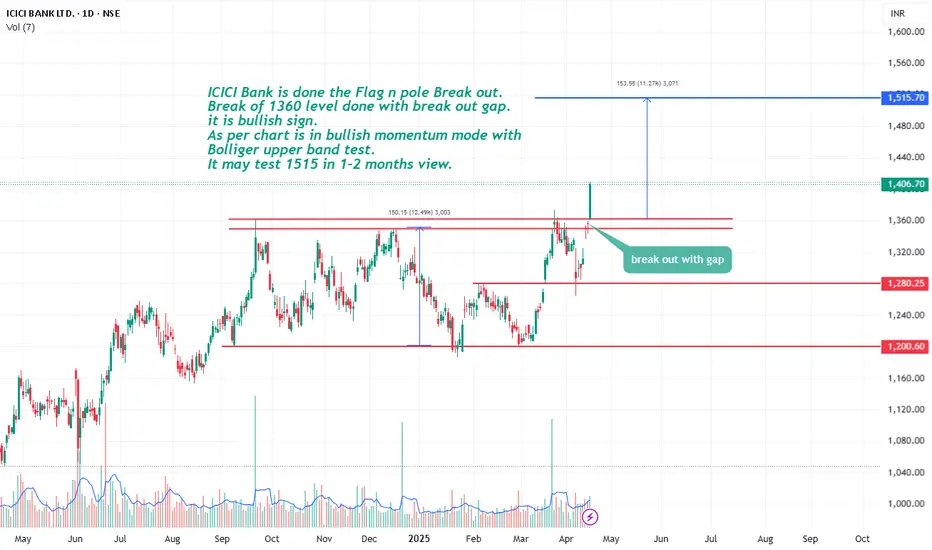
ICICI Bank on flag n pole breakout ICICI Bank is done the Flag n pole Break out. Break of 1360 level done with break out gap.
it is bullish sign. As per chart is in bullish momentum mode with Bolliger upper band test.
It may test 1515 in 1-2 months view.
Icici bank ready for profit booking until today high not break How to take trades using Harmonic pattern projection Trade setup is explained below :-
Entry : 1st SL point : 0% is recent top or bottom.
Trailing D: 11.4% is work as trailing SL of buy or sell trade if hit then we have to book profit
.If price goes below 2nd D 21.4% to 23.6% range then early traders can make fresh reversals trade after breaking 1st D 11.4% safe traders can reversal trade after breaking Point D 21.4% to 23.6% range
Targets :
Target T1 : 35.1% to 38.3%
Target T3 : 49.1% to 53.2%
T3: 60.9% to 64.8% is our 3rd Target since this is reversal zone so must book profit if break then take fresh trade again
Target T4 : 76.4% to 79.7%
Next Targets are 100% , 127.2% ,141.4% and final Target 161.8%.
How to take reversal trade :
If price going upside/ downside then then buy or sell levels appear on Chart ( Automatically show when price reach any reversal zone of harmonic projection pattern based .
After showing reversal levels wait for confirmation until 21.4% or 28.3 % level not break if break then exit from current buy / sell trade and take fresh reverse trade buy/ sell .
Trailing SL:
After reach 1st Target trail SL to just above or below cost ( for example we are holding sell trade from 100 1st Target 110 hit then move trailing sl to 104-105 and move SL as price move upside or Downside)
Re- Entry :
For Re-entry in any pull back Point D ( 11.4% ) is used for re-entry then SL recent high or low Point SL ( 0% ) .
Blue Line is 1st support/ Resistance
Green line is 2nd support/ resistance
Red line is 3rd Support/ resistance

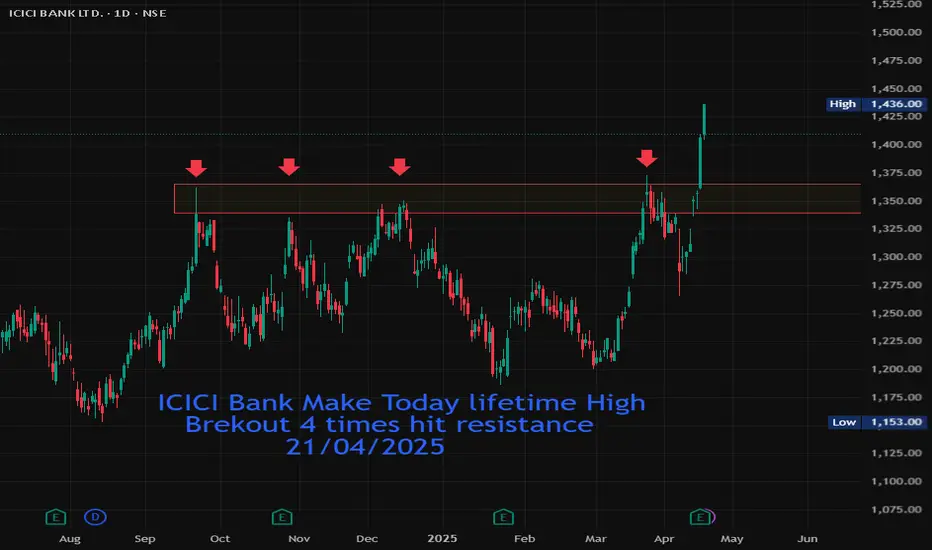
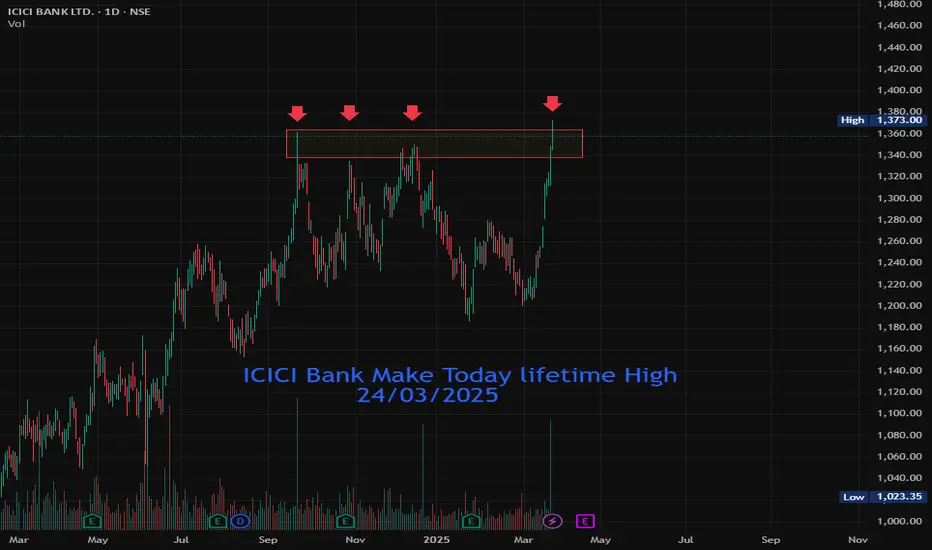
ICICI Bank Make Today lifetime High NSE INDIA , SYMBOL : ICICI Bank TIMEFRAME : DAILY : ICICI Bank first time lifetime high make 1365 on dated 20/09/2024 then 4 times try to breakout this lifetime high but failure touch this level and return down 4 times. 17/04/2025 breakout this level and today ICICI Bank make new High 1435
ICICI BankICICI Bank Overview
ICICI Bank is one of India's largest private sector banks, established in 1994 and headquartered in Mumbai. It offers a comprehensive range of financial services to retail and corporate customers, both in India and internationally.
Key Services
Retail Banking:
Savings/Current Accounts, Fixed Deposits, Loans (Personal, Home, Car), Credit Cards, Wealth Management, and Insurance.
Corporate Banking:
Working Capital, Trade Finance, Treasury Services, and Investment Banking.
Digital Solutions:
iMobile Pay App: Fund transfers, bill payments, investments, and more.
Internet Banking: UPI, instant payments (IMPS/NEFT/RTGS), and digital wallets.
Investments & Insurance:
Mutual Funds, SIPs, and insurance products via subsidiaries like ICICI Prudential.
International Presence
Operates in over 15 countries, including the UAE, UK, USA, Singapore, and Canada, offering NRI services, forex, and global banking solutions.
Customer Support
24/7 Helpline: 1860 120 7777 (India) or +91 22 3366 7777 (overseas).
Branch/ATM Locator: Available on their website or mobile app.
Innovation & Sustainability
Digital Initiatives: Voice-based banking, AI chatbots, and QR-code payments.
Sustainability: Focus on green financing, renewable energy projects, and ESG (Environmental, Social, Governance) compliance.
Stock Market Listing
Listed on BSE (BOM: 532174) and NSE (NSE: ICICIBANK).
How to Open an Account
Online: Visit the website or app, submit KYC documents (Aadhaar, PAN), and complete e-signing.
In-Branch: Visit any ICICI branch with ID proof, address proof, and photographs.
Leadership
CEO: Sandeep Bakhshi (as of 2023).
ICICI Bank is known for its customer-centric approach, technological innovation, and extensive network. For updates, download their app or follow official social media channels.

ICICIBANK RANGE BREAKOUT WEEKLYICICIBank breaking a range weekly basis
with good volume building last few weeks
trading at new ATH,RSI bullish
trading above all key ema
sizzling q4 result
#niftybank trading at ATH
NEAR #target 1470
EDUCATIONAL IDEA

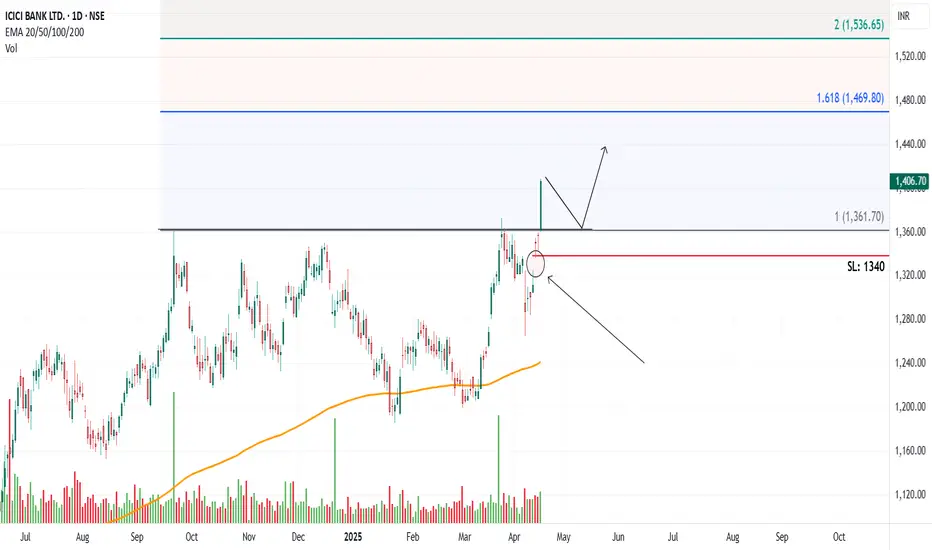
Banks in focus, chart: 3 ICICIChart -> ICICI Daily
All time high breakout with run-away gap.
CMP: 1406
Good Range to Buy: 1360 to 1400
Targets: 1470, 1536
SL: 1340 Daily Close
Disclaimer: This is for educational purposes only, not any recommendations to buy or sell. As I am not SEBI registered, please consult your financial advisor before taking any action.
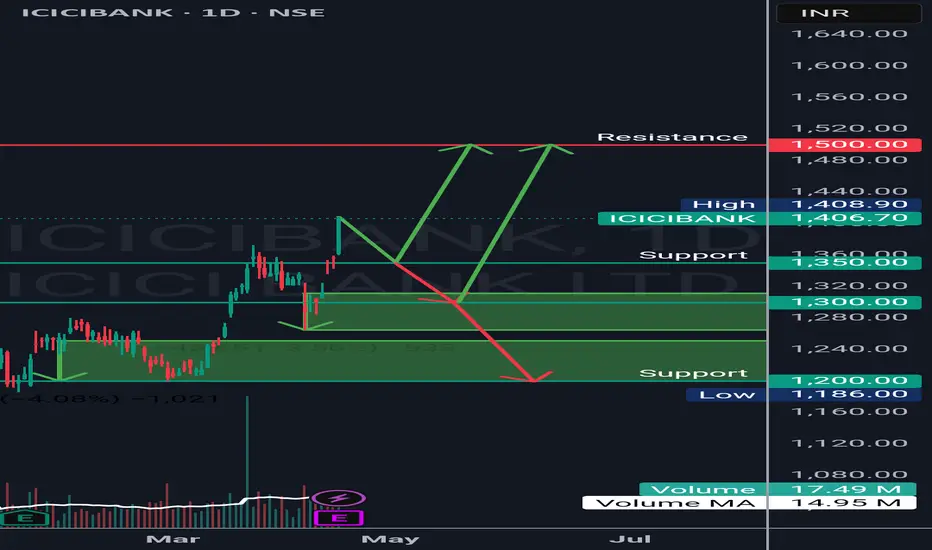
ICICI Bank A New Life Time HighICICI has made a new life time high.
It's now 1406
Its target could be 1500
But who ever wants to enter the rally should wait for it to retrace till 1350 and then check the price action.
If it gives bullish view enter with SL 1300 Target 1400 and Trail till 1500
If it gives bearish view then wait till 1200
ICICI Bank Ltd: Gearing Up for a Breakout📊 Technical Analysis
ICICI Bank has shown a powerful uptrend over the past two decades. The stock has consistently moved higher, forming a steady pattern of higher lows since November 2013, indicating a strong bullish sentiment.
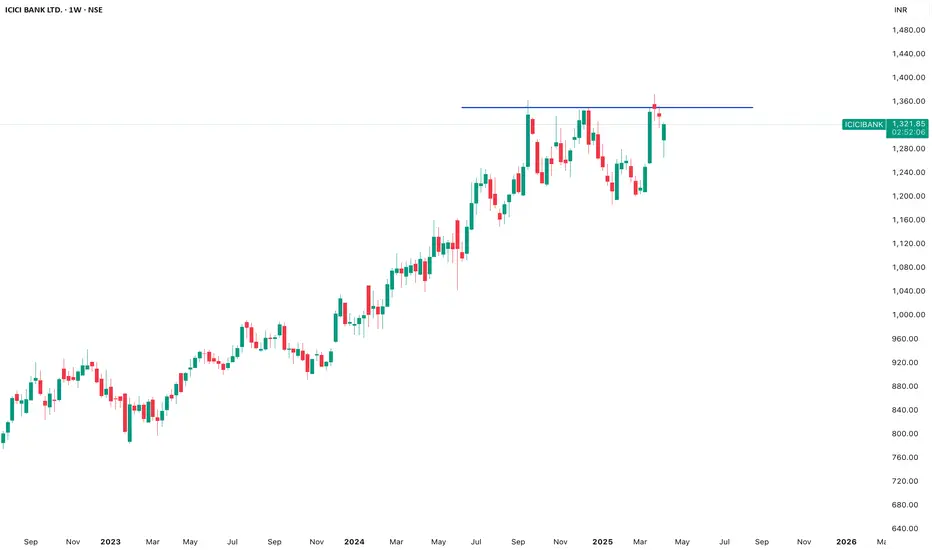
In September 2024, the stock hit an all-time high of ₹1362, which has acted as a strong resistance zone between ₹1363 and ₹1373 for over six months.
As of now, the stock is trading around ₹1354, inching closer to the breakout zone.
Once this all-time high zone is taken out with strength, we can expect a fresh bullish rally toward the levels of:
🎯 ₹1455
🎯 ₹1555
🎯 ₹1675
On the downside, the crucial support zone lies between ₹1185 to ₹1218. As long as this support holds, the stock remains firmly in bullish territory.
The long-term higher lows formation is intact — a strong bullish signal. Only if this breaks, we may consider any reversal.
This setup suggests that the stock is at a crucial juncture, and traders must closely watch for a breakout confirmation above the resistance band.
🧾 Fundamental Highlights (Q3 FY24)
📌 Total Income stood at ₹47,037 Cr — up from ₹40,865 Cr YoY
📌 Total Interest increased to ₹22,633 Cr — from ₹19,409 Cr YoY
📌 Total Expenses rose to ₹33,510 Cr — due to business expansion and provisioning
📌 Other Income was healthy at ₹27,589 Cr — vs ₹18,874 Cr YoY
📌 Total Operating Profits showed a drop to ₹-9106 Cr — impacted by rising costs
📌 Profit Before Tax was at ₹18,483 Cr — up from ₹15,401 Cr YoY
📌 Profit After Tax improved to ₹13,847 Cr — from ₹11,515 Cr YoY
📌 EPS increased to ₹18.25 — vs ₹15.76 in Q3 FY23
🧠 Additional Insights
ICICI Bank maintains a strong position in the private banking sector, showing consistent growth in retail lending, digital banking, and loan book expansion.
The bank's asset quality remains stable, and continued focus on tech-driven banking is helping margin expansion.
📌 Conclusion:
ICICI Bank is currently trading near its breakout zone with strong fundamentals backing the move. With solid earnings growth, resilient performance, and a classic technical breakout setup, the stock looks promising for long-term investors and swing traders alike.
Disclaimer: lnkd.in

ICICI Bank Ltd: Gearing Up for a Breakout📊 Technical Analysis
ICICI Bank has shown a powerful uptrend over the past two decades. The stock has consistently moved higher, forming a steady pattern of higher lows since November 2013, indicating a strong bullish sentiment.
In September 2024, the stock hit an all-time high of ₹1362, which has acted as a strong resistance zone between ₹1363 and ₹1373 for over six months.
As of now, the stock is trading around ₹1354, inching closer to the breakout zone.
Once this all-time high zone is taken out with strength, we can expect a fresh bullish rally toward the levels of:
🎯 ₹1455
🎯 ₹1555
🎯 ₹1675
On the downside, the crucial support zone lies between ₹1185 to ₹1218. As long as this support holds, the stock remains firmly in bullish territory.
The long-term higher lows formation is intact — a strong bullish signal. Only if this breaks, we may consider any reversal.
This setup suggests that the stock is at a crucial juncture, and traders must closely watch for a breakout confirmation above the resistance band.
🧾 Fundamental Highlights (Q3 FY24)
📌 Total Income stood at ₹47,037 Cr — up from ₹40,865 Cr YoY
📌 Total Interest increased to ₹22,633 Cr — from ₹19,409 Cr YoY
📌 Total Expenses rose to ₹33,510 Cr — due to business expansion and provisioning
📌 Other Income was healthy at ₹27,589 Cr — vs ₹18,874 Cr YoY
📌 Total Operating Profits showed a drop to ₹-9106 Cr — impacted by rising costs
📌 Profit Before Tax was at ₹18,483 Cr — up from ₹15,401 Cr YoY
📌 Profit After Tax improved to ₹13,847 Cr — from ₹11,515 Cr YoY
📌 EPS increased to ₹18.25 — vs ₹15.76 in Q3 FY23
🧠 Additional Insights
ICICI Bank maintains a strong position in the private banking sector, showing consistent growth in retail lending, digital banking, and loan book expansion.
The bank's asset quality remains stable, and continued focus on tech-driven banking is helping margin expansion.
📌 Conclusion:
ICICI Bank is currently trading near its breakout zone with strong fundamentals backing the move. With solid earnings growth, resilient performance, and a classic technical breakout setup, the stock looks promising for long-term investors and swing traders alike. 🚀
Disclaimer: This analysis is for informational purposes only and does not constitute financial advice. Investors should conduct their own research or consult with a financial advisor before making investment decisions.

### ICICI Bank Price Analysis (April 11, 2025)### ICICI Bank Price Analysis (April 11, 2025)
#### **Current Price and Recent Trends**
- **Latest Price (April 8, 2025):** ₹1,299.90
- **Intraday Movement (April 8, 2025):**
- **Open:** ₹1,299.85
- **High:** ₹1,310.05
- **Low:** ₹1,287.35
- **Close:** ₹1,299.90 (+0.96% from the previous close).
- **52-Week Range:** ₹1,186.00 – ₹1,373.00
#### **Performance Metrics**
- **Short-Term Trends:**
- April 7, 2025: Declined by -3.58% to ₹1,287.55.
- April 4, 2025: Rose by +0.43% to ₹1,335.30.
- **Medium-Term Trends:**
- March saw fluctuations between ₹1,311 and ₹1,373.
- **Long-Term Trends:**
- ICICI Bank has shown consistent growth over the past year, supported by strong fundamentals.
#### **Fundamental Insights**
- ICICI Bank remains one of the top-performing private sector banks in India:
- **Market Cap:** Over ₹9 lakh crore.
- **P/E Ratio:** Competitive compared to peers in the banking sector.
- **Strong Asset Quality:** Stable NPA ratios and robust loan growth.
#### **Technical Analysis**
- **Support Levels:** ₹1,287 (recent low) and ₹1,265 (strong support from April trends).
- **Resistance Levels:** ₹1,310–₹1,320 (near-term resistance).
- **Moving Averages:**
- Trading slightly below the SMA20 but above SMA50 indicates potential consolidation before further movement.
- **Momentum Indicators:**
- RSI suggests neutral momentum with room for upward movement if market sentiment improves.
#### **Sector Outlook**
The banking sector is expected to benefit from:
- Increased credit growth due to economic recovery.
- Stable interest rate environment supporting profitability.
#### **Strengths**
1. Consistent performance despite market volatility.
2. Strong fundamentals with diversified revenue streams.
3. Resilient asset quality and loan book growth.
#### **Weaknesses**
1. Short-term volatility due to global banking uncertainties.
2. Resistance near ₹1,310 may limit upside in the immediate term.
### Conclusion:
ICICI Bank remains a strong long-term investment option due to its robust fundamentals and leadership in the private banking space. However, short-term traders should monitor resistance levels around ₹1,310 and support near ₹1,287 for trading opportunities.
Amazing breakout on WEEKLY Timeframe - ICICIBANKCheckout an amazing breakout happened in the stock in Weekly timeframe, macroscopically seen in Daily timeframe. Having a great favor that the stock might be bullish expecting a staggering returns of minimum 25% TGT. IMPORTANT BREAKOUT LEVELS ARE ALWAYS RESPECTED!
NOTE for learners: Place the breakout levels as per the chart shared and track it yourself to get amazed!!
#No complicated chart patterns
#No big big indicators
#No Excel sheet or number magics
TRADE IDEA: WAIT FOR THE STOCK TO BREAKOUT IN WEEKLY TIMEFRAME ABOVE THIS LEVEL.
Checkout an amazing breakout happened in the stock in Weekly timeframe.
Breakouts happening in longer timeframe is way more powerful than the breakouts seen in Daily timeframe. You can blindly invest once the weekly candle closes above the breakout line and stay invested forever. Also these stocks breakouts are lifelong predictions, it means technically these breakouts happen giving more returns in the longer runs. Hence, even when the scrip makes a loss of 10% / 20% / 30% / 50%, the stock will regain and turn around. Once they again enter the same breakout level, they will flyyyyyyyyyyyy like a ROCKET if held in the portfolio in the longer run.
Time makes money, GREEDY & EGO will not make money.
Also, magically these breakouts tend to prove that the companies turn around and fundamentally becoming strong. Also the magic happens when more diversification is done in various sectors under various scripts with equal money invested in each N500 scripts.
The real deal is when to purchase and where to purchase the stock. That is where Breakout study comes into play.
LET'S PUMP IN SOME MONEY AND REVOLUTIONIZE THE NATION'S ECONOMY!
icici bank analysisicici bank analysis
ICICI Bank's share price is currently around ₹1,362.90, with a 52-week range between ₹1,048.10 and ₹1,373.00.
The bank has a market capitalization of ₹9,61,528 crore, a P/E ratio of 19.54, and a return on equity (ROE) of 19.47%

Another heavy weight about to correctICICI Bank CMP 1343
Elliott- the rally is corrective in nature and in my view is complete. Hence a three wave correction should start from here.
Trendline- break of the trendline and retest from below is negative.
RSI - the stock has reached its previous highs where the oscillator has reached its bear zone. This is a negative sign.
Conclusion - I posted how the rally in HDFC bank should not be relied upon. The next highest weightage in Nifty is that of ICICI Bank. This stock is also about to get into correction. Hence my take on another round of correction on Nifty is a high probability.

TWO POSSIBILITIES IN ICICI BANKI could think of 2 Possibilities in ICICI Bank. Its still in complex correction
1) The last wave (Wave C) of the W-X-Y correction could be a triangle in which case we will see 3 more waves
OR
2) It could be an Expanded/Regular flat. In this case only wave C has to be completed.
In either case the correction is still on-going and its not yet done.
Disclaimer: I am not SEBI registered member and this idea is meant only for educational purposes

ICICI Bank Make Today lifetime High 24/03/2025NSE INDIA, Symbol : ICICI Bank Timeframe : Daily. ICICI Bank 23/09/2024 Make top 1364 lifetime High the return down. Next time 30/10/2024 and 16/12/2024 try to break out but failure and return down. Today ICICI Bank try to break out this zone go up but close return this zone. Today ICICI Bank make new Life time High 1372.If tomorrow gap up open then without resistance ICICI Bank bull run continue and new Breakout . If tomorrow flat open then profit booking recommended.
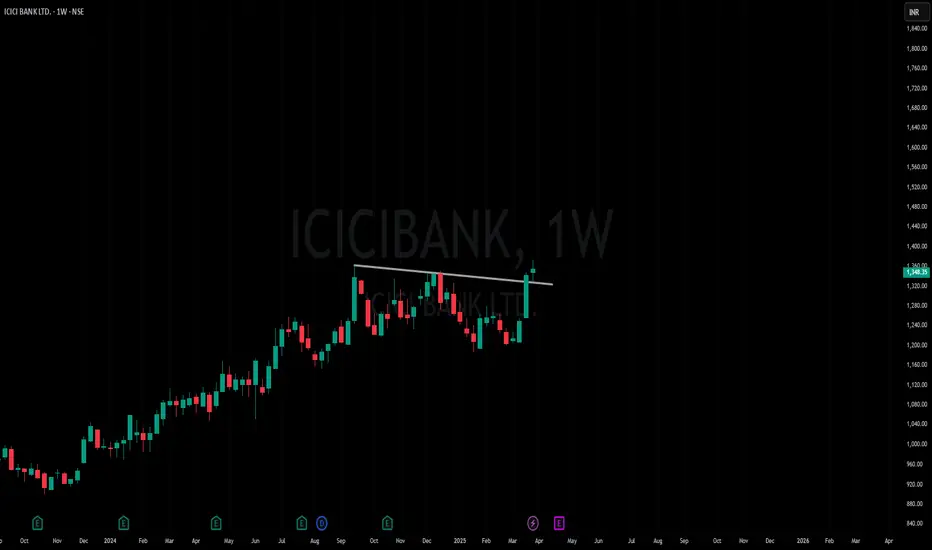
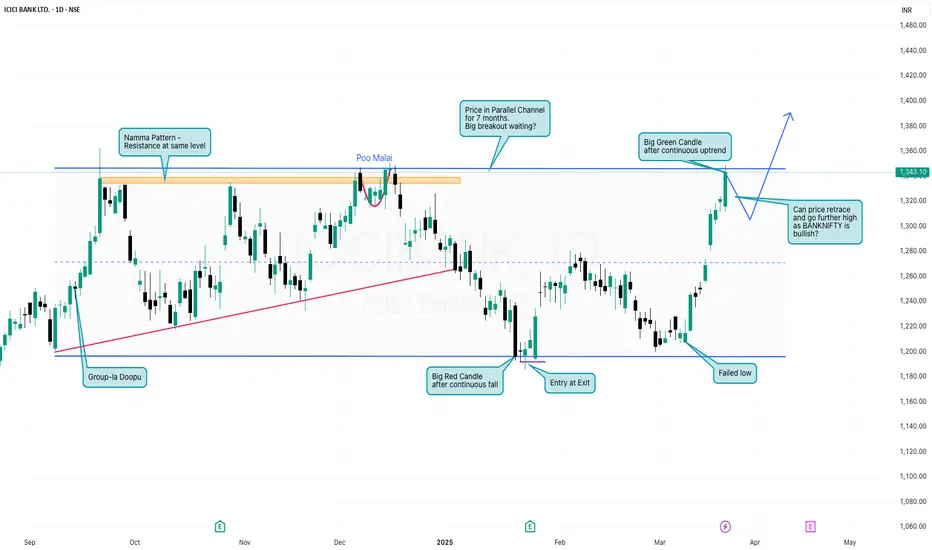
ICICIBANK - Daily TF AnalysisSo much of insights while analysing ICICIBANK in daily timeframe. The stock has been in the parallel channel for 7 months and provided multiple opportunities for trade. Now what's next?
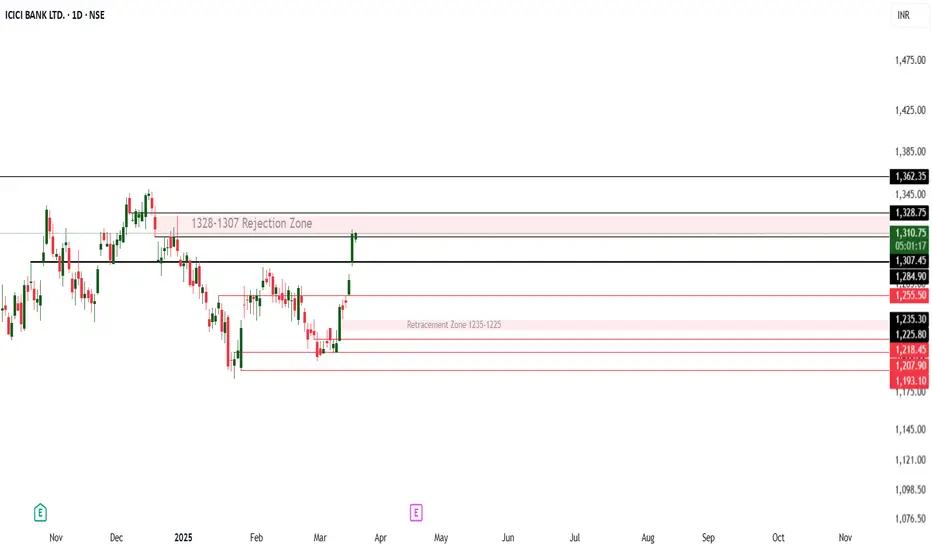
ICICI Bank – Key Levels & Potential ScenariosRetracement Entry: 1235–1225
Look for a pullback into the 1235–1225 zone to initiate fresh longs.
Upside Target: 1284
Stop-Loss: Below 1225 (adjust according to your risk preference).
Breakout Scenario
Key Resistance: 1290 (daily close basis).
If price closes above 1290, expect a bullish continuation toward 1316–1334.
If it breaks above 1290 without retracing to 1235–1225, revise the bullish target to the same 1316–1334 zone.
Potential Reversal
Watch for selling pressure near 1334. If the market rejects this level, a pullback to 1300 could be on the cards.
Bearish Scenario (Counter-Trend)
Failure at 1290–1300 Zone
If the price fails to sustain above 1290 (or forms a bearish reversal pattern near 1284–1290), it could trigger a counter-trend pullback.
Potential Short Entry: Around 1284–1290, with stops placed just above the recent swing high (e.g., above 1290–1295). Initial Targets: 1250, then 1235–1225 (the previously noted retracement zone).
Disclaimer: This analysis is for educational purposes only and not financial advice. Trading involves risk, and past performance doesn’t guarantee future results. Do your own research and consult a financial advisor before making any decisions. The author is not responsible for any losses. Trade at your own risk.
what is RSI and how to use it ?# **What is RSI and How to Use It?**
The **Relative Strength Index (RSI)** is a momentum indicator that measures the **speed and change of price movements**, helping traders identify **overbought and oversold conditions**.
## **1️⃣ RSI Levels & Interpretation**
✅ **Above 70:** Overbought → Possible **reversal or correction**.
✅ **Below 30:** Oversold → Possible **bounce or trend reversal**.
✅ **50 Level:** Midpoint indicating trend strength (above 50 = bullish, below 50 = bearish).
## **2️⃣ How to Use RSI in Trading**
✅ **Overbought & Oversold Trading:** Look for reversals near **70 or 30**.
✅ **Divergence Trading:**
🔹 **Bullish Divergence:** Price ↓, RSI ↑ → **Buy signal**.
🔹 **Bearish Divergence:** Price ↑, RSI ↓ → **Sell signal**.
✅ **RSI Trend Confirmation:** Use with **support-resistance and moving averages** for accuracy.
### **Conclusion**
RSI helps traders **spot trend reversals, confirm momentum, and refine trade entries**, making it a valuable tool for market analysis. 🚀
