ICICIBANK The stock is trading near the support zone of its uptrend, indicating a favorable risk-reward ratio for the upcoming sessions.
Trade ideas

ICICI BANK HEAD AND SHOULDER & DOUBLE TOPretesting shoulder level in weekly chart.
incase this shoulder or support level breaks, fall may continue.
This analysis is my own idea.
I don't recommend taking trade based on this idea.
consult your SEBI registered adviser to Know the market risk before.
in.tradingview.com

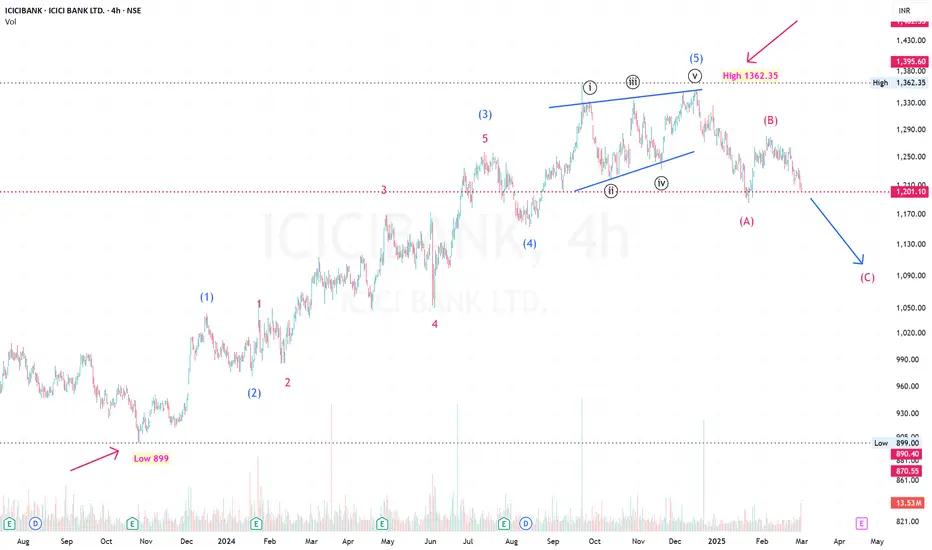
ICICI Bank forming a Potential Wave CICICI Bank began gaining momentum after its Q2 earnings for FY 23-24 in October 2023, starting from a low of Rs. 899. Over the past year, it completed an impulse wave, culminating in the 5th wave as an ending diagonal on December 17, 2024, with a high price of Rs. 1362.35, marking a rally of nearly 463 points.
Following this, ICICI Bank entered an ABC correction phase. It completed Wave A on January 23, 2025 (37 days), with a low of Rs. 1186.00, a decline of approximately 176 points. Wave B formed on February 4, 2025 (12 days), reaching a high of Rs. 1280.50, which is almost 50% of Wave A, a typical Elliott wave correction.
Currently, ICICI Bank is in the process of forming Wave C and could potentially see a low of Rs. 1100.00, targeting at least 176 points before its earnings update on April 21, 2025.
ICICI hold 1 to 6 month **📢 ICICI BANK Trade Setup - Key Levels to Watch! 🚀**
📊 **Stock:** ICICI BANK (NSE)
🕒 **Timeframe:** 1D Chart
📉 **Pattern:** Cypher Pattern
🔹 **Current Price:** **₹1,224.15**
🔹 **Retest Range:** **₹1,231.35** 🔴
🔹 **Breaking Range:** **₹1,186.60 / ₹1,273.20** 🔵
🎯 **Bullish Targets:**
✅ **₹1,360.20**
✅ **₹1,466.95**
🔻 **Bearish Breakdown Levels:**
🚨 **Strong Selling Below ₹1,186.60**
🚨 **Target ₹1,120 & ₹1,000**
💡 **Key Insights:**
✔️ **Breakout above ₹1,273.20** can trigger a strong bullish move 📈
✔️ **Failure to hold ₹1,186.60** could push the price lower 📉
✔️ **Retest zone at ₹1,231.35 - Important resistance!** 🔍
⚠️ **Disclaimer:** This analysis is for **educational purposes only** and not financial advice. Trade wisely! 📊

ICICI **📢 ICICI BANK Trade Setup - Key Levels to Watch! 🚀**
📊 **Stock:** ICICI BANK (NSE)
🕒 **Timeframe:** 1H Chart
📉 **Pattern:** Harmonic Pattern
🔹 **Current Price:** **₹1,226.00**
🔹 **Strong Accumulate Zone:** **₹1,233.75 - ₹1,244.95** 🔵
🎯 **Bullish Targets:**
✅ **₹1,264.15**
✅ **₹1,280.50**
🔻 **Bearish Breakdown Levels:**
🚨 **Selling Target 1:** **₹1,211.70**
🚨 **Selling Target 2:** **₹1,178.15**
💡 **Key Insights:**
✔️ **Breakout above ₹1,244.95** can trigger a strong bullish move 📈
✔️ **Failure to hold above ₹1,211.70** could push the price lower 📉
✔️ Important decision zone for traders! 🔍
⚠️ **Disclaimer:** This analysis is for **educational purposes only** and not financial advice. Trade wisely! 📊
#ICICIBank #StockMarket #NSE #TechnicalAnalysis #Trading #HarmonicPatterns #PriceAction #InvestWisely

Database trading part 2# **Database Trading – Part 2: Data Collection & Analysis for Profitable Trading**
In **Part 1** of this series, we introduced the concept of **Database Trading**, where traders use structured market data to improve decision-making and strategy development. Now, in **Part 2**, we will explore **how to collect, organize, and analyze market data** for effective trading strategies.
---
## **1️⃣ Why is Data Collection Important in Trading?**
📌 **Definition:**
Data collection is the process of gathering **historical and real-time market data** to identify trading patterns, trends, and profitable setups.
📌 **Why is it Important?**
✅ **Removes Guesswork** – Traders rely on data-driven decisions instead of emotions.
✅ **Identifies Market Patterns** – Historical data helps detect **high-probability setups**.
✅ **Backtests Strategies** – Validates whether a strategy works before using real money.
✅ **Enhances Risk Management** – Understanding past behavior improves stop-loss & position sizing.
📌 **Example:**
A trader analyzing **5 years of Nifty 50 data** can find **the most profitable days for intraday trading** and avoid low-volatility periods.
---
## **2️⃣ Types of Data Required for Database Trading**
To build a strong database for trading, you need different types of data:
### **🔹 1. Market Data (Price & Volume Data)**
✅ **OHLC Data (Open, High, Low, Close)** – Used for price action analysis.
✅ **Volume Data** – Confirms trend strength and breakouts.
✅ **Tick-by-Tick Data** – Useful for HFT (High-Frequency Trading).
✅ **Historical Data** – Past price movements for backtesting strategies.
📌 **Example:**
If **Nifty 50 breaks resistance with high volume**, it’s a **strong bullish signal**.
---
### **🔹 2. Derivatives Data (Futures & Options Data)**
✅ **Open Interest (OI)** – Shows how many contracts are open, indicating strength of a trend.
✅ **Put-Call Ratio (PCR)** – Helps identify market sentiment (bullish or bearish).
✅ **Implied Volatility (IV)** – Measures expected market movement.
📌 **Example:**
If **PCR is above 1.5**, it indicates that there are more put options than calls, signaling **bearish sentiment**.
---
### **🔹 3. Fundamental & Macro Data**
✅ **Company Financials** – Earnings, revenue, debt, etc., for stock selection.
✅ **Economic Indicators** – Inflation, GDP, interest rates affect market trends.
✅ **News & Events** – FOMC meetings, RBI policy, geopolitical events impact volatility.
📌 **Example:**
A **high CPI inflation report** may lead to **interest rate hikes**, affecting stock market movements.
---
### **🔹 4. Sentiment Data (Social Media & News Analytics)**
✅ **Twitter, Reddit, Financial News Sentiment Analysis**
✅ **Earnings Call Transcripts & Institutional Reports**
📌 **Example:**
A sudden spike in **negative sentiment about a company** can indicate a potential **sell-off** before it reflects in the charts.
---
## **3️⃣ How to Collect Market Data for Database Trading?**
### **🔹 1. Free Sources for Market Data**
✅ **Yahoo Finance** – Historical & real-time data for stocks, indices, and forex.
✅ **TradingView** – Provides technical indicators and live price data.
✅ **NSE/BSE Website** – Option chain data, open interest, and stock market reports.
📌 **Example:**
A trader downloads **5 years of Nifty 50 historical data** from Yahoo Finance to analyze past market trends.
---
### **🔹 2. API-Based Data Collection**
For real-time data analysis, traders use APIs:
✅ **Alpha Vantage** – Free API for stock & forex market data.
✅ **Binance API** – For crypto market data.
✅ **NSE/BSE API** – Option chain & futures market data.
📌 **Example:**
A Python script using **Alpha Vantage API** can fetch **daily stock prices** and store them in a database for analysis.
---
### **🔹 3. Web Scraping for Sentiment Analysis**
✅ **BeautifulSoup & Selenium (Python)** – Extracts news headlines, social media sentiment, and stock discussions.
✅ **Google Trends** – Measures search interest in stocks & crypto.
📌 **Example:**
If **Google Trends shows increased searches for "buy Bitcoin,"** it indicates growing retail interest.
---
## **4️⃣ Organizing Market Data for Efficient Trading**
Once data is collected, it must be **structured** properly for analysis:
### **🔹 1. Storing Data in a Database**
✅ **SQL Databases (PostgreSQL, MySQL)** – Used for structured historical market data.
✅ **NoSQL Databases (MongoDB, Firebase)** – Best for unstructured sentiment data.
✅ **CSV & Excel Files** – Suitable for small-scale traders.
📌 **Example:**
A trader stores **5 years of Nifty 50 OHLC data** in a **PostgreSQL database** for backtesting.
---
### **🔹 2. Cleaning & Formatting Data**
Before analysis, remove errors & format data:
✅ **Remove Duplicates & Missing Values**
✅ **Adjust for Corporate Actions (Splits, Dividends)**
✅ **Normalize Data (Scaling & Standardization)**
📌 **Example:**
A stock split from ₹1000 to ₹500 should be **adjusted in the historical data** to maintain consistency.
---
## **5️⃣ Analyzing Data for High-Probability Trading Setups**
### **🔹 1. Identifying Trends & Patterns**
Use statistical tools to find repeating patterns:
✅ **Moving Averages (SMA, EMA)** – Identify trend direction.
✅ **Bollinger Bands** – Detect volatility expansion.
✅ **RSI & MACD** – Measure momentum shifts.
📌 **Example:**
If **Nifty’s 50-day EMA is above the 200-day EMA**, it signals a **bullish trend**.
---
### **🔹 2. Statistical Models for Market Analysis**
✅ **Mean Reversion Models** – Stocks tend to return to their average price.
✅ **Time Series Forecasting (ARIMA, LSTM)** – Predicts future prices based on past trends.
📌 **Example:**
A **mean reversion strategy** might suggest **buying Nifty when RSI < 30** and selling when RSI > 70.
---
### **🔹 3. Correlation & Market Sentiment Analysis**
✅ **Sector Correlation** – Stocks in the same sector often move together.
✅ **Sentiment Scores** – AI-based sentiment analysis for stocks & crypto.
📌 **Example:**
If **Crude Oil prices rise**, it may indicate a **bullish trend in energy stocks**.
---
## **6️⃣ Case Study: Using Database Trading for Nifty 50**
A trader collects **5 years of Nifty 50 data**, stores it in SQL, and analyzes it using Python. The strategy:
✅ **Entry:** Buy when Nifty 50 RSI < 30 (oversold).
✅ **Exit:** Sell when Nifty 50 RSI > 70 (overbought).
✅ **Result:** Backtesting shows a **65% win rate** with a 1:2 risk-reward ratio.
---
## **7️⃣ Conclusion & Next Steps**
✅ **Data collection is the foundation of database trading.**
✅ **Structured & clean data helps identify high-probability trades.**
✅ **API integration & web scraping provide real-time market insights.**
.

What is support and resistance ?**SkyTradingZone** is your go-to source for educational content on trading, covering market insights, strategies, and in-depth analysis. Our goal is to empower traders with knowledge to navigate the markets effectively.
---
# **What is Support and Resistance?**
## **1️⃣ Introduction to Support and Resistance**
Support and resistance are fundamental concepts in **technical analysis** that help traders identify **key levels** where price movement is likely to react.
📌 **Support**: A price level where demand is strong enough to prevent the price from falling further.
📌 **Resistance**: A price level where selling pressure is strong enough to prevent the price from rising further.
These levels act as **barriers** where the price tends to **reverse or consolidate** before making the next move.
---
## **2️⃣ Understanding Support**
**Support is a level where the price tends to stop falling and bounce back up.**
- It forms when buyers **step in** to absorb selling pressure.
- It is often seen at previous **lows**, trendlines, moving averages, or Fibonacci retracement levels.
- If a support level is broken, it can turn into **new resistance**.
📌 **Example:** If Nifty 50 repeatedly bounces from **18,000**, that level is acting as **support**.
### **How to Identify Strong Support?**
✅ **Multiple Touch Points** – The more times a level is tested, the stronger the support.
✅ **Volume Confirmation** – High buying volume at support confirms strength.
✅ **Psychological Numbers** – Round numbers like **18,000, 20,000** often act as support.
---
## **3️⃣ Understanding Resistance**
**Resistance is a level where the price tends to stop rising and reverse downward.**
- It forms when sellers enter the market, creating downward pressure.
- It can be found at previous **highs**, trendlines, or moving averages.
- If a resistance level is broken, it can turn into **new support**.
📌 **Example:** If Bank Nifty struggles to break above **45,000**, that level is acting as **resistance**.
### **How to Identify Strong Resistance?**
✅ **Multiple Rejections** – The more times price fails to break above, the stronger the resistance.
✅ **Volume Confirmation** – High selling volume confirms strong resistance.
✅ **Fibonacci Retracement Levels** – Key levels like **61.8% retracement** act as resistance.
---
## **4️⃣ Types of Support & Resistance**
### 🔹 **1. Horizontal Support & Resistance**
These are fixed price levels where past **highs and lows** act as barriers.
✅ **Example:**
- If **Nifty 50 finds support at 17,800** multiple times, that is **horizontal support**.
- If **Reliance struggles to break 2,700**, that is **horizontal resistance**.
---
### 🔹 **2. Trendline Support & Resistance**
These are **diagonal levels** drawn by connecting price **highs or lows** in a trend.
✅ **Example:**
- An **ascending trendline** acts as **support** in an uptrend.
- A **descending trendline** acts as **resistance** in a downtrend.
---
### 🔹 **3. Moving Average Support & Resistance**
Moving averages like **50 EMA, 200 EMA** act as **dynamic** support/resistance.
✅ **Example:**
- If **Nifty bounces from the 200 EMA**, that is **MA support**.
- If **price gets rejected at the 50 EMA**, that is **MA resistance**.
---
### 🔹 **4. Fibonacci Support & Resistance**
Fibonacci retracement levels like **61.8% and 38.2%** act as natural support/resistance zones.
✅ **Example:**
- If **price retraces to 61.8% and bounces**, that is **Fibonacci support**.
- If **price faces rejection at 38.2%**, that is **Fibonacci resistance**.
---
## **5️⃣ How to Use Support & Resistance in Trading?**
### 🔹 **1. Trading the Bounce (Reversal Strategy)**
✅ **Buy at Support** → Look for bullish reversal signals.
✅ **Sell at Resistance** → Look for bearish reversal signals.
📌 **Example:**
- If **Nifty forms a bullish engulfing candle at support**, enter a **buy trade**.
- If **Bank Nifty forms a shooting star at resistance**, enter a **sell trade**.
---
### 🔹 **2. Breakout Trading Strategy**
✅ **Breakout Above Resistance** → Signals bullish momentum.
✅ **Breakdown Below Support** → Signals bearish momentum.
📌 **Example:**
- If **Reliance breaks above ₹2,700 with high volume**, enter a **buy trade**.
- If **Nifty breaks below 18,000**, enter a **short trade**.
📌 **Tip:** Always wait for **retest confirmation** before entering.
---
### 🔹 **3. Support & Resistance with Indicators**
📌 **RSI + Support** → If RSI is **oversold** at support, strong buy signal.
📌 **MACD + Resistance** → If MACD shows bearish divergence at resistance, sell signal.
---
## **6️⃣ Live Example: Support & Resistance in Nifty 50**
| **Date** | **Price Level** | **Support/Resistance?** | **Trade Setup** |
|---------|--------------|------------------|---------------|
| Feb 10 | 17,800 | Strong Support | Buy Signal |
| Feb 12 | 18,200 | Resistance | Sell Signal |
| Feb 15 | 18,000 | Support Retest | Buy Signal |
📌 **Observation:**
- **Buying near support** (17,800) gave a profitable long trade.
- **Selling near resistance** (18,200) gave a good short trade.
---
## **7️⃣ Mistakes to Avoid in Support & Resistance Trading**
⚠️ **Ignoring Volume** – Confirm breakouts with high volume.
⚠️ **Trading False Breakouts** – Always wait for **retest confirmation**.
⚠️ **Forgetting Stop Loss** – Always set SL below support or above resistance.
---
## **Conclusion**
Support and resistance are **key trading concepts** used to find **high-probability trades**. By combining these levels with **candlestick patterns, indicators, and trendlines**, traders can improve their accuracy.
In future lessons, we will cover:
✅ **How to Draw Perfect Support & Resistance Levels**
✅ **Advanced Trading Strategies Using S&R**
✅ **Live Chart Analysis of Support & Resistance**
Stay tuned for more insights!
---
🔹 **Disclaimer**: This content is for educational purposes only. *SkyTradingZone* is not SEBI registered, and we do not provide financial or investment advice. Please conduct your own research before making any trading decisions.

Best Mutual Funds and SIPs for 2025Best Mutual Funds and SIPs for 2025
Mutual funds and Systematic Investment Plans (SIPs) are popular investment options for both new and experienced investors. With 2025 on the horizon, selecting the right funds is crucial for maximizing returns and managing risk effectively.
Top Performing Mutual Funds for 2025
Large-Cap Funds: Suitable for stable growth with moderate risk.
Example: HDFC Top 100 Fund
Example: ICICI Prudential Bluechip Fund
Mid-Cap Funds: Higher growth potential but with increased volatility.
Example: Axis Midcap Fund
Example: Nippon India Growth Fund
Small-Cap Funds: High-risk, high-reward investments.
Example: SBI Small Cap Fund
Example: Kotak Small Cap Fund
Debt Funds: Low-risk option for stable returns.
Example: ICICI Prudential Corporate Bond Fund
Hybrid Funds: Balance of equity and debt.
Example: HDFC Balanced Advantage Fund
Why Choose SIPs?
Disciplined Investing: Encourages regular savings.
Rupee Cost Averaging: Reduces the impact of market volatility.
Compounding Benefits: Helps grow wealth over time.
Conclusion
Investing in the right mutual funds and SIPs in 2025 can provide stable growth and financial security. Always diversify your portfolio and consult financial experts before investing.
Disclaimer: SkyTradingZone provides educational content only and does not offer financial or investment advice. We are not SEBI registered.

how to ride big bullish trends in market ?Riding big bullish trends in the market requires a combination of skill, strategy, and discipline. Here are several steps and strategies that traders and investors commonly use to take advantage of strong upward trends:
### 1. **Identify the Bullish Trend Early**
- **Trend Indicators:** Use tools like moving averages (e.g., 50-day, 200-day) to confirm the trend. When the price is above a moving average, it's often a sign that the market is in a bullish phase.
- **Volume Analysis:** Look for increasing volume as prices rise. A strong uptrend is often confirmed with higher trading volume.
- **Support & Resistance:** Identify key support levels where the price bounces higher and resistance levels where the price breaks through. Breaking resistance levels could signal the start of a strong bullish move.
- **Chart Patterns:** Watch for patterns like "cup and handle," "ascending triangles," or "bullish flags" that often precede large upward movements.
### 2. **Use Technical Analysis to Enter the Market**
- **Pullbacks and Corrections:** A pullback in the trend is a good entry point if the bullish trend is still intact. For example, buying during small pullbacks after a strong upward movement can often provide an opportunity to enter at a favorable price.
- **Breakouts:** If a stock or asset breaks through a significant resistance level with momentum, this could indicate the beginning of a big move.
- **Indicators:** Use momentum indicators like RSI (Relative Strength Index) or MACD (Moving Average Convergence Divergence) to confirm that the trend is strong and not overbought.
### 3. **Risk Management**
- **Stop-Loss Orders:** Set stop-loss orders to limit your losses if the trend reverses. Consider trailing stops, where the stop-loss moves with the price to lock in profits as the trend moves up.
- **Position Sizing:** Don’t risk too much of your capital on a single trade. Use appropriate position sizing, so that even if a trade goes against you, it doesn’t hurt your portfolio too much.
- **Diversification:** Don’t concentrate all your investments into one asset or market. Spread your risk across different assets that are all riding a bullish trend.
### 4. **Ride the Trend with Patience**
- **Don’t Rush to Exit:** If the trend is strong, sometimes the best strategy is to hold your position and avoid jumping in and out of the market. Many successful traders let their positions run while adjusting their stop-loss to lock in gains.
- **Mental Discipline:** Avoid the temptation to exit too early or chase the market. Stay disciplined and stick with your plan.
### 5. **Monitor Market Sentiment**
- **News & Events:** Stay aware of news, earnings reports, and events that could drive the market. Strong bullish trends can be supported by good news, but you must also be cautious of any market-moving events that could reverse the trend.
- **Market Sentiment Indicators:** Use sentiment indicators like the Fear & Greed index or news sources to gauge whether the market is overly optimistic or if there’s still room for the trend to continue.
### 6. **Scale-In and Scale-Out**
- **Scale-In:** Add to your position as the trend strengthens and the price continues to go up. Don’t go all-in at once. Add to the position gradually as it proves itself.
- **Scale-Out:** Take partial profits along the way to lock in some gains while letting the rest of the position run if the trend continues.
### 7. **Avoid Emotional Trading**
- **Fear of Missing Out (FOMO):** Don’t chase the trend after it has already run up significantly. This often leads to buying at the top and facing a market reversal.
- **Greed:** Don’t hold onto a position out of greed when signs of a reversal are apparent. Recognize when it’s time to exit or reduce your exposure.
### 8. **Adapt to Changing Market Conditions**
- **Trend Reversals:** Be aware of signs that the trend may be reversing (e.g., a sudden sharp drop in price or lower highs forming in the chart). Don't ignore signals of a potential change, and be ready to exit before the trend turns.
- **Market Cycles:** Understand that markets move in cycles. While one trend may be bullish, eventually the market will transition, and you need to adjust your strategy accordingly.
### 9. **Use Leverage Cautiously (Advanced)**
- If you're an experienced trader, you might consider using leverage to amplify your returns on a bullish trend. However, leverage increases risk, so it should be used cautiously, and only if you fully understand the risks involved.

how to become profitable in long term trading ?Becoming **profitable in long-term trading** is about developing a solid strategy, being patient, and having the discipline to stick to your plan through market ups and downs. It’s not about quick gains but rather about making consistent, smart decisions that compound over time. Here are key steps you can follow to increase your chances of long-term profitability:
---
### **1. Develop a Clear Trading Plan**
A **trading plan** is essential for long-term success. It serves as a roadmap to guide your decisions and keep your emotions in check.
- **Define Your Goals**: Are you looking to grow your wealth over time, generate income, or hedge other investments? Be clear on your objectives.
- **Choose Your Trading Style**: Long-term trading can include strategies like:
- **Buy and Hold**: Holding positions for years to capture long-term growth.
- **Swing Trading**: Holding positions for several weeks or months based on market trends.
- **Position Trading**: Taking larger positions based on long-term trends or fundamental factors.
- **Set Criteria for Trades**: Define what conditions need to be met for you to enter and exit a trade, based on technical analysis, fundamentals, or both.
---
### **2. Focus on Solid Fundamentals**
In long-term trading, understanding the underlying assets you're trading is key. This involves:
- **Fundamental Analysis**: For stocks, this means analyzing financial statements, revenue growth, debt levels, competitive advantage, and management quality. For other assets like commodities or currencies, it means understanding supply/demand dynamics, global economic trends, etc.
- **Quality Assets**: Invest in assets that have strong long-term potential. For example, stocks of companies with solid fundamentals (e.g., consistent earnings growth, strong market position) are more likely to appreciate over time.
- **Diversification**: Spread your investments across different asset classes (stocks, bonds, commodities, etc.) to reduce risk. A diversified portfolio helps smooth out the ride over time.
---
### **3. Embrace the Power of Compounding**
**Compounding** is one of the most powerful concepts in long-term investing. By reinvesting your profits (such as dividends, interest, or capital gains), you earn returns on your original investment as well as your accumulated returns.
- **Start Early**: The earlier you start, the more time your investments have to compound. This means consistently reinvesting profits back into the market.
- **Regular Contributions**: Consider contributing to your portfolio on a regular basis (e.g., monthly or quarterly), even if the amounts are small. Over time, these contributions can grow significantly.
---
### **4. Stick to a Risk Management Strategy**
Long-term trading requires patience, and part of that patience comes from managing risk effectively.
- **Position Sizing**: Don't risk too much on any single trade. The general rule is to risk only 1–2% of your capital on each position. This helps ensure that even if a trade goes wrong, it won’t hurt your overall portfolio too much.
- **Diversification**: As mentioned, diversifying your investments across different sectors, industries, or asset classes can help reduce the overall risk of your portfolio.
- **Set Stop-Losses and Take-Profits**: While long-term trading generally involves less frequent exits, it's still smart to set stop-loss levels to protect yourself from large, unforeseen losses and take-profit levels to lock in gains when your target is met.
---
### **5. Be Patient and Avoid Emotional Trading**
- **Long-Term Focus**: One of the biggest mistakes traders make is reacting to short-term market movements. Don’t let temporary volatility derail your long-term plan.
- **Emotional Discipline**: Keep emotions like fear and greed in check. Long-term trading requires the ability to ignore the “noise” of daily market fluctuations. Stick to your plan and don’t chase after short-term wins.
- **Avoid Overtrading**: Don’t trade just for the sake of trading. Successful long-term traders often make fewer trades and hold positions for longer periods.
---
### **6. Keep Learning and Stay Informed**
- **Continuous Education**: Stay updated on market trends, economic conditions, and new trading strategies. The more you learn, the better decisions you’ll be able to make.
- **Review Your Trades**: Regularly analyze your past trades and portfolio performance. What worked? What didn’t? This feedback loop will help you improve your decision-making over time.
- **Stay Updated on Global Events**: Understanding macroeconomic trends, interest rates, geopolitical events, and industry news is critical for long-term traders. These can significantly impact your investments.
---
### **7. Keep Costs Low**
In long-term trading, transaction costs (like commissions, spreads, and fees) can eat into your profits. Minimize costs to maximize returns.
- **Use Low-Cost Brokers**: Choose brokers with low fees or commission-free trading to keep costs under control.
- **Long-Term Tax Efficiency**: Be mindful of capital gains taxes. In many countries, long-term capital gains (for assets held more than a year) are taxed at a lower rate than short-term capital gains. Plan your trades accordingly to minimize taxes.
---
### **8. Stick to a Long-Term Investment Mindset**
Successful long-term traders aren’t trying to time the market or chase every trend. Instead, they:
- **Trust the Process**: Recognize that there will be both ups and downs in the market. Be prepared for volatility, and stick to your strategy even during tough times.
- **Understand the Power of Patience**: Long-term trading is about building wealth steadily over time. It may not be as thrilling as short-term trading, but it can lead to significant gains when compounded over years.
- **Avoid Trying to "Time" the Market**: Trying to predict short-term market movements is difficult and often counterproductive. Instead, focus on capturing long-term growth and trend-following.
---
### **9. Monitor and Adjust When Necessary**
While patience is crucial, so is flexibility. You should monitor your portfolio periodically and make adjustments as needed:
- **Rebalance Your Portfolio**: Over time, some assets in your portfolio may grow faster than others, causing your initial asset allocation to shift. Periodically rebalance your portfolio to align with your long-term goals.
- **Adapt to Changing Conditions**: The world changes, and so do markets. Stay open to adjusting your strategy if you notice shifts in market conditions, economic trends, or your personal financial situation.
---
### **10. Stay Disciplined in Your Approach**
- **Avoid the Urge to “Time the Market”**: It’s nearly impossible to predict short-term price movements. Trust your long-term plan and make decisions based on sound analysis, not market noise.
- **Stay Committed**: Long-term profitability requires consistency. Stick to your strategy, keep learning, and be disciplined.
---
### Conclusion:
**Long-term trading** is about building wealth gradually through informed decisions, patience, and proper risk management. It’s not about chasing short-term gains but about being consistent in your approach, staying disciplined, and letting your investments grow over time. With the right mindset and strategy, you can achieve consistent profitability in the long run.

ICICI BANK: Good Area to Accumulate1. Respecting the EMAs.
2. Holding higher levels despite the overall market pressure.
3. Outperforming the major Indices
4. Following the channel since 2020.

what is option chain pcr ?**Option Chain PCR (Put-Call Ratio)** is a popular metric used by traders and investors to gauge market sentiment and make decisions regarding the strength of a market move. It’s derived from the **option chain**, which is a listing of all the available **call** and **put** options for a specific asset (e.g., stocks, indices) and their various strike prices and expiration dates.
### Key Concepts of Option Chain PCR:
1. **Put-Call Ratio (PCR)**:
- The **Put-Call Ratio** is the ratio of the total number of **put options** (bearish bets) to the total number of **call options** (bullish bets) traded in the market for a specific underlying asset, during a particular time period (like a day or week).
- The formula for PCR is:
\
Where:
- **Total Puts Open Interest**: The total open interest (the number of outstanding contracts) for put options.
- **Total Calls Open Interest**: The total open interest for call options.
2. **Interpretation of PCR**:
- **PCR > 1**: If the PCR is greater than 1, it indicates that there are more put options being traded compared to call options. This suggests a **bearish sentiment** in the market, as traders are anticipating a potential decline in the underlying asset's price.
- **PCR < 1**: If the PCR is less than 1, it indicates that there are more call options being traded compared to put options. This suggests a **bullish sentiment**, as traders expect the price of the underlying asset to rise.
- **PCR = 1**: A PCR of 1 indicates a neutral sentiment, meaning the number of calls and puts is balanced, showing no strong directional bias from the options market.
3. **What PCR Can Tell You**:
- **Bullish Sentiment**: A low PCR (below 1) often indicates that traders are more inclined toward buying call options, which reflects a positive outlook on the asset. The market participants are expecting an upward movement in the price.
- **Bearish Sentiment**: A high PCR (above 1) usually signals that more traders are buying put options, indicating a bearish outlook. It suggests that the market expects a decline in the price of the asset.
- **Contrarian Indicator**: The PCR can also be a **contrarian indicator**. For example, when the PCR is extremely high (indicating heavy bearish sentiment), it could signal that the market is overly pessimistic and a potential reversal to the upside could occur. Similarly, an extremely low PCR might suggest that the market is overly optimistic, and a price correction or reversal could be imminent.
4. **PCR in Context**:
- The PCR can be more useful when analyzed in conjunction with other factors. For example:
- **High PCR during a market selloff**: It may indicate that the market is reaching extreme pessimism, and a reversal could be on the horizon.
- **Low PCR during a market rally**: It might suggest overconfidence, and a pullback or correction could be possible.
5. **PCR on Different Timeframes**:
- **Daily PCR**: Measures the sentiment based on daily option activity, often reflecting short-term sentiment.
- **Weekly/Monthly PCR**: Provides a broader perspective on market sentiment over a longer horizon. For long-term investors, looking at the weekly or monthly PCR can provide insights into general market sentiment and expectations.
### How to Use Option Chain PCR in Trading:
1. **Market Sentiment Analysis**:
- PCR is a tool for assessing overall **market sentiment** and helps traders understand whether the market is currently dominated by bulls (call buyers) or bears (put buyers). This helps in forming a general view of market direction.
2. **Spotting Market Extremes**:
- A very **high PCR** (e.g., above 1.5 or 2) could indicate excessive pessimism and might signal an **oversold condition**, suggesting that the market is due for a reversal to the upside.
- A very **low PCR** (e.g., below 0.5 or 0.4) could indicate excessive optimism and could point to an **overbought condition**, suggesting the market might be due for a pullback or reversal.
3. **Trend Confirmation**:
- If the PCR is rising steadily in a bull market, it can indicate that the market is becoming increasingly bearish, and a reversal could be imminent.
- Conversely, a rising PCR during a bear market could indicate growing bullish sentiment, signaling the possibility of a reversal or market bottom.
4. **Combination with Other Indicators**:
- The PCR should ideally be combined with other technical indicators like **Moving Averages**, **RSI**, and **MACD** to confirm trends and avoid false signals.
- **Open interest data** (how many contracts are open) in addition to PCR can also provide additional confirmation about the strength of a trend.
### Example of Using PCR:
1. **Bullish Market**:
- You notice that the PCR has been consistently **below 1** during a market rally, indicating that traders are buying more calls than puts, reflecting strong bullish sentiment.
- The PCR moves even lower, indicating extreme optimism, but no significant signs of reversal in price are seen. In this case, the PCR supports the continuation of the bullish trend.
2. **Bearish Market**:
- During a market correction or downtrend, the PCR is consistently **above 1**, suggesting that more traders are buying puts, and the market sentiment is largely bearish.
- If the PCR becomes **extremely high**, this could indicate **overbought conditions** in terms of bearish sentiment, suggesting that the market may be oversold and could reverse.
### Conclusion:
The **Option Chain PCR (Put-Call Ratio)** is a valuable tool for measuring market sentiment, providing insights into whether the market is overly bullish or bearish. A high PCR indicates bearish sentiment, while a low PCR suggests bullish sentiment. The PCR can help traders assess the likelihood of a market reversal, but it should be used in conjunction with other technical analysis tools and indicators to get a more comprehensive view of the market. It's also important to note that extreme values in PCR (both high and low) could signal a potential change in trend or price direction, but this should be verified with other confirmation signals.

what is algotrading and how to automate your profits ?**Algorithmic Trading (Algotrading)** refers to the use of computer algorithms to automatically execute trading strategies in financial markets. It involves creating a set of predefined instructions (based on quantitative analysis) that allow a computer to buy or sell assets at the best possible prices without human intervention. The key objective of algorithmic trading is to profit from market inefficiencies or predefined patterns by executing orders at high speed and in large volumes.
### **How Does Algorithmic Trading Work?**
1. **Algorithm Creation**:
The first step in algorithmic trading is to develop a **trading algorithm** based on a specific strategy. These algorithms are typically based on technical analysis, statistical models, or machine learning techniques. The strategies can be very simple, such as **moving average crossovers**, or more complex, using multiple indicators, backtesting, and optimization.
2. **Execution**:
Once the algorithm is built and programmed, the system is connected to an exchange or broker via an **API (Application Programming Interface)**. The algorithm executes the trades automatically, following the rules defined in the strategy without human input.
3. **Speed and Efficiency**:
Algorithms can execute trades **at incredibly fast speeds**, which allows them to capitalize on small price movements and market inefficiencies that might not be visible to human traders. This is why high-frequency trading (HFT) — a subset of algorithmic trading — is so successful.
4. **Market Impact**:
Algorithms analyze a large amount of market data (such as price, volume, volatility, and order book depth) in real-time. They make decisions based on this data and place orders in the market. For example, if an algorithm detects that a stock is overbought or oversold, it might automatically initiate a trade to capitalize on the price discrepancy.
5. **Risk Management**:
Many algorithms are designed with built-in **risk management rules**, such as stop-loss orders or maximum drawdowns, to minimize the risk of significant losses in volatile markets.
---
### **Types of Algorithmic Trading Strategies**
1. **Trend Following Algorithms**:
- These algorithms are designed to identify and follow market trends, entering positions when a trend is detected and exiting when the trend shows signs of reversal.
- Example: **Moving Average Crossovers**, **Momentum-based strategies**, or **MACD** (Moving Average Convergence Divergence) strategies.
2. **Mean Reversion Algorithms**:
- These strategies assume that prices will revert to their mean over time. Algorithms based on this strategy enter positions when prices deviate significantly from their historical averages, expecting the prices to return to normal.
- Example: **Bollinger Bands** or **Statistical Arbitrage** strategies.
3. **Arbitrage Algorithms**:
- These algorithms seek to exploit price differences for the same asset across different markets or exchanges. They buy an asset at a lower price on one exchange and simultaneously sell it at a higher price on another.
- Example: **Cross-Border Arbitrage** or **Statistical Arbitrage** (e.g., pairs trading).
4. **Market Making Algorithms**:
- Market-making algorithms create liquidity in markets by simultaneously placing buy and sell orders at different price levels. The goal is to profit from the bid-ask spread.
- These algorithms are typically used by brokers and high-frequency traders.
5. **High-Frequency Trading (HFT)**:
- A subset of algorithmic trading where algorithms are used to execute a large number of orders in extremely short timeframes, capitalizing on tiny price discrepancies that only exist for fractions of a second.
6. **Sentiment Analysis Algorithms**:
- These algorithms analyze social media, news articles, and other public data sources to gauge the market sentiment and make trading decisions based on public perception.
- Example: Algorithms that use Natural Language Processing (NLP) to assess news headlines and social media sentiment to trade stocks or cryptocurrencies.
---
### **How to Automate Your Profits with Algorithmic Trading**
Here’s a step-by-step guide to automating your trading and potentially increasing profits:
#### **1. Choose a Trading Strategy**
- Before automating, you need to decide on a strategy that aligns with your trading goals. Popular strategies include:
- **Trend-following strategies** (moving averages, MACD).
- **Mean-reversion strategies** (Bollinger Bands, RSI).
- **Arbitrage strategies**.
- **Breakout strategies**.
Make sure the strategy is well-defined and has been tested in historical data before you automate it.
#### **2. Learn Programming or Use a Trading Platform**
- You need programming knowledge to create an algorithmic trading strategy. Common languages used for algorithmic trading are:
- **Python**: Widely used due to its simplicity and access to data libraries like Pandas, NumPy, and SciPy. Python also has frameworks like **Backtrader** and **Zipline** for backtesting strategies.
- **R**: Preferred by statisticians and quantitative analysts.
- **C++/Java**: These languages are faster but more complex and used in high-frequency
trading.
Alternatively, if you're not familiar with programming, many brokers offer **pre-built algorithmic trading platforms** like MetaTrader (MT4/MT5), which allow you to automate trading with **Expert Advisors (EAs)** or other user-friendly tools.
#### **3. Backtest the Strategy**
- Before live trading, **backtesting** is crucial to assess the potential profitability of the algorithm based on historical data.
- This step helps you identify flaws in the strategy and optimize it.
- Backtesting ensures the strategy has worked well under different market conditions, such as volatility, trending, and sideways movements.
#### **4. Choose a Broker or API for Execution**
- Once the algorithm is ready and backtested, you’ll need to connect it to a broker that offers **API access** for algorithmic trading. This API will allow the algorithm to place real-time trades.
- Brokers with API support include:
- **Interactive Brokers**: Known for low commissions and extensive API options for algorithmic trading.
- **TD Ameritrade**: Provides a powerful API with extensive data feeds for options and stocks.
- **Alpaca**: A commission-free brokerage that provides a simple API for algorithmic trading.
- **Binance** (for cryptocurrency trading).
#### **5. Paper Trade (Simulated Trading)**
- Before committing real capital, you should test your algorithm with **paper trading**. This allows you to simulate trades in real-time with live market data, but without using real money.
- This step helps you observe how your algorithm performs under current market conditions and gives you a chance to fine-tune it further.
#### **6. Monitor and Optimize**
- Algorithmic trading isn’t a “set it and forget it” process. Even after automating, you need to continuously monitor the performance of your algorithm.
- Some adjustments might be required if market conditions change, such as high volatility or market crashes.
- Regularly **optimize** the algorithm based on performance and adapt to new data, improving its accuracy.
#### **7. Risk Management**
- Set proper **risk management rules** in the algorithm. These include:
- **Stop-loss** and **take-profit levels** to lock in profits and limit losses.
- **Position sizing**: Define how much capital you are willing to risk per trade.
- **Max drawdown** limits to prevent major losses during adverse market conditions.
Risk management ensures that even in the case of algorithm failure, your overall capital is protected.
### **How to Get Started with Algorithmic Trading**
1. **Learn the Basics of Algorithmic Trading**:
- Take courses, read books, and follow blogs about algorithmic trading.
- Recommended courses/platforms include **Coursera**, **Udemy**, and **QuantInsti** (for algo trading).
2. **Pick the Right Tools**:
- Use **Backtrader**, **QuantConnect**, or **Zipline** for backtesting.
- Use **Python** or **R** to write trading algorithms.
3. **Start Small**:
- Begin with a simple strategy and small capital.
- Scale up gradually as you gain experience.
4. **Diversify and Test**:
- Test multiple strategies and ensure that you are diversified across assets to reduce the risks of relying on one algorithm.
5. **Automate and Monitor**:
- Once your algorithm is running, monitor it frequently to ensure it is performing well and make adjustments as needed.
### **Summary**
**Algorithmic Trading** can significantly improve your trading by automating processes, allowing you to execute strategies quickly and efficiently. By using tools like Python, backtesting, and connecting with brokers through APIs, you can create and implement algorithms that can operate in real-time, following predefined rules for entering and exiting trades.
However, successful algo-trading requires a strong understanding of **quantitative analysis**, **risk management**, and **strategy optimization**. It’s essential to continuously monitor and refine your algorithms to adapt to market changes.

What is divergence based trading and how to use it ?### **What is Divergence-Based Trading?**
**Divergence-based trading** is a technique used in technical analysis that focuses on spotting discrepancies between the price movement of an asset and the behavior of a technical indicator (such as RSI, MACD, or Stochastic Oscillator). **Divergence** occurs when the price of the asset is moving in one direction while the indicator is moving in the opposite direction. This discrepancy suggests that the current trend may be losing momentum and a reversal could be imminent.
There are two main types of divergence:
1. **Bullish Divergence**: This occurs when the price forms lower lows, but the indicator forms higher lows. It indicates that selling pressure is weakening and the price could potentially reverse upwards.
2. **Bearish Divergence**: This occurs when the price forms higher highs, but the indicator forms lower highs. It indicates that buying pressure is weakening, and the price could potentially reverse downwards.
### **How to Use Divergence in Trading?**
Divergence is a powerful tool in identifying potential trend reversals, and it is often used in combination with other technical indicators or chart patterns to increase accuracy. Here's how you can use divergence-based trading effectively:
---
### 1. **Identifying Divergence**:
- **Bullish Divergence**:
- The price makes a **lower low**, but the indicator (e.g., RSI, MACD) makes a **higher low**.
- This suggests weakening selling pressure and the possibility of a reversal to the upside.
- **How to Spot**: Look for a downtrend in price, but check if the indicator shows higher lows at the same time.
- **Bearish Divergence**:
- The price makes a **higher high**, but the indicator makes a **lower high**.
- This suggests that buying momentum is weakening, and a reversal to the downside could occur.
- **How to Spot**: Look for an uptrend in price, but check if the indicator shows lower highs at the same time.
---
### 2. **Using Divergence with Indicators**:
Some of the most commonly used indicators to spot divergence are:
- **RSI (Relative Strength Index)**:
- **Overbought/oversold zones**: RSI typically ranges from 0 to 100. An RSI above 70 is considered overbought (indicating potential bearish divergence), and an RSI below 30 is considered oversold (indicating potential bullish divergence).
- Divergence is spotted when the RSI doesn't follow the price pattern. For example, if the price is making a higher high but the RSI is making a lower high, it’s a sign of bearish divergence.
- **MACD (Moving Average Convergence Divergence)**:
- MACD uses the difference between short-term and long-term moving averages, and it is often used to confirm price trends. A divergence between MACD and price can signal a potential reversal.
- A **bullish divergence** happens when the price is making lower lows, but the MACD is making higher lows. A **bearish divergence** happens when the price is making higher highs, but the MACD is making lower highs.
- **Stochastic Oscillator**:
- The stochastic oscillator ranges from 0 to 100 and measures momentum. Like RSI, it helps identify overbought (above 80) and oversold (below 20) conditions. Divergence can be identified when the price is making new highs or lows, but the stochastic oscillator is not.
---
### 3. **Confirming Divergence Signals**:
Divergence on its own is not a reliable trading signal. To improve the accuracy of your trades, you should use divergence in conjunction with other technical analysis tools, such as:
- **Trendlines**: Drawing trendlines to identify the current trend and confirming that the divergence is occurring against the trend.
- **Candlestick Patterns**: Use candlestick reversal patterns (like a doji, engulfing, or hammer) at the point of divergence to confirm a potential reversal.
- **Support/Resistance Levels**: Look for divergence near significant support or resistance levels, as these can strengthen the potential for a reversal.
---
### 4. **Practical Example of Divergence-Based Trading**:
#### **Bullish Divergence Example**:
- The price of a stock is making lower lows, indicating a downtrend. However, the **RSI** is making higher lows, signaling that selling momentum is weakening.
- This is a **bullish divergence** because the price is making lower lows, but the RSI is indicating that buyers are beginning to outpace sellers, possibly signaling a reversal to the upside.
- **Trade Setup**: Once the divergence is confirmed and supported by a candlestick pattern or breakout from a downtrend line, traders may enter a long position with a stop loss below the most recent low.
#### **Bearish Divergence Example**:
- The price of a stock is making higher highs, indicating an uptrend. However, the **MACD** is making lower highs, signaling that upward momentum is weakening.
- This is a **bearish divergence**, indicating that even though the price is still rising, the buying pressure is subsiding, and the price may be ready for a pullback or reversal.
- **Trade Setup**: After confirming the divergence and observing a bearish candlestick pattern (like a shooting star or evening star), traders may enter a short position with a stop loss above the most recent high.
---
### 5. **Divergence Trading Strategies**:
- **Divergence with Trendlines**: Draw a trendline connecting the recent highs or lows. When the price diverges from the indicator (i.e., the trendline shows a different direction from the indicator), it could be a signal of a potential trend change.
- **Divergence + Breakout Strategy**: When divergence occurs, wait for the price to break out of a trendline or support/resistance level. This confirms that the divergence is likely leading to a reversal.
- **Divergence + Volume**: Check if divergence is accompanied by a volume increase. Divergence with a surge in volume tends to be a stronger signal of a potential trend reversal.
---
### 6. **Limitations of Divergence-Based Trading**:
- **False Signals**: Divergence can sometimes give false signals, especially in choppy or range-bound markets where prices can move erratically.
- **Not Always a Reversal**: Divergence doesn’t guarantee that a reversal will happen immediately. It’s just an indication that the current trend may be weakening.
- **Lagging Indicator**: Divergence is based on historical price data, so it’s a lagging indicator and might appear too late in some cases.
- **Confirmation Needed**: It’s crucial to wait for confirmation from other indicators, price action, or chart patterns before acting on divergence alone.
---
### **Conclusion**:
Divergence-based trading is a powerful strategy to spot potential trend reversals before they happen. By identifying discrepancies between price and technical indicators like MACD, RSI, and Stochastic Oscillator, traders can get an early warning of potential changes in market direction. However, it’s essential to use divergence alongside other technical analysis tools to confirm the signals and avoid false positives.
To use divergence effectively:
- **Look for Bullish Divergence** in downtrends and **Bearish Divergence** in uptrends.
- Use indicators like **MACD**, **RSI**, and **Stochastic Oscillator** to identify divergence.
- Combine divergence with other tools like trendlines, candlestick patterns, and volume to confirm trade setups.
With practice, divergence-based trading can become an invaluable part of your trading toolkit!

ICICI Bank Ltd stock LongICICI Bank Ltd. is a leading private-sector bank in India, offering a wide range of banking and financial services. Here's a comprehensive analysis of its stock performance and financial health:
**Stock Performance:**
- **Current Price:** As of February 17, 2025, ICICI Bank's share price is ₹1,260.10. citeturn0search7
- **52-Week Range:** The stock has traded between ₹1,023.35 and ₹1,362.35 over the past year, indicating significant volatility. citeturn0search7
- **Recent Performance:** Over the last six months, the share price has increased by 7.85%, and over the past year, it has risen by 23.56%. citeturn0search7
**Financial Highlights:**
- **Earnings Per Share (EPS):** In the quarter ending January 25, 2025, ICICI Bank reported an EPS of $0.387, surpassing the consensus estimate of $0.379. citeturn0search6
- **Net Interest Income (NII):** The bank has experienced a 9% increase in NII, reflecting robust growth in its core lending operations. citeturn0search1
- **Profit After Tax (PAT):** There has been a 15% rise in PAT, indicating improved profitability. citeturn0search1
**Valuation Metrics:**
- **Price-to-Earnings (P/E) Ratio:** ICICI Bank's P/E ratio stands at 17.70, suggesting the stock is trading at a reasonable multiple relative to its earnings. citeturn0search2
- **Price-to-Book (P/B) Ratio:** The P/B ratio is 3.31, indicating the stock is valued at over three times its book value. citeturn0search2
- **Return on Equity (ROE):** The bank's ROE is 17.49%, reflecting efficient use of shareholders' equity to generate profits. citeturn0search2
**Dividend Information:**
- **Dividend Yield:** ICICI Bank offers an annual dividend of $0.202, translating to a yield of approximately 0.7%. citeturn0search6
**Institutional Ownership:**
- **Ownership Structure:** Approximately 75.21% of ICICI Bank's shares are held by institutional investors, indicating strong institutional confidence in the bank's prospects. citeturn0search5
**Analyst Insights:**
- **Analyst Consensus:** The stock holds a "Moderate Buy" rating, with an average price target of $35.50, suggesting a potential upside of 21.74%. citeturn0search6
- **Smart Score:** ICICI Bank has a Smart Score of 8, indicating it is expected to outperform the market. citeturn0search6
**Recent Developments:**
- **Relative Strength Rating:** The bank's ADRs received an upgrade in their Relative Strength Rating from 70 to 75, reflecting improved stock performance relative to peers. citeturn0news13
**Conclusion:**
ICICI Bank demonstrates strong financial performance, with significant growth in earnings and net interest income. The stock is trading at reasonable valuation multiples, supported by robust institutional ownership and favorable analyst ratings. Investors should consider these factors when evaluating ICICI Bank as a potential investment.

#ICICIBANKICICIBANK is possibly headed for a correction, weekly charts suggest that it has taken resistance with a kind of double top formation near the channel top with RSI divergence.
It has corrected from top and has recently done a pullback near to 50% level, from there it is again facing resistance and there is possibility that it eventually corrects upto channel bottom.
If my market profile reading is correct, then slowly it may eventually test 1180 POC
and based on #GannFan analysis it is probably facing resistance as per this chart, with a very important time Cyle of 99B & 144D from its recent ATH already completed. Such confluence of Time cycles does give some violent moves once price breaches High or Low of confluence
This post is not a buy or sell reco but just for my own records and learning purpose. Before taking any trade, do your own research and consult your Financial advisor

What is the use of Macd in trading ?What does MACD 12, 26, 9 mean? The 12 from the Moving Average Convergence Divergence represents a moving average of the previous 12 bars. The 26 represents a moving average of the previous 26 bars. The 9 represents a moving average of the difference between the two moving averages 12 and 26 above.
MACD above zero signals bullish momentum, while MACD below zero is signals bearish momentum. When MACD moves into the positive territory from below the zero-line on a chart, it indicates divergence between the two moving averages. This means the bullish momentum is picking pace

ICICI Bank: Breakout or Breakdown?1. Chart Overview
Timeframe: Daily chart (1D).
Pivot Points: Fibonacci Auto 15 Left pivots are visible, providing Support (S1, S2, S3) and Resistance (R1, R2, R3) levels.
Indicators Used:
MACD (Moving Average Convergence Divergence): Indicates momentum and trend changes.
EMA (Exponential Moving Average): Integrated into MACD for smoother trend analysis.
Price Range: ₹1,197.30 to ₹1,338.60 (consolidation band highlighted in blue).
2. Observations
Price Action
The stock is trading in a well-defined consolidation phase (marked by the blue rectangle).
The support zone lies around ₹1,197, and resistance is near ₹1,338.
Past trends show periodic breakouts above R3, which are followed by corrections back into the consolidation zone.
Fibonacci Pivot Levels
R1, R2, R3: These act as key resistance zones. Breakouts above R3 may signal strong bullish momentum.
S1, S2, S3: These levels indicate support zones. Breakdown below S3 could lead to further downside.
Recent candles show price testing the S1 zone near ₹1,259 and bouncing back upward.
MACD Analysis
MACD Line (Blue): Currently negative but rising, signaling a potential bullish crossover.
Signal Line (Orange): Indicates momentum is still weak but improving.
Histogram: Displays reducing negative bars, suggesting bearish momentum is waning.
Volume Profile (Implied)
Flat Trend: Suggests indecision or consolidation in recent months.
Breakouts from such ranges are usually accompanied by a spike in trading volume.
3. Key Levels
Support Levels:
Immediate support: ₹1,259.
Strong support: ₹1,197 (bottom of the consolidation zone).
Resistance Levels:
Immediate resistance: ₹1,338.
Strong resistance: ₹1,400 (previous breakout levels).
4. Trading Insights
For Bulls (Uptrend Expectation):
A breakout above ₹1,338 with volume would indicate a continuation of bullish momentum toward ₹1,400 or beyond.
Watch for a MACD bullish crossover above the signal line to confirm an uptrend.
For Bears (Downtrend Expectation):
A breakdown below ₹1,197 could lead to further downside, with possible targets near ₹1,100 or ₹1,050 (as per S3 levels).
Bearish divergence in MACD or rejection near ₹1,338 could be early signs of a potential downtrend.
5. Recommendations
Swing Traders: Utilize the consolidation range between ₹1,197 and ₹1,338 for range-bound trades. Buy near support and sell near resistance with tight stop losses.
Breakout Traders: Monitor ₹1,338 for a breakout confirmation and ₹1,197 for a breakdown scenario. Look for volume spikes and MACD confirmation.
Long-Term Investors: Focus on higher timeframes for trend validation. The stock remains in an overall uptrend, making ₹1,197 a potential long-term buying zone.

ICICI Bank, Target 960ICICI Bank can drop to 960 target. There only there is a major support I'm seeing.

ICICI Bank : Good HOLD in current market- Q3 results was good and stock can open with a bounce tomorrow morning.
- Technically, it is trading in a downward regression channel, and at 200D-EMA (support), and can give a upside breakout. The zone of 1300-1330 can act as a resistance in short term, while downside seems to be capped at 1000 (worst case) with strong support at 1170-1150 level.
- The stock is expensive fundamentally, BUT can remain trading so given improved performance and is one of the safe against market volatility too in short term.

Bat Pattern And Major Trendline Support - ICICI BankThe price is trading below the Bat pattern neckline which indicates the further down fall upto D point. The Major trendline and Bat pattern D point support lies at same price which acts as a Major support.
Over the past six months, ICICI Bank's stock has experienced a slight decline, with a performance of approximately -3.38%. This period has seen fluctuations in its stock price, reflecting broader market trends and specific banking sector dynamics.
The stock has faced challenges recently, with a -7.47% drop in the last month alone, indicating some volatility in the short term. Despite the recent downturn, ICICI Bank's long-term performance remains strong, with significant gains over one, three, and five years, showcasing its resilience in the banking sector.
So we will wait and start buy at this support. This is for educational purposes only.

ICICI Bank Projection For Next 6 Months### ICICI Bank
- **Full Name**: Industrial Credit and Investment Corporation of India Bank
- **Founded**: 1994
- **Headquarters**: Mumbai, Maharashtra, India
- **CEO**:
- **Industry**: Banking, Financial Services
- **Products**: Personal banking, corporate banking, investment banking, wealth management, insurance, and treasury services
- **Stock Listing**: Listed on the Bombay Stock Exchange (BSE) and the National Stock Exchange (NSE) of India. Also listed on the New York Stock Exchange (NYSE).
### Overview:
- **History**: ICICI Bank was originally established as ICICI Limited in 1955 as a development financial institution. It transformed into a commercial bank in 1994 and has grown to become one of the largest private sector banks in India.
- **Global Presence**: ICICI Bank has a global footprint with subsidiaries in the United Kingdom and Canada, branches in the United States, Singapore, Bahrain, Hong Kong, Sri Lanka, Qatar, Oman, Dubai International Finance Centre, and representative offices in the United Arab Emirates, China, South Africa, Bangladesh, Malaysia, and Indonesia.
- **Digital Banking**: The bank is renowned for its innovative digital banking solutions and services.
ICICI Bank is a prominent player in the Indian banking sector, known for its wide range of products, services, and extensive customer base both domestically and internationally.

ICICI BankDaily time frame shows that price is at double bottom support. Lower time frame shows price is consolidating at the support zone.
Sustaining above 1230 is important to be bullish.
Buy above 1232 with the stop loss of 1222 for the targets 1244, 1256 and 1268. If price did not gain bullish strength, it may move in range. Do your own analysis before taking any trade.
