Infosys ADR +40% — Why This Is NOT a Real BreakoutA sudden +40% move in Infosys ADR can easily confuse traders and create unnecessary hype.
This spike is not a fresh rally — it’s a technical adjustment related to ADR structure, ratio/currency recalibration, or data normalization.
The key reality check:
• Indian Infosys (NSE) did NOT move 40%
• No
Infosys Limited Shs Cert Deposito Arg Repr 1 Sh
No trades
900 ARS
3.06 T ARS
18.69 T ARS
About Infosys Limited
Sector
Industry
CEO
Salil S. Parekh
Website
Headquarters
Bangalore
Founded
1981
Identifiers
2
ISINARDEUT113941
Infosys Limited is engaged in consulting, technology, outsourcing and next-generation services. The Company, along with its subsidiaries, provides business information technology services comprising application development and maintenance, independent validation, infrastructure management, engineering services comprising product engineering and life cycle solutions and business process management; consulting and systems integration services comprising consulting, enterprise solutions, systems integration and advanced technologies; products, business platforms and solutions to accelerate intellectual property-led innovation, including Finacle, its banking solution, and offerings in the areas of Analytics, Cloud and Digital Transformation. Its segments are Financial Services and Insurance (FSI), Manufacturing and Hi-tech (MFG & Hi-TECH), Energy & utilities, Communication and Services (ECS), Retail, Consumer packaged goods and Logistics (RCL), and Life Sciences and Healthcare (LSH).
Related stocks

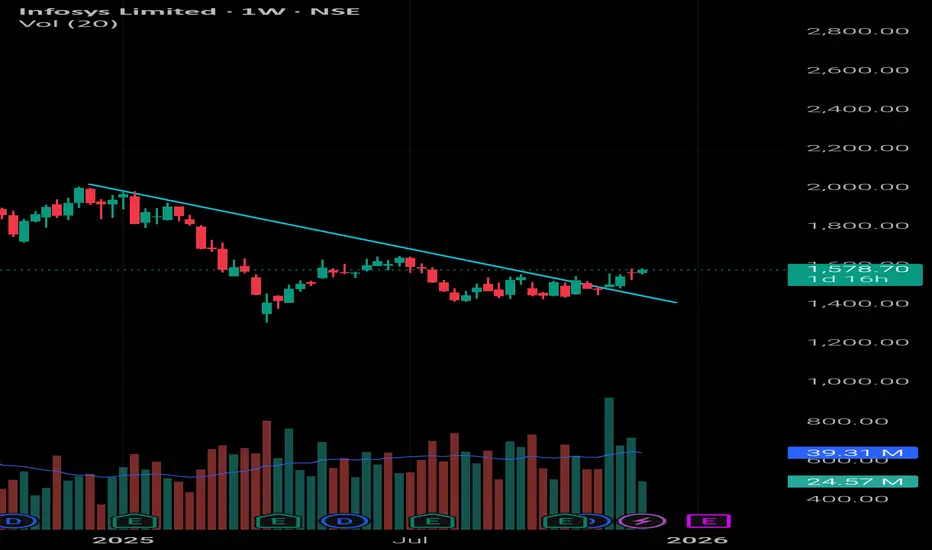
Infosys (W): Bullish - Coiling Pre-BreakoutTimeframe: Weekly | Scale: Logarithmic
The stock is in the final stages of a consolidation pattern, trading just below a multi-year resistance zone. The setup is a classic "absorption" phase , where buyers are soaking up supply before an imminent breakout, fueled by sector tailwinds.
🚀 1. The F

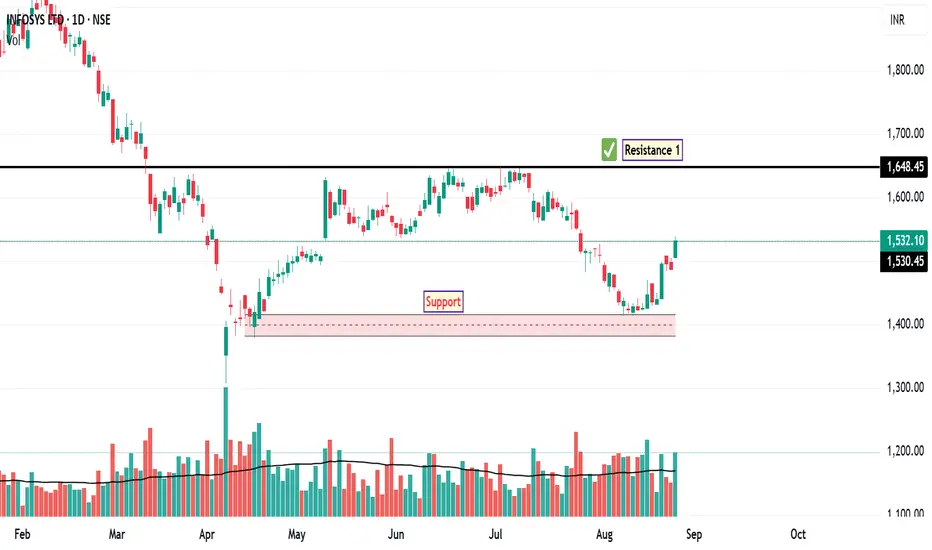
INFY: Swing SetupAfter experiencing a sustained downtrend since February 2025, Infosys has recently shown signs of a potential reversal on the daily chart. The stock has managed to close above its 50-day EMA, indicating a shift in short-term momentum and suggesting that buyers are beginning to regain control.
The
Part 2 Intraday Trading Master ClassKey Terminologies Before Trading Options
Premium
Price paid to buy an option.
Strike Price
The predetermined price at which the option can be exercised.
Expiry
The date on which the option contract becomes invalid.
In India, options expire weekly (indices) or monthly (stocks).
Lot Size
Option

Part 8 Trading Master Class What Are Options?
Options are financial contracts that give the buyer the right, but not the obligation, to buy or sell an asset at a predetermined price within a specified time. Unlike stocks, where ownership is direct, options merely provide conditional access to ownership. This feature allows tr

INFY | Weekly Bullish Options Setup | 30 Dec ExpiryTrade Structure:
• Sell 1640 PE
• Buy 1600 PE
• Defined-risk bull put spread
Why this setup works for NSE:INFY
INFY is showing a clear recovery from the lower band with improving momentum. RSI has turned up from the mid-zone and ROC is trending higher, suggesting strength is building rather than

Chart Patterns Financial markets speak a language of price. Every movement on a chart represents the collective psychology of millions of participants—institutions, traders, investors, algorithms, and speculators. Chart patterns and candlestick patterns are the visual translation of this psychology. They do not pr

Part 7 Trading Master ClassIntermediate Strategies
1. Bull Call Spread
Buying a call at a lower strike and selling another at a higher strike. This reduces cost but limits maximum profit.
2. Bear Put Spread
Buying a higher strike put and selling a lower strike put. It profits from moderate downside movement with controlled

Premium PatternsFinal Tips to Master Premium Chart Patterns
Patterns don't work alone—context is everything.
Look for liquidity sweeps before pattern confirmation.
Avoid trading patterns in the middle of trends.
Volume is the key filter to avoid false breakouts.
Journal each pattern you trade and review monthl

Infy Weekly Chart Breakout Infy Weekly Chart Breakout showing increasing in volume also. Closely watch the strength of breakout in coming weeks. Purely for Paper trade. First learn than earn.
If you want real trade than care should be taken for risk management.
See all ideas
Summarizing what the indicators are suggesting.
Oscillators
Neutral
SellBuy
Strong sellStrong buy
Strong sellSellNeutralBuyStrong buy
Oscillators
Neutral
SellBuy
Strong sellStrong buy
Strong sellSellNeutralBuyStrong buy
Summary
Neutral
SellBuy
Strong sellStrong buy
Strong sellSellNeutralBuyStrong buy
Summary
Neutral
SellBuy
Strong sellStrong buy
Strong sellSellNeutralBuyStrong buy
Summary
Neutral
SellBuy
Strong sellStrong buy
Strong sellSellNeutralBuyStrong buy
Moving Averages
Neutral
SellBuy
Strong sellStrong buy
Strong sellSellNeutralBuyStrong buy
Moving Averages
Neutral
SellBuy
Strong sellStrong buy
Strong sellSellNeutralBuyStrong buy
Displays a symbol's price movements over previous years to identify recurring trends.
Curated watchlists where INFY is featured.

Indian stocks: Racing ahead
46 No. of Symbols
See all sparks