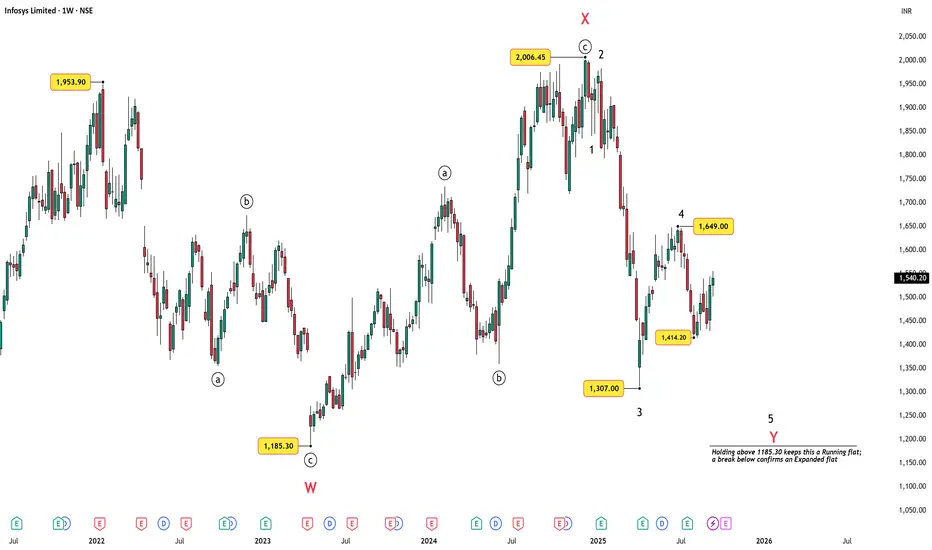
Infosys: Technicals Align with H-1B HeadwindsInfosys (NSE: INFY) has been moving within a larger corrective structure after topping near ₹2006. The weekly Elliott Wave count suggests a possible W–X–Y correction, where the Y-leg may be unfolding as a 3-3-5 flat. With prices currently hovering in the mid-1500s, the bigger picture hints at unfini
800 ARS
3.06 T ARS
18.69 T ARS
About Infosys Limited
Sector
Industry
CEO
Salil S. Parekh
Website
Headquarters
Bangalore
Founded
1981
ISIN
ARDEUT113941
FIGI
BBG000PZ2494
Infosys Limited is engaged in consulting, technology, outsourcing and next-generation services. The Company, along with its subsidiaries, provides business information technology services comprising application development and maintenance, independent validation, infrastructure management, engineering services comprising product engineering and life cycle solutions and business process management; consulting and systems integration services comprising consulting, enterprise solutions, systems integration and advanced technologies; products, business platforms and solutions to accelerate intellectual property-led innovation, including Finacle, its banking solution, and offerings in the areas of Analytics, Cloud and Digital Transformation. Its segments are Financial Services and Insurance (FSI), Manufacturing and Hi-tech (MFG & Hi-TECH), Energy & utilities, Communication and Services (ECS), Retail, Consumer packaged goods and Logistics (RCL), and Life Sciences and Healthcare (LSH).
Related stocks
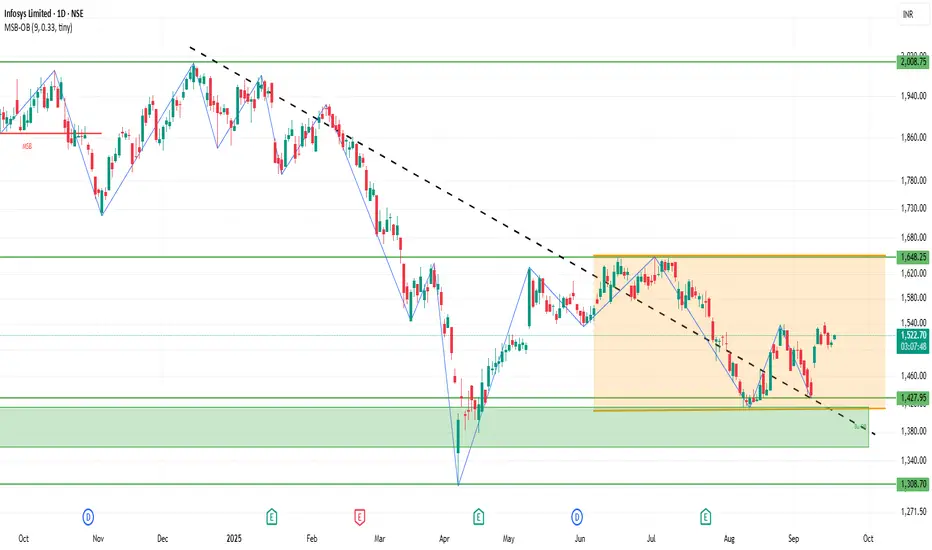
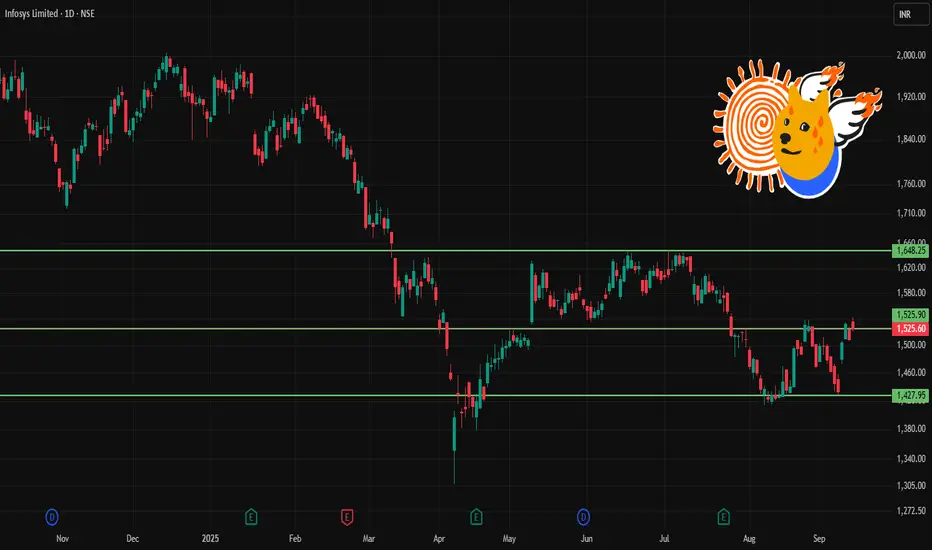
INFY 1D Time frameCurrent Facts
INFY is trading around ₹1,525-₹1,530.
Recent high / resistance being tested around ₹1,540-₹1,550.
The stock has a 52-week low around ₹1,307 and a high near ₹2,006.
Technical momentum is neutral to mildly bullish. Indicators like MACD are positive but RSI is not yet overbought.
🔍 K
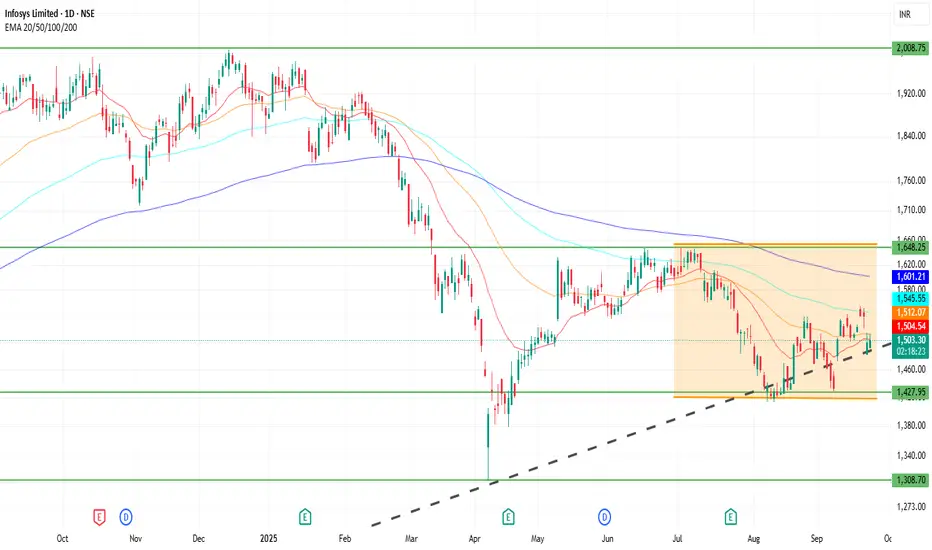
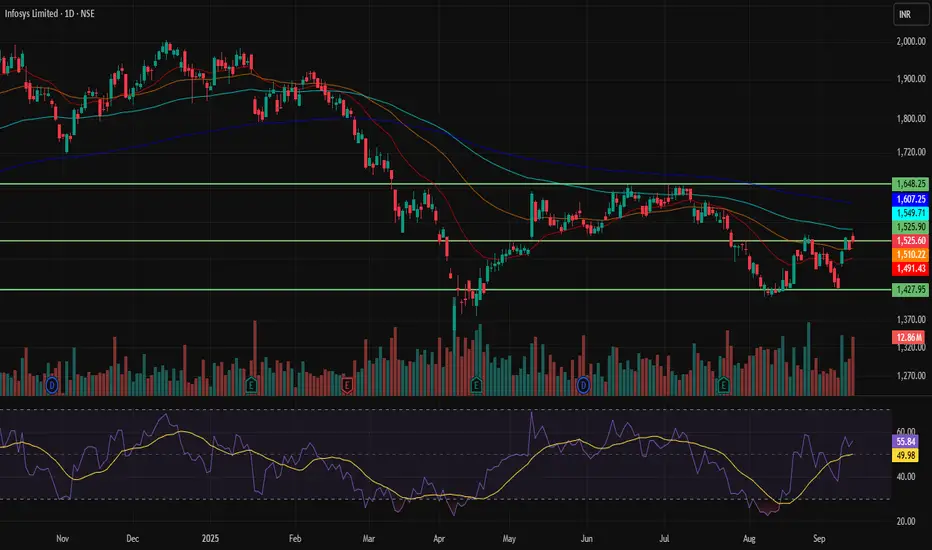
INFY 1D Time frameCurrent Snapshot
Price is trading near ₹1,545.
Stock is holding above the 50-day moving average, showing underlying strength.
Near medium-term averages (100-day and 200-day), so trend is stable with mild bullish bias.
⚙️ Indicators / Momentum
RSI (14): Mid-to-high range, showing steady strength

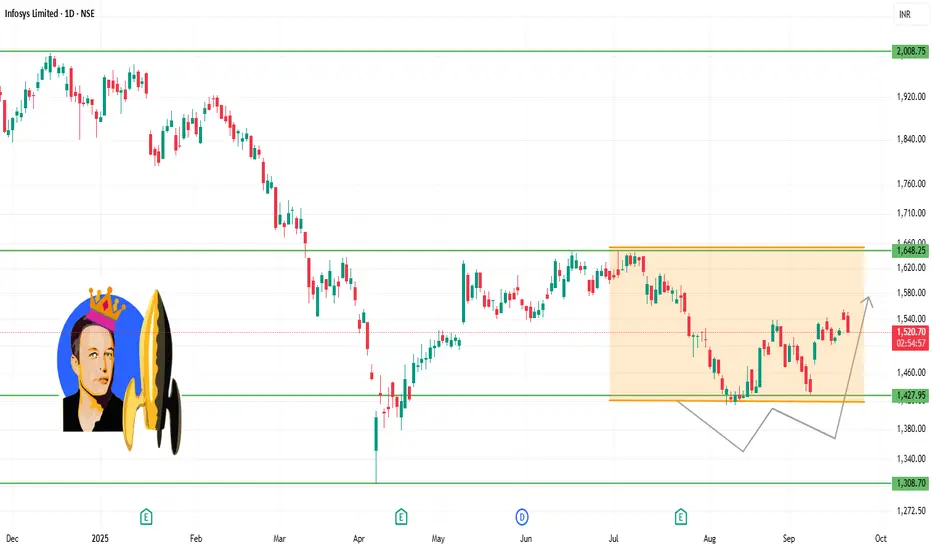
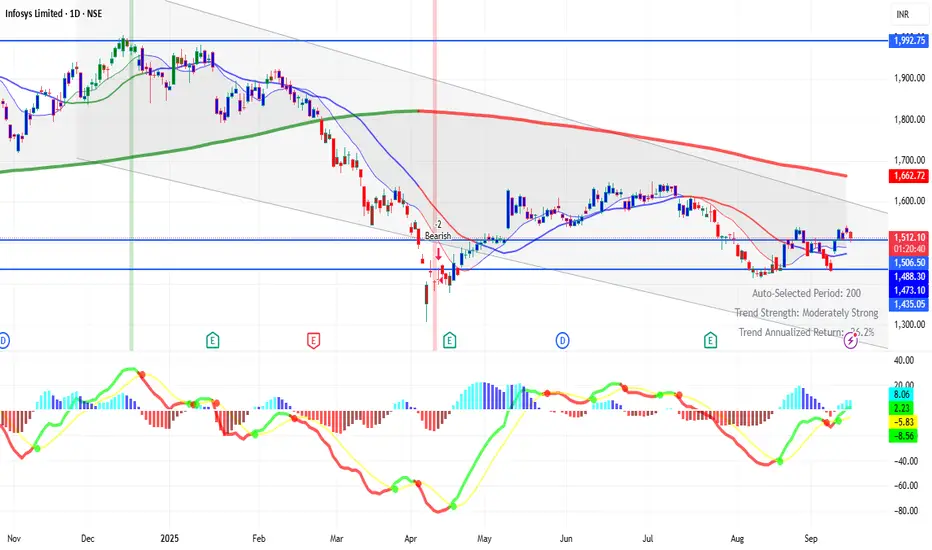
INFY 1D Time frame📍 Current Price & Range
Current Price: ₹1,503.00
Day’s High / Low: ₹1,540.20 / ₹1,499.50
52-week High / Low: ₹2,006.45 / ₹1,307.00
🔍 Key Levels
Immediate Resistance: ₹1,540–₹1,550
Next Resistance: ₹1,600
Immediate Support: ₹1,450–₹1,460
Strong Support: ₹1,400
📊 Indicators & Momentum
Short-
INFY 1D Time frameCurrent Stock Price
Current Price: ₹1,525.60
Day’s Range: ₹1,521.10 – ₹1,542.90
52-Week Range: ₹1,307.00 – ₹2,006.45
Market Cap: ₹6.33 lakh crore
P/E Ratio (TTM): 23.0
EPS (TTM): ₹65.63
Dividend Yield: 2.82%
Book Value: ₹230.65
📈 Trend & Outlook
Short-Term Trend: Bullish; the stock is trad
INFY 1D Time frame📉 Current Market Snapshot
Current Price: ₹1,525.60
Previous Close: ₹1,509.70
Day's Range: ₹1,521.10 – ₹1,542.90
52-Week High: ₹2,006.45
52-Week Low: ₹1,307.00
Market Cap: ₹6,33,794 crore
P/E Ratio: 23.0
Dividend Yield: 2.82%
ROE: 28.72%
Debt-to-Equity Ratio: 0.09
Beta: 1.11
EPS (TTM): ₹6
INFY 1D Time frame🔢 Current Level
Trading near ₹1,525.60
🔑 Key Resistance & Support Levels
Resistance Zones:
~ ₹1,539 – ₹1,552 (near-term resistance)
~ ₹1,560 – ₹1,570 (stronger resistance if price moves higher)
Support Zones:
~ ₹1,510 – ₹1,500 (immediate support)
~ ₹1,470 – ₹1,450 (secondary support)
~ ₹1,3
INFY 1D Time frameCurrent Price: ₹1507 (approx)
Day’s Range: ₹1507 – ₹1543
Previous Close: ₹1509.10
🔹 Support & Resistance
Support 1: ₹1500
Support 2: ₹1490 – ₹1470
Resistance 1: ₹1539 – ₹1552
Resistance 2: ₹1560 – ₹1570
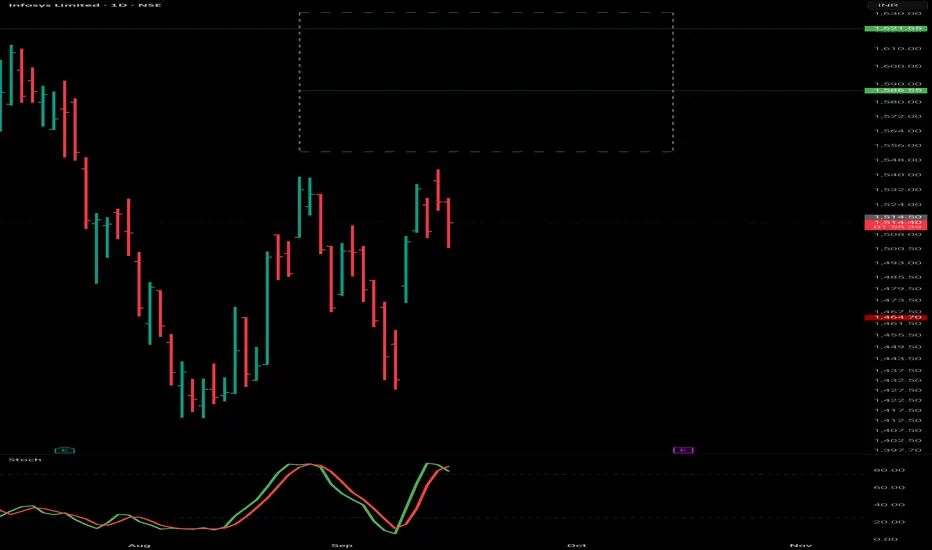
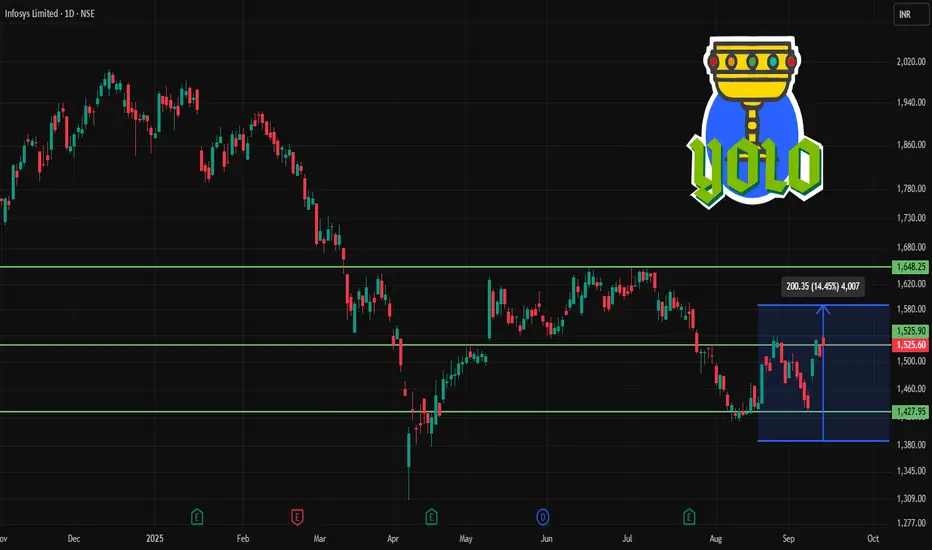
Infosys Turns to BullishBuy @ CMP -1514
Stoploss - 1428.20
Target - 1586.55
1631.00
1750.00
Maintain stoploss strictly. Follow me for update on this calls.
One shot - Clear shot
Happy Trading
Jai Hind
INFY 1D Time frameCurrent Price & Trend
Current Level: ~₹1,525
Trend: Neutral to bullish → stock is slowly recovering from recent lows.
Momentum: Buying support is visible near ₹1,500 zone.
Indicators
RSI: Around 59 → healthy, not yet overbought.
MACD: Positive crossover → signals upward momentum.
Moving Avera
See all ideas
Summarizing what the indicators are suggesting.
Oscillators
Neutral
SellBuy
Strong sellStrong buy
Strong sellSellNeutralBuyStrong buy
Oscillators
Neutral
SellBuy
Strong sellStrong buy
Strong sellSellNeutralBuyStrong buy
Summary
Neutral
SellBuy
Strong sellStrong buy
Strong sellSellNeutralBuyStrong buy
Summary
Neutral
SellBuy
Strong sellStrong buy
Strong sellSellNeutralBuyStrong buy
Summary
Neutral
SellBuy
Strong sellStrong buy
Strong sellSellNeutralBuyStrong buy
Moving Averages
Neutral
SellBuy
Strong sellStrong buy
Strong sellSellNeutralBuyStrong buy
Moving Averages
Neutral
SellBuy
Strong sellStrong buy
Strong sellSellNeutralBuyStrong buy
Displays a symbol's price movements over previous years to identify recurring trends.
Curated watchlists where INFY is featured.

Indian stocks: Racing ahead
46 No. of Symbols
See all sparks