Trade ideas
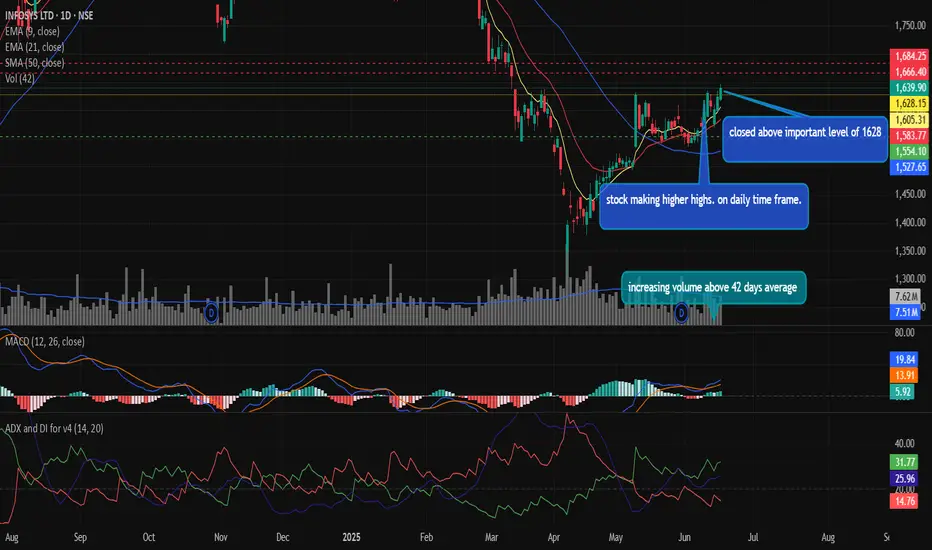
INFOSYS LTD Making higher high trend on daily time frame.Indian IT Sector is witnessing a recovery as most of the IT stocks closed on a postive note. Infosys Ltd being one of the secotral leader is seen making higher highs and higher lows trend on daily time frame as the with above average volume of 42 days (approx 2 Months).
The stock has closed above an important level of 1628 which acted as a hurdle. Now the stocks has suatianed above 1628 level a next resistance level of 1666.40 and 1684.25 seems to be achivabele.
MACD Indicator is alredy trading above zero line which signals postive momentum and alog with it ADX indicator is at 25.95 where +DI is trading above -DI which indicates strenghth in momentum.
let me know your thought in comment below.
INFOSYSOn the daily candle chart there is breakout going to happen in Infosys. If it breaks above 1640-1650 range and closes above it, one can go for long side trade with stop loss below 1570 for the target of 1800

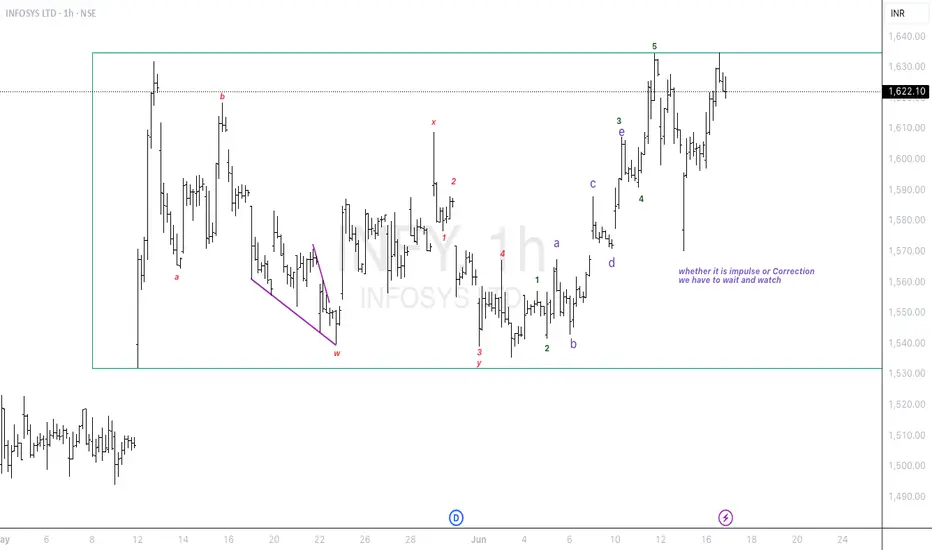
Infosys impulse or correction continuation.....
Elliott Wave Analysis:-
Possibility no.1:-
A corretion has been completed. Now an impulse wave has beed arised.
Possibility no.2:-
After the correction of WXY wave there may be a correction continuation which may form WXYXZ. We have to wait and watch the structure formation.
I am not a SEBI registered advisor. Before taking a trade do your own analysis or consult a financial advisor. I share chart for education purpose only. I share my trade setup.
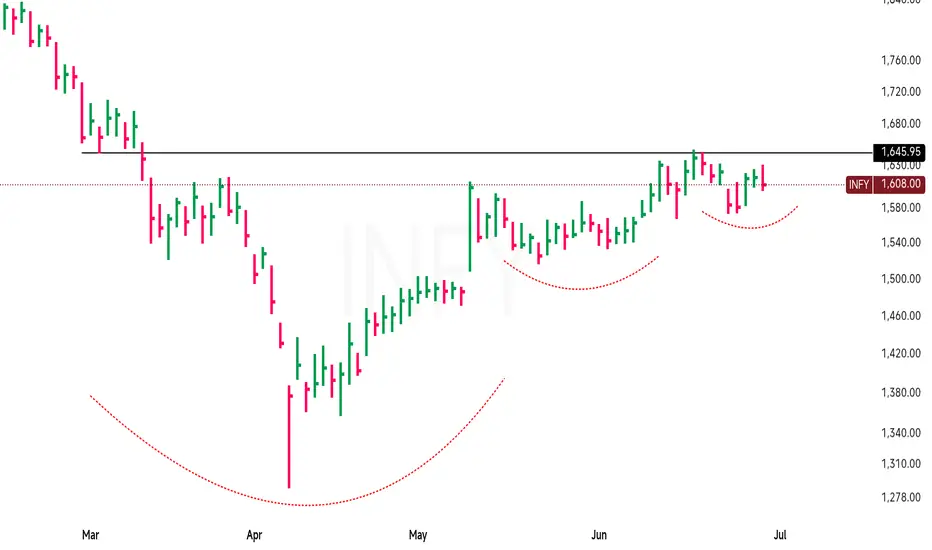
infy formed IH&S pattern on DTFInfosys is displaying a Inverse Head & Shoulder pattern, but breakout has not yet been confirmed. A sustained move above ₹1,635 with strong volume would trigger an upward breakout toward ₹1,750+.
Note : Above view shared only for educational purpose, no any buy or sell recommendations.
Infosys - Bullish Flag and Head & Shoulder Patterns🔍 1. Infosys Current Price Range and Key Levels
Since January 2021, Infosys has been trading in a broad range between ₹1300 and ₹2000, consolidating for over 4 years. Within this range, there are three key support and resistance levels to watch closely:
Support: ₹1300 (major floor)
Intermediate Resistance/Support Zone: ₹1600 – ₹1650
Strong Resistance: ₹2000 (upper bound)
📈 2. Bullish Flag Pattern: A Bullish Flag is a continuation pattern that forms after a strong upward price move "flagpole", followed by a period of consolidation in a narrow downward or sideways channel "flag". It typically signals a pause before the uptrend resumes.
Infosys recently broke out of a bullish flag pattern and crossed above ₹1580 with a strong closing on higher volume, indicating renewed buying interest.
Price is currently trading above the 50-day Exponential Moving Average (EMA), confirming the continuation of the mid-term uptrend.
However, the zone around ₹1650 remains a strong and key resistance level to monitor closely.
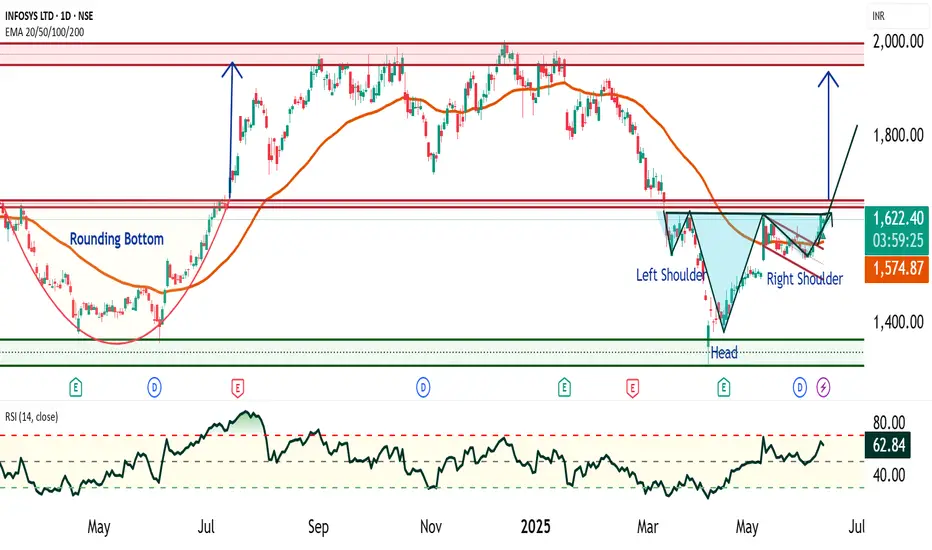
🧩 3. Potential Bullish Head and Shoulders Pattern Above ₹1650
Should Infosys break decisively above ₹1650, it is likely to form another significant bullish pattern known as the Bullish Head and Shoulders.
This pattern signals a trend reversal from bearish to bullish and is considered highly reliable.
Trend: Appears after a downtrend or consolidation, signaling reversal
Touchpoints: Three lows – left shoulder, head (lowest point), and right shoulder, roughly at similar levels
Neckline: The resistance line connecting the highs between shoulders and head
Timeframe: Medium-term, often forming over weeks up to 6 months
Volume: Typically higher volume on left shoulder and head formation, volume dips on right shoulder, and surges on breakout
⚠️ 4. Key Concerns in Infosys Chart Pattern
Price-Volume Divergence: During the head formation, volume increased sharply as price fell — indicating strong selling pressure. However, volume was low when price approached the neckline — suggesting weak buying interest to confirm breakout. This divergence signals potential caution.
Resistance Zone: Price remains below the key resistance at ₹1650, which has acted as a ceiling multiple times. A decisive breakout is required to sustain further upside momentum.
⚠️ Disclaimer
This report is intended solely for educational and training purposes and does not constitute investment advice. Traders and investors should conduct their own research and consult financial advisors before making trading decisions.
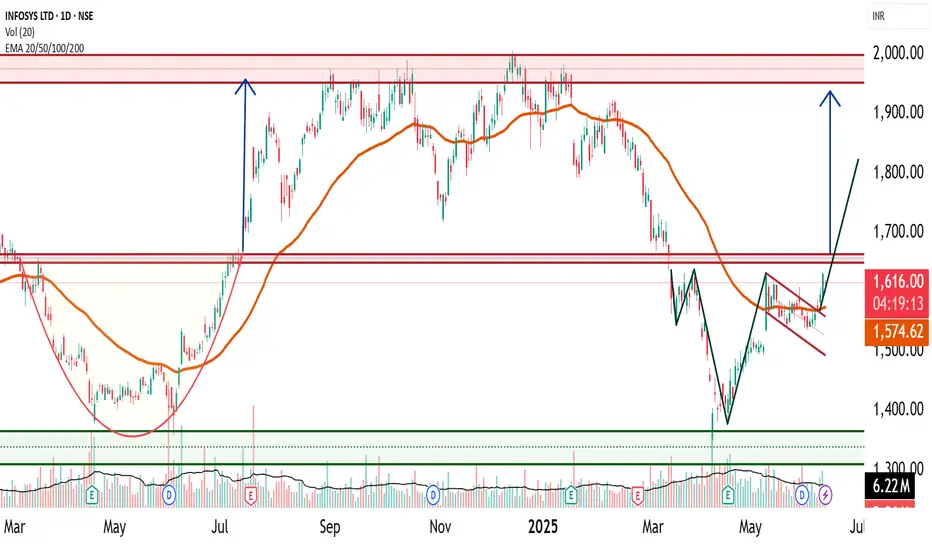
Infosys Technical Research- Flag and Head and shoulders🔍 1. Infosys Current Price Range and Key Levels
Since January 2021, Infosys has been trading in a broad range between ₹1300 and ₹2000, consolidating for over 4 years. Within this range, there are three key support and resistance levels to watch closely:
Support: ₹1300 (major floor)
Intermediate Resistance/Support Zone: ₹1600 – ₹1650
Strong Resistance: ₹2000 (upper bound)
📈 2. Bullish Flag Pattern: A Bullish Flag is a continuation pattern that forms after a strong upward price move "flagpole" , followed by a period of consolidation in a narrow downward or sideways channel "flag". It typically signals a pause before the uptrend resumes.
📊 2. Infosys Recent Technical Development
Infosys recently broke out of a bullish flag pattern and crossed above ₹1580 with a strong closing on higher volume, indicating renewed buying interest.
Price is currently trading above the 50-day Exponential Moving Average (EMA), confirming the continuation of the mid-term uptrend.
However, the zone around ₹1650 remains a strong and key resistance level to monitor closely.
🧩 3. Potential Bullish Head and Shoulders Pattern Above ₹1650
Should Infosys break decisively above ₹1650, it is likely to form another significant bullish pattern known as the Bullish Head and Shoulders (Inverse Head and Shoulders).
Bullish Head and Shoulders
This pattern signals a trend reversal from bearish to bullish and is considered highly reliable.
Trend: Appears after a downtrend or consolidation, signaling reversal
Touchpoints: Three lows – left shoulder, head (lowest point), and right shoulder, roughly at similar levels
Neckline: The resistance line connecting the highs between shoulders and head
Timeframe: Medium-term, often forming over weeks up to 6 months
Volume: Typically higher volume on left shoulder and head formation, volume dips on right shoulder, and surges on breakout
⚠️ 4. Key Concerns in Infosys Chart Pattern
Price-Volume Divergence: During the head formation, volume increased sharply as price fell — indicating strong selling pressure. However, volume was low when price approached the neckline — suggesting weak buying interest to confirm breakout. This divergence signals potential caution.
Resistance Zone: Price remains below the key resistance at ₹1650, which has acted as a ceiling multiple times. A decisive breakout is required to sustain further upside momentum.
⚠️ Disclaimer
This report is intended solely for educational and training purposes and does not constitute investment advice. Traders and investors should conduct their own research and consult financial advisors before making trading decisions.
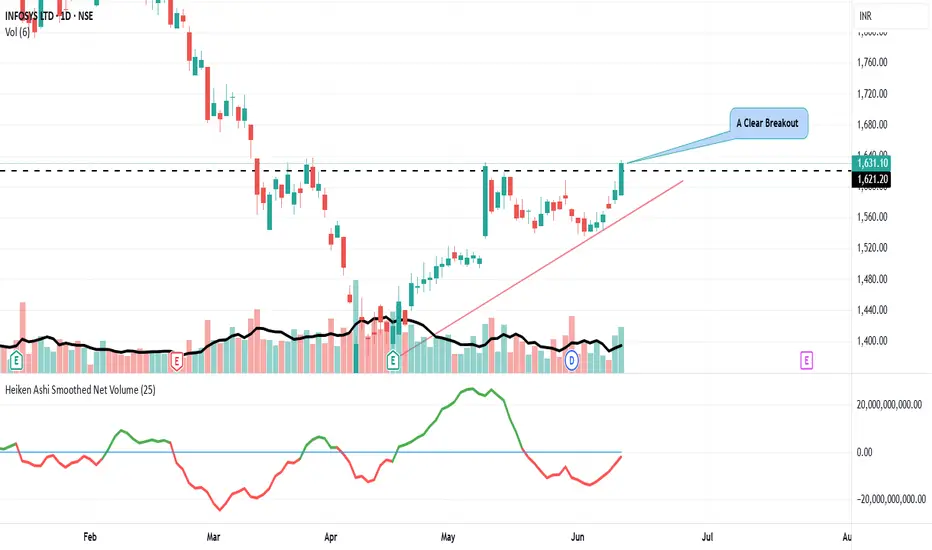
Infy a clean breakoutInfy 1631 has given a clean breakout. Target 1715.
Our earlier posting on 06 June
Infy 1563 is showing signs of bullish for target 1620. Support 1549.
Currently Undervalued and has potential to target 1833.
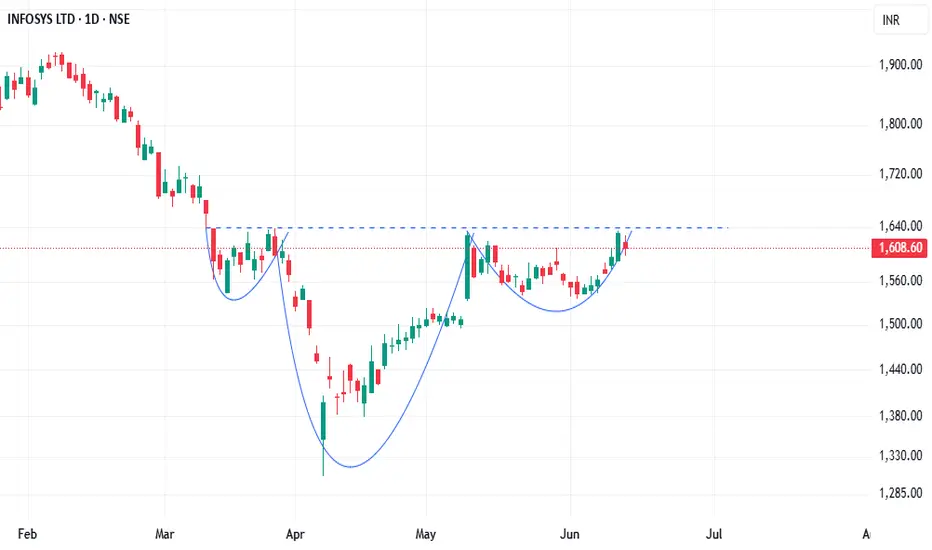
INFY | Watchlist | Need to close above 1631
---
### 📈 **Pattern Overview:**
✅ **Cup and Handle Formation**
* **Cup bottom:** \~₹1,307
* **Handle breakout level:** **₹1,631**
* **Current price:** ₹1,631.10 (testing breakout level)
* A breakout above **₹1,631** would confirm the **Cup and Handle breakout**.
---
### 📊 **Key Chart Levels:**
* **Immediate resistance/trigger level:** ₹1,631
* **Potential target:** Measured move suggests potential upside of **\~₹323**, targeting **\~₹1,950–2,000**
* **Volume:** Increasing volume indicates buying interest.
* **RSI breakout:** RSI trendline breakout supporting momentum.
---
### 🔍 **What’s Next?**
* A daily close above ₹1,631 would confirm the breakout, strengthening the bullish outlook.
* If successful, price may target the previous resistance zone around ₹1,950–2,000.
* Watch for volume to stay elevated on breakout for added confirmation.
---
### 💡 **Key Takeaway:**
INFY is at a crucial breakout level of **₹1,631**, completing a **Cup and Handle** setup. If it clears this level decisively, it could open the door to **a move towards ₹1,950–2,000**.

Infosys Ltd (INFY)Hello Traders !
After a bullish move (5-20 Crossover),
The Infosys Ltd price test the resistance line ! Now near support line. If here create reversal candle this level. So, I expect a bullish move🚀
_______________
TARGET: 1700🎯
Divergence In trading, divergence refers to a scenario where the price of an asset and a technical indicator move in opposite directions, potentially indicating a change in trend momentum. It's a discrepancy between what the price action suggests and what a technical indicator is showing. This discrepancy can signal a possible trend reversal, making it a valuable tool for traders to identify potential entry or exit points.

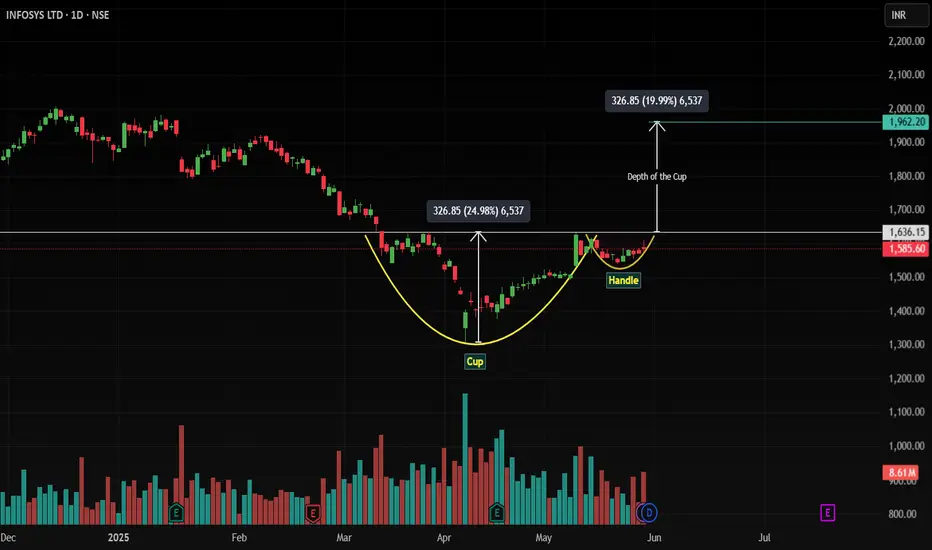
Infosys (INFY): ₹1,636 – The spring coiling for the punch!?NSE: INFY | Timeframe: Daily
Key Technical Observations:
Classic Cup & Handle Formation:
INFY has carved a textbook bullish Cup & Handle pattern on the daily chart, with the "handle" now consolidating tightly near the ₹1,636 resistance.
Price is gathering power for a punchy breakout – reducing volatility and compression signal imminent momentum.
Breakout Trigger at Resistance:
The handle’s consolidation at ₹1,636 shows sellers exhausting, with consistent support from the 50-day EMA.
Watch for a daily close above ₹1,636 to confirm bullish momentum ignition.
Volume-Powered Setup:
Potential surge in volume on breakout would validate the "power gathering" phase.
Trade Strategy:
Entry: Daily close above ₹1,636 (Breakout Confirmation).
Stop Loss: ₹1,530 (below handle low).
Target: ₹1,960 (Measured Move: Cup Depth Projection).
Risk-Reward: 1:3.5 (High-Probability Setup).
Why Trade This?
Pattern Strength: Cup & Handle is a high-probability continuation pattern – especially with 50-EMA confluence.
Sector Alignment: IT index resilience supports INFY’s breakout potential.
Clear Catalyst: Breakout above ₹1,636 opens path for explosive move toward ₹1,960.
DISCLAIMER:
This analysis is for educational purposes only. Not financial advice. Trading involves substantial risk. Past performance doesn’t guarantee future results. Always conduct your own research, consider risk management, and consult a SEBI-registered advisor before trading. Pattern success rates vary based on market conditions.
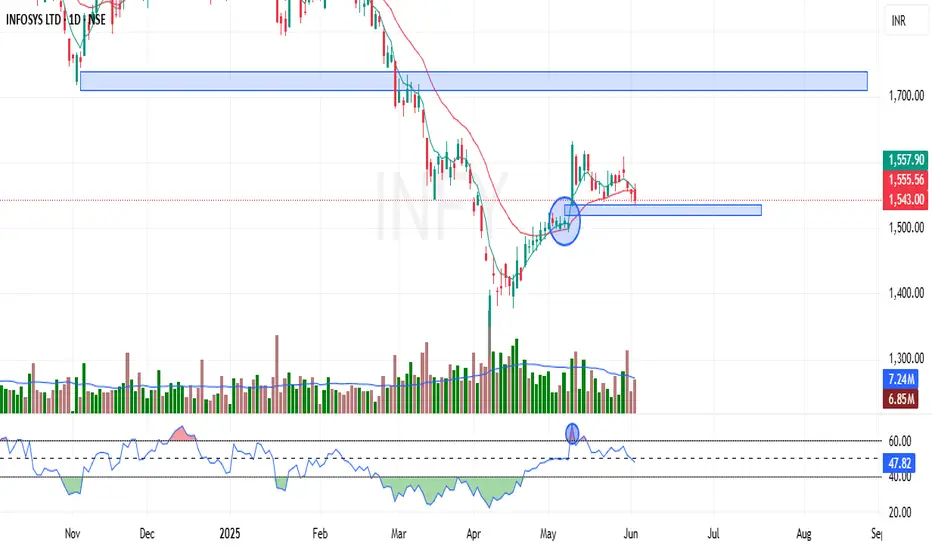
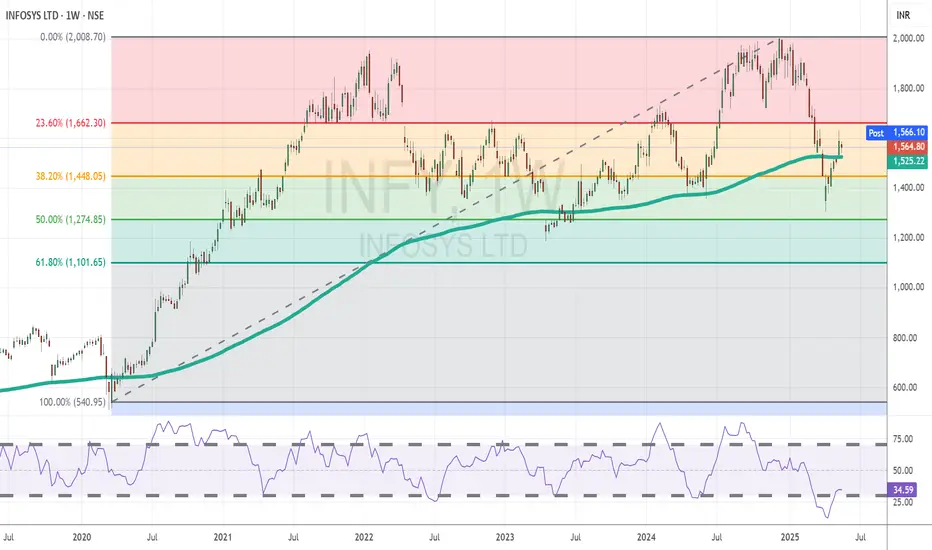
Infy Attempts Breakout After Rebounding from Key Fibonacci SuppoTopic Statement:
Infosys is showing signs of a steady recovery after a deep correction, though key resistance levels still challenge the upward momentum.
Key Points:
The stock found strong support at the 50% Fibonacci retracement during the recent correction, indicating solid buying interest at lower levels.
As the price recovers, the 23.6% Fibonacci level is acting as resistance, slowing the upward move.
Trading just above the 180-day EMA, Infosys remains technically oversold, hinting at continued recovery potential if resistance is breached.
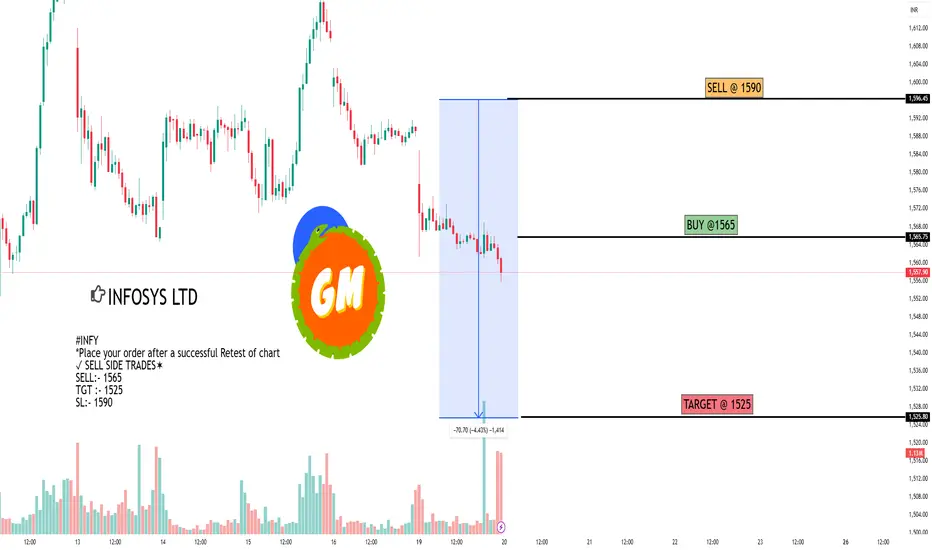
INFOSYS LTDAs of the close on Monday, May 19, 2025, Infosys Ltd (NSE: INFY) traded at ₹1,559.80, reflecting a decrease of ₹30.10 or 1.89% from the previous session.
In the 15-minute timeframe, the stock exhibited a downward trend throughout the day, with prices ranging between ₹1,555.70 and ₹1,585.00.
Technical Indicators (15-Minute Timeframe):
Moving Averages: The 20-period Exponential Moving Average (EMA) is trending downward, indicating short-term bearish momentum.
Relative Strength Index (RSI): The RSI is hovering around 45, suggesting that the stock is approaching oversold territory but hasn't reached it yet.
Support Levels: Immediate support is observed around ₹1,550, with a stronger support level near ₹1,540.
Resistance Levels: The stock faces resistance at ₹1,570, followed by a more significant resistance near ₹1,585.
Outlook:
If Infosys maintains its position above the ₹1,550 support level, a short-term rebound towards ₹1,570 is possible. However, a break below ₹1,550 could lead to further declines, potentially testing the ₹1,540 support.
Database Trading part 3Trading data is typically collected from stock exchanges such as the New York Stock Exchange (NYSE) or NASDAQ. This can be a useful source for trades that are made over the listed exchanges and can provide many different data poitns, such as trade prices and times.

Database Trading part 2Trading data is typically collected from stock exchanges such as the New York Stock Exchange (NYSE) or NASDAQ. This can be a useful source for trades that are made over the listed exchanges and can provide many different data poitns, such as trade prices and times.

Infosys : Anticipating Handsome Return (45% from now)Hi friends,
Target & Stoploss are mentioned on the self explanatory chart .
please don`t go with the buzz around you regarding the stocks and stock market .
Please follow what Technical chart & analysis is conveying .
Infosys is a large cap & profitable company for quite a long .
Please feel free to comment or share your views on my analysis .
Note : I am not SEBI registered advisor . Please consider my analysis for education purpose only .

Infosys LTD. Strong Support W1 Chart | Support & ResistanceSupport & Resistance Strategy:
Stock Price tried to break the Price zone but failed.
MACD - Signal Line break
RSI - confirming uptrend

Infosys (Global leader in consulting, technology)Infosys (INFY) Overview
Infosys is a global leader in consulting, technology, and outsourcing services, headquartered in Bengaluru, India. Founded in 1981 by N. R. Narayana Murthy and six engineers, it is a pioneer in India's IT revolution and serves clients across 56+ countries.
Key Offerings
Digital Services:
Cloud computing, AI/ML, data analytics, IoT, blockchain, and cybersecurity solutions.
Consulting:
Business strategy, process optimization, and digital transformation for enterprises.
Software Development:
Custom IT solutions, ERP (e.g., SAP, Oracle), and application maintenance.
Outsourcing:
IT infrastructure management, BPO (business process outsourcing), and automation.
Global Presence:
Operates in 50+ countries with major offices in the US, Europe, Australia, Asia, and the Middle East. Serves Fortune 500 companies across industries like banking, healthcare, retail, and manufacturing.
Innovation & Technology
Infosys Cobalt: Cloud-based suite for enterprise digital transformation.
Living Labs: AI-driven R&D hubs for cutting-edge tech like metaverse and quantum computing.
Sustainability: Committed to carbon neutrality by 2040, ESG initiatives, and green IT solutions.
Infosys | More pain left i n the stock🚨 INFOSYS RESULTS DISAPPOINT! 🚨
Topline? Missed. Bottom-line? Missed. And the pain might not be over yet…
📉 Downside Alert:
Stock looks ready to slide into the ₹1150–₹1000 zone — a strong quarterly support area where it could start building a base.
📈 Upside Resistance:
Any bounce? Expect serious resistance between ₹1525–₹1600 — that’s the 200W-EMA zone, plus the monthly 20EMA hovering around there. Tough to break!
📊 Valuation Check:
Trading at a P/E of ~22 (5Y Avg: ~27)
Intrinsic Value: ₹1050–₹1100
✅ Looks fundamentally cheap, BUT poor guidance + volatility = limited upside for now.
💡 Takeaway:
If you’re looking to accumulate, closer to the ₹1000–₹1150 demand zone might be your best bet. Don’t chase—be patient.
#Infosys #Stocks #StockMarket #Investing #TechStocks #INFY #niftyit

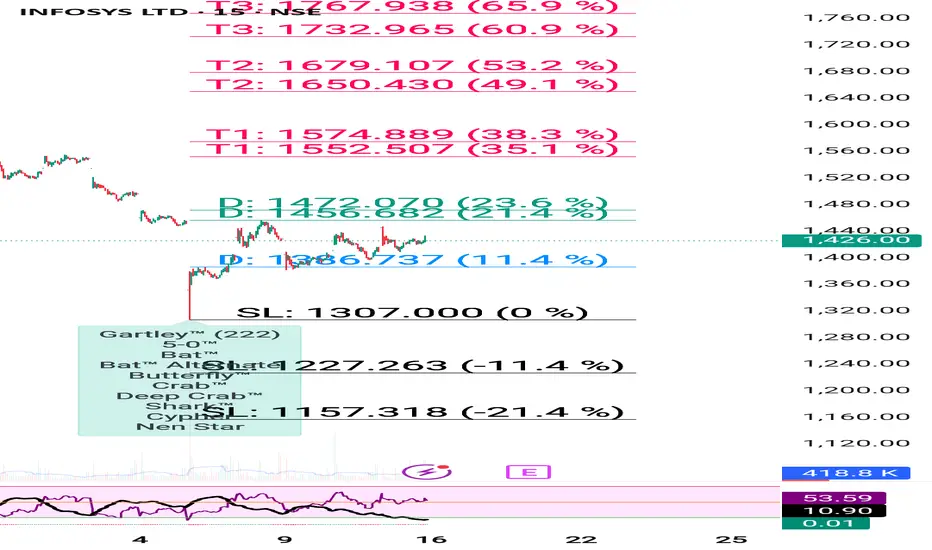
Infosys bhy near 1350-1320 for long term How to take trades using Harmonic pattern projection Trade setup is explained below :-
Entry : 1st SL point : 0% is recent top or bottom.
Trailing D: 11.4% is work as trailing SL of buy or sell trade if hit then we have to book profit
.If price goes below 2nd D 21.4% to 23.6% range then early traders can make fresh reversals trade after breaking 1st D 11.4% safe traders can reversal trade after breaking Point D 21.4% to 23.6% range
Targets :
Target T1 : 35.1% to 38.3%
Target T3 : 49.1% to 53.2%
T3: 60.9% to 64.8% is our 3rd Target since this is reversal zone so must book profit if break then take fresh trade again
Target T4 : 76.4% to 79.7%
Next Targets are 100% , 127.2% ,141.4% and final Target 161.8%.
How to take reversal trade :
If price going upside/ downside then then buy or sell levels appear on Chart ( Automatically show when price reach any reversal zone of harmonic projection pattern based .
After showing reversal levels wait for confirmation until 21.4% or 28.3 % level not break if break then exit from current buy / sell trade and take fresh reverse trade buy/ sell .
Trailing SL:
After reach 1st Target trail SL to just above or below cost ( for example we are holding sell trade from 100 1st Target 110 hit then move trailing sl to 104-105 and move SL as price move upside or Downside)
Re- Entry :
For Re-entry in any pull back Point D ( 11.4% ) is used for re-entry then SL recent high or low Point SL ( 0% ) .
Blue Line is 1st support/ Resistance
Green line is 2nd support/ resistance
Red line is 3rd Support/ resistance
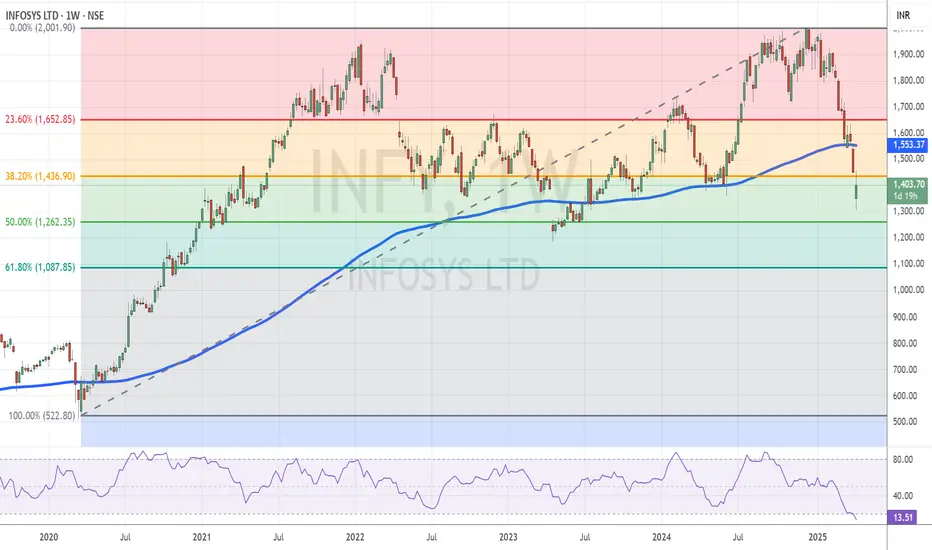
Infosys Turns Extremely Oversold After Deep CorrectionTopic Statement:
Infosys has witnessed a deep correction and is currently trading in an extremely oversold zone, indicating a possible pause or reversal in the downtrend.
Key Points:
- Price is attempting to hold above the 38.2% Fibonacci retracement level at ₹1436.
- Trading below the 180-day EMA signals an oversold condition.
- Weekly Money Flow Index (MFI) is at 13.5, highlighting that the stock is extremely oversold.
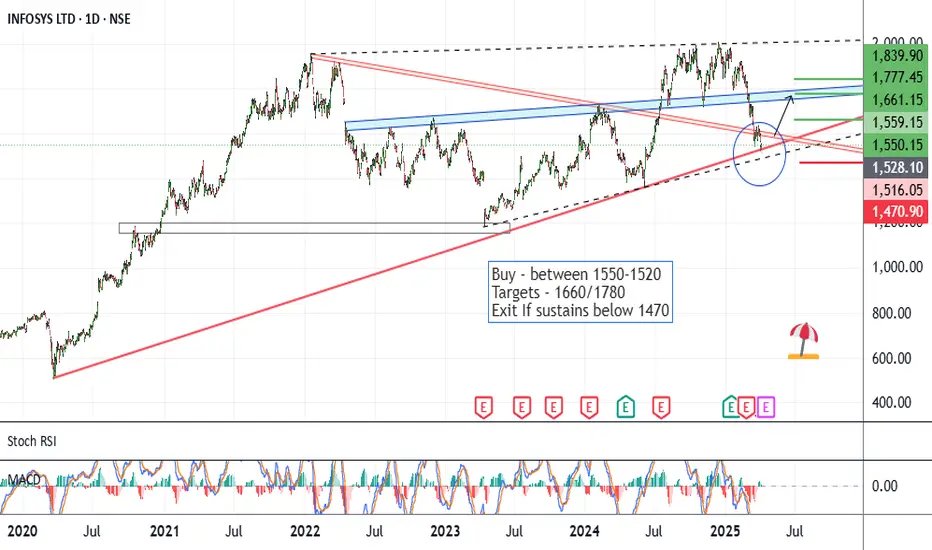
Infy - Long SetupCMP 1550 on 03.04.25
The chart marks all the important levels. The stock price has corrected by around 25% in recent weeks. According to the above setup, it seems to be on the supports.
If it reverses from these levels, it may go into a bullish phase ahead. Possible targets may be 1660/1780/1840.
The setup will lose significance if the price sustains below 1470.
One should keep the position size according to risk management.
All these illustrations are only for learning and sharing purposes, not a trading recommendation.
All the best.