What does Infosys chart say?Infosys is a global leader in IT services and consulting, headquartered in Bangalore, India. It was founded in 1981 by Narayana Murthy and a group of co-founders. The company provides services such as software development, business consulting, and IT outsourcing.
### **Key Facts About Infosys:**
- **Headquarters:** Bangalore, India
- **Founded:** 1981
- **CEO:** **Salil Parekh** (as of the latest update)
- **Revenue:** Over **$18 billion** (FY 2023)
- **Employees:** Over **300,000**
- **Stock Listings:** Traded on **NSE, BSE (India), and NYSE (U.S.)**
- **Industry Focus:** IT services, cloud computing, AI, automation, cybersecurity, and digital transformation.
### **Services Provided:**
- Application Development & Maintenance
- Cloud & Infrastructure Services
- Data Analytics & AI
- Cybersecurity Solutions
- Digital Marketing & Consulting
- Engineering Services
### **Notable Achievements:**
- Among the **top IT companies** in India and globally.
- First Indian company to be listed on **NASDAQ** in 1999.
- Consistently ranks among the **top employers** for IT professionals.
Trade ideas

Infosys Share Price Update Infosys Limited is an Indian multinational technology company specializing in business consulting, information technology, and outsourcing services. Founded in 1981 and headquartered in Bengaluru, Infosys has grown to become the second-largest Indian IT company by revenue and market capitalization. citeturn0search7
The company offers a wide range of services, including software development, maintenance, and independent validation across various industries such as finance, insurance, and manufacturing. Through its subsidiary, Infosys Consulting, it provides expertise in digital experience, cloud computing, data analytics, artificial intelligence, engineering, and sustainability. Another subsidiary, Infosys BPM, focuses on outsourcing services for business processes like finance, procurement, customer service, and human resources. citeturn0search7
Infosys has developed several digital products and platforms aimed at facilitating digital transformation for businesses. Notable offerings include Finacle, a banking solution that enhances customer service capabilities for financial institutions; Panaya, a platform designed to accelerate application delivery and innovation; and Infosys Equinox, a digital commerce platform that provides personalized shopping experiences. citeturn0search7
As of March 2024, Infosys employed over 343,000 individuals worldwide, with a significant presence in India. The company's Global Education Centre in Mysore is recognized as the world's largest corporate university, capable of training up to 14,000 employees simultaneously across various technologies. citeturn0search7
In recent developments, a leaked recruiter email suggested that candidates with experience at companies like Infosys, Wipro, and TCS were deemed "not the right fit" for certain U.S. positions, highlighting challenges related to visa sponsorships. citeturn0search3
For more detailed information about Infosys and its services, you can visit their official

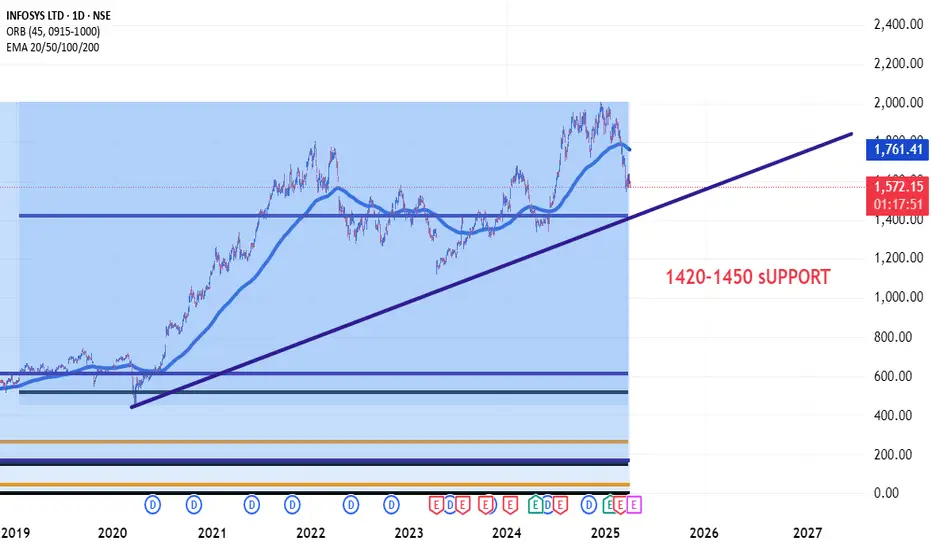
Infosys Downside Target Is 1450Infosys is a global leader in IT services and consulting, headquartered in Bangalore, India. It was founded in 1981 by Narayana Murthy and a group of co-founders. The company provides services such as software development, business consulting, and IT outsourcing.
### **Key Facts About Infosys:**
- **Headquarters:** Bangalore, India
- **Founded:** 1981
- **CEO:** **Salil Parekh** (as of the latest update)
- **Revenue:** Over **$18 billion** (FY 2023)
- **Employees:** Over **300,000**
- **Stock Listings:** Traded on **NSE, BSE (India), and NYSE (U.S.)**
- **Industry Focus:** IT services, cloud computing, AI, automation, cybersecurity, and digital transformation.
### **Services Provided:**
- Application Development & Maintenance
- Cloud & Infrastructure Services
- Data Analytics & AI
- Cybersecurity Solutions
- Digital Marketing & Consulting
- Engineering Services
### **Notable Achievements:**
- Among the **top IT companies** in India and globally.
- First Indian company to be listed on **NASDAQ** in 1999.
- Consistently ranks among the **top employers** for IT professionals.
Do you need information about Infosys careers, stock performance, or something else? 😊
Stop loss to infyI was posted buying call on infy but i had forgotten provided stop loss for that call
Stop loss 1570 on daily closing price

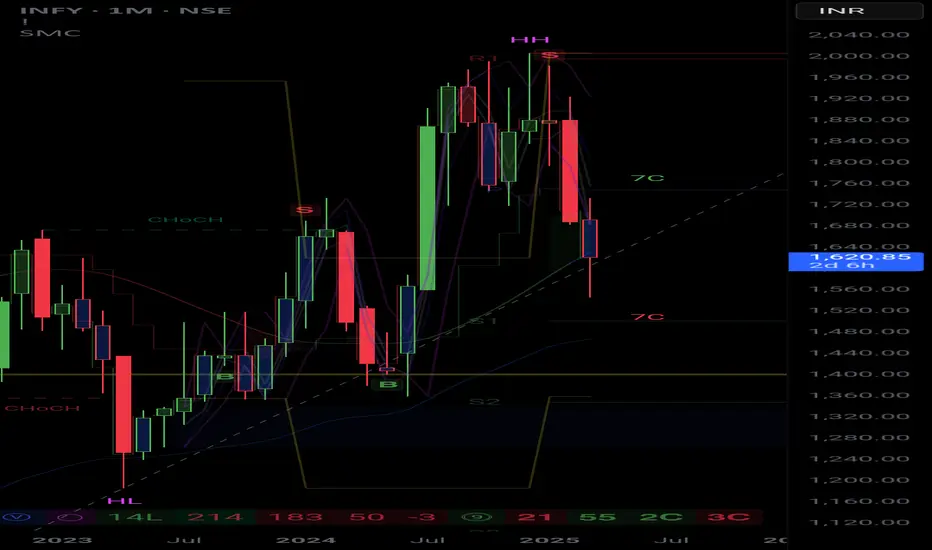
Infosys (INFY) Stock Forecast – March 2025Infosys (INFY) Stock Forecast – March 2025
Current Price: ₹1,619.50
Timeframe: Monthly Chart (1M)
Technical Analysis & Forecast
1. Trendline Support: The stock is currently testing a key trendline support on the monthly chart.
2. Breakdown Possibility: If INFY closes below this trendline, it may head towards the ₹1,400 level, aligning with the S2 support zone.
3. Resistance Levels: The recent rejection from ₹1,850-1,900 suggests strong selling pressure at those levels.
4. Market Structure:
Lower highs (LH) formation indicates a possible bearish continuation.
Change of character (ChoCH) signals uncertainty in trend direction.
5. Indicators:
Moving Averages: INFY is testing its long-term moving averages. A break below these could accelerate the downside.
Volume & Momentum: Selling pressure has increased, and bulls need to reclaim key resistance levels for a recovery.
My View
INFY is taking trendline support this month. If this support is broken, we can expect ₹1,400 as the next downside target. However, if buyers defend this level, a rebound towards ₹1,750 is possible.
Disclaimer
This analysis is for educational and informational purposes only. It is not financial advice. Please conduct your own research or consult with a professional before making any trading decisions.
Long on infosysA bullish candle formed with decent volumes after long wicked doji. It indicates stock has enter into bunying momentum as well as IT iindex also closed in green it shown the buyers has interest in IT sector stocks.
Entering price : 1610
1st target : 1670
2nd target : 1710

infosys bullish view from hereInfosys is a global leader in consulting, technology, and outsourcing solutions. Founded in 1981 by Narayana Murthy and six other engineers, the company is headquartered in Bengaluru, India. Infosys is known for providing a wide range of services, including:
1. **Consulting**: Helping businesses with strategy, process improvement, and digital transformation.
2. **Technology Services**: Offering IT infrastructure services, software development, and system integration.
3. **Business Process Outsourcing (BPO)**: Outsourcing services for various business functions like finance, human resources, and customer service.
Infosys operates across industries such as finance, healthcare, manufacturing, and retail, serving clients globally. The company has grown to become one of India's most prominent tech firms, with a significant presence in North America, Europe, and other parts of the world.
Infosys also has a strong focus on research and development, digital services, and AI-driven solutions. They are actively involved in training the next generation of tech professionals through their "Infosys Springboard" platform and the "Infosys Leadership Institute."
Buy Infosys near 1560-1550 , we will see bounce on IT stocks How to take trades using Harmonic pattern projection Trade setup is explained below :-
Entry : 1st SL point : 0% is recent top or bottom.
Trailing D: 11.4% is work as trailing SL of buy or sell trade if hit then we have to book profit
.If price goes below 2nd D 21.4% to 23.6% range then early traders can make fresh reversals trade after breaking 1st D 11.4% safe traders can reversal trade after breaking Point D 21.4% to 23.6% range
Targets :
Target T1 : 35.1% to 38.3%
Target T3 : 49.1% to 53.2%
T3: 60.9% to 64.8% is our 3rd Target since this is reversal zone so must book profit if break then take fresh trade again
Target T4 : 76.4% to 79.7%
Next Targets are 100% , 127.2% ,141.4% and final Target 161.8%.
How to take reversal trade :
If price going upside/ downside then then buy or sell levels appear on Chart ( Automatically show when price reach any reversal zone of harmonic projection pattern based .
After showing reversal levels wait for confirmation until 21.4% or 28.3 % level not break if break then exit from current buy / sell trade and take fresh reverse trade buy/ sell .
Trailing SL:
After reach 1st Target trail SL to just above or below cost ( for example we are holding sell trade from 100 1st Target 110 hit then move trailing sl to 104-105 and move SL as price move upside or Downside)
Re- Entry :
For Re-entry in any pull back Point D ( 11.4% ) is used for re-entry then SL recent high or low Point SL ( 0% ) .
Blue Line is 1st support/ Resistance
Green line is 2nd support/ resistance
Red line is 3rd Support/ resistance

bearish view Till VWAP Support**Infosys** is a multinational information technology (IT) services and consulting company headquartered in **Bengaluru, India**. It is one of the largest IT companies in the world and is part of the **Big Four** Indian IT firms (along with **TCS**, **Wipro**, and **HCL**).
### **Key Facts**
- **Founded:** 1981 by Narayana Murthy, Nandan Nilekani, and six others
- **Headquarters:** Bengaluru, Karnataka, India
- **CEO:** Salil Parekh (as of the latest update)
- **Employees:** Over 300,000 globally
- **Revenue:** Over $18 billion (FY 2023)
- **Stock Listings:**
- NSE: INFY
- BSE: 500209
- NYSE: INFY
### **Services and Offerings**
Infosys provides a wide range of services, including:
✅ IT consulting and strategy
✅ Software development and maintenance
✅ Business Process Outsourcing (BPO)
✅ Cloud and infrastructure services
✅ Artificial Intelligence and machine learning solutions
✅ Cybersecurity
✅ Enterprise resource planning (ERP)
✅ Data analytics and digital transformation
### **Major Products and Platforms**
- **Finacle** – Core banking solution
- **Infosys NIA** – Artificial Intelligence platform
- **EdgeVerve** – Automation and AI-powered business applications
- **Infosys Equinox** – Digital commerce platform
### **Global Presence**
Infosys operates in over **50 countries**, with major delivery and innovation hubs in:
🌍 United States
🌍 Europe (UK, Germany, France)
🌍 Australia
🌍 Asia (India, China, Japan)
### **Reputation and Achievements**
- Consistently ranked among the **top IT service providers** globally
- Recognized for its sustainability and corporate governance initiatives
- Strong focus on **employee training** and **development** through the Infosys Global Education Center

INFY Trading Within Demand Zone (1548.85-1535.0)The stock INFY is currently trading at 1579.85, within its demand zone ranging from 1548.85 to 1535.0. The last leg out occurred on 2024-06-27.
Disclaimer: This analysis is for informational purposes only and should not be considered financial advice. Please perform your own due diligence or consult a financial advisor before making any investment or trading decisions.

Infosys start buying for long term near 1540-1520 upside 1950+++How to take trades using Harmonic pattern projection Trade setup is explained below :-
Entry : 1st SL point : 0% is recent top or bottom.
Trailing D: 11.4% is work as trailing SL of buy or sell trade if hit then we have to book profit
.If price goes below 2nd D 21.4% to 23.6% range then early traders can make fresh reversals trade after breaking 1st D 11.4% safe traders can reversal trade after breaking Point D 21.4% to 23.6% range
Targets :
Target T1 : 35.1% to 38.3%
Target T3 : 49.1% to 53.2%
T3: 60.9% to 64.8% is our 3rd Target since this is reversal zone so must book profit if break then take fresh trade again
Target T4 : 76.4% to 79.7%
Next Targets are 100% , 127.2% ,141.4% and final Target 161.8%.
How to take reversal trade :
If price going upside/ downside then then buy or sell levels appear on Chart ( Automatically show when price reach any reversal zone of harmonic projection pattern based .
After showing reversal levels wait for confirmation until 21.4% or 28.3 % level not break if break then exit from current buy / sell trade and take fresh reverse trade buy/ sell .
Trailing SL:
After reach 1st Target trail SL to just above or below cost ( for example we are holding sell trade from 100 1st Target 110 hit then move trailing sl to 104-105 and move SL as price move upside or Downside)
Re- Entry :
For Re-entry in any pull back Point D ( 11.4% ) is used for re-entry then SL recent high or low Point SL ( 0% ) .
Blue Line is 1st support/ Resistance
Green line is 2nd support/ resistance
Red line is 3rd Support/ resistance

Lecture for option trader# **Lecture for Option Traders**
Options trading provides **flexibility, leverage, and risk management**, making it ideal for traders seeking strategic market exposure.
## **1️⃣ Understanding Option Basics**
✅ **Call Options:** Right to **buy** at a fixed price (bullish).
✅ **Put Options:** Right to **sell** at a fixed price (bearish).
✅ **Strike Price & Expiry:** Determines profitability based on market movement.
## **2️⃣ Key Option Trading Strategies**
✅ **Directional Strategies:** Buying calls/puts based on market trends.
✅ **Hedging Strategies:** Using options to protect against losses (e.g., protective put).
✅ **Income Strategies:** Writing covered calls or selling cash-secured puts for steady returns.
## **3️⃣ Advanced Concepts**
✅ **Implied Volatility (IV):** Affects option pricing & premiums.
✅ **Option Greeks:** Delta, Gamma, Theta, Vega help manage risk & profitability.
### **Conclusion**
Mastering **option strategies, risk management, and market analysis** helps traders enhance returns and minimize losses effectively. 🚀

Trading Ideas for Infosys (INFY) – Counter-Trend1. 🔴Bearish Opportunity (Selling Pressure Zone)
Key Resistance Area: 1,793.05 - 1,818.55 (Bearish Order Block + Fair Value Gap)
Plan: If the price moves into this zone and shows rejection (wicks, strong red candles, or divergence), it could turn lower.
Potential Targets:
1,688.00 (Bullish Fair Value Gap) – First exit
1,589.30 (Major Bullish Fair Value Gap) – Extended move
If price breaks above 1,820, the downside setup weakens, indicating possible continuation upward.
2. 🟢Bullish Opportunity (Buying Interest Zone)
Key Support Area: 1,478.15 - 1,407.25 (Bullish Order Blocks)
Plan: If price reaches this area and shows signs of support (long wicks, strong green candles, or bullish divergence), it could turn higher.
Potential Targets:
1,589.30 (Bullish Fair Value Gap) – First exit
1,688.00 (Next resistance zone)
If price breaks below 1,400, the upside setup weakens, and further decline is possible.
If 1,793 is rejected, a short-term move down is likely.
If 1,478 holds as support, an upward move may develop.
A break of these zones could signal further momentum in that direction.
Disclaimer: This analysis is for informational and educational purposes only and should not be considered financial advice. Market conditions can change rapidly, and past performance is not indicative of future results. Always conduct your own research and consult with a professional before making any financial decisions. Trade responsibly.

Bearish pattern in InfosysIt is a clear neckline breakout with strong displacement candle. This confirms that the price will fall in upcoming days upto D point. This is for educational purposes only.

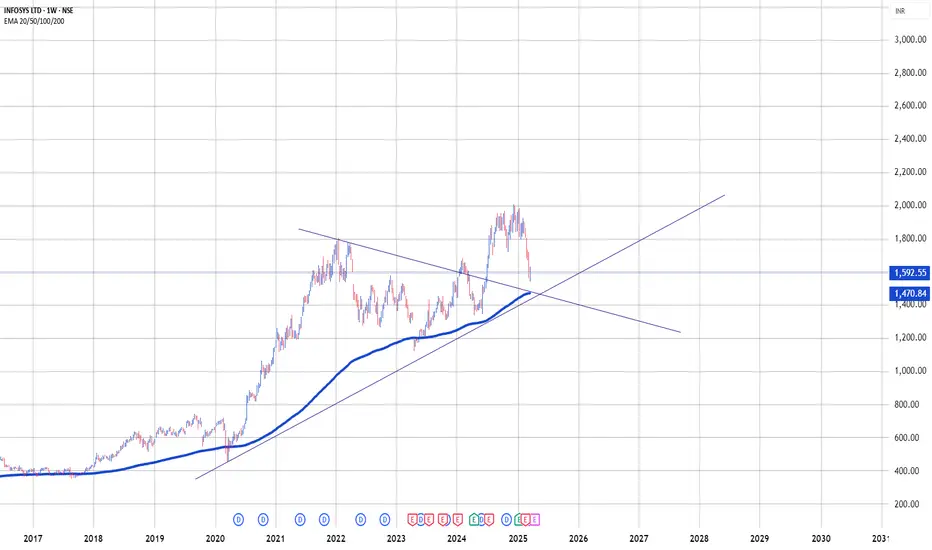
Infosys Stuck Below 50 Weeks EMA MY View is Bearish Still Cont..Infosys Stuck Below 50 Weeks EMA MY View is Bearish Till Infosys Sustained Below 50 Weeks EMS

Buy Infosys for long term 1630-1620 upside Target 1950++How to take trades using Harmonic pattern projection Trade setup is explained below :-
Entry : 1st SL point : 0% is recent top or bottom.
Trailing D: 11.4% is work as trailing SL of buy or sell trade if hit then we have to book profit
.If price goes below 2nd D 21.4% to 23.6% range then early traders can make fresh reversals trade after breaking 1st D 11.4% safe traders can reversal trade after breaking Point D 21.4% to 23.6% range
Targets :
Target T1 : 35.1% to 38.3%
Target T3 : 49.1% to 53.2%
T3: 60.9% to 64.8% is our 3rd Target since this is reversal zone so must book profit if break then take fresh trade again
Target T4 : 76.4% to 79.7%
Next Targets are 100% , 127.2% ,141.4% and final Target 161.8%.
How to take reversal trade :
If price going upside/ downside then then buy or sell levels appear on Chart ( Automatically show when price reach any reversal zone of harmonic projection pattern based .
After showing reversal levels wait for confirmation until 21.4% or 28.3 % level not break if break then exit from current buy / sell trade and take fresh reverse trade buy/ sell .
Trailing SL:
After reach 1st Target trail SL to just above or below cost ( for example we are holding sell trade from 100 1st Target 110 hit then move trailing sl to 104-105 and move SL as price move upside or Downside)
Re- Entry :
For Re-entry in any pull back Point D ( 11.4% ) is used for re-entry then SL recent high or low Point SL ( 0% ) .
Blue Line is 1st support/ Resistance
Green line is 2nd support/ resistance
Red line is 3rd Support/ resistance

InfosysDate 04.03.2025
Infosys : day chart
Remark :
Emerging death crossover !
1 A death crossover occurs when 20 ema crosses from above to below 200 ema.
2 Death crossover is considered more significant when accompanied by high trading volume.
3 Keep a watch on open interest data as well as put call ratio (pcr)
4 Wat till EOD & if death crossover completes then if price goes todays low, short
5 Support/resistance zone is critical as stoploss for swing traders
Regards,
Ankur

Infosys Mein Jung Jaari Hai Mera Bearish View AAPka Kya Hai ?Infosys is a global leader in technology services and consulting, headquartered in Bangalore, India. It was founded in 1981 and has since grown into one of the largest IT services companies in the world. Infosys provides services in areas such as:
- **IT Consulting & Services** – Application development, cloud computing, cybersecurity, AI, and automation.
- **Business Process Outsourcing (BPO)** – Customer service, finance, and HR outsourcing.
- **Digital Transformation** – Helping businesses adopt new technologies like blockchain, IoT, and big data.
- **Products & Platforms** – Includes Finacle (a core banking solution) and EdgeVerve (AI & automation solutions).
Infosys has a strong presence worldwide, serving clients in banking, healthcare, retail, and other industries. The company is known for its innovation, focus on sustainability, and employee-friendly work culture.
Are you looking for something specific about Infosys? Like job opportunities, stock prices, or company history?

INFOSYS DOUBLE TOPDouble top formed in weekly chart and treading near the neckline of the double top
incase this neckline breaks this stock might fall further.
This analysis is my own idea.
I don't recommend taking trade based on this idea.
consult your SEBI registered adviser to Know the market risk before.
in.tradingview.com

MACD trading**SkyTradingZone** is your go-to source for educational content on trading, covering market insights, strategies, and in-depth analysis. Our goal is to empower traders and investors with knowledge to navigate the markets effectively.
---
# **What is MACD Trading?**
MACD (Moving Average Convergence Divergence) is one of the most powerful and widely used indicators in technical analysis. It helps traders identify **trend direction, momentum shifts, and potential reversals** in the stock market, forex, and crypto markets.
---
## **1️⃣ Understanding MACD Indicator**
The **MACD Indicator** consists of three key components:
✅ **MACD Line (Fast Line)** – The difference between the **12-day EMA and 26-day EMA**.
✅ **Signal Line (Slow Line)** – A **9-day EMA** of the MACD line, used to generate buy/sell signals.
✅ **Histogram** – The difference between the MACD line and Signal line, which shows momentum strength.
📌 **Formula:**
**MACD Line = 12-day EMA – 26-day EMA**
**Signal Line = 9-day EMA of MACD Line**
**Histogram = MACD Line – Signal Line**
---
## **2️⃣ How to Trade Using MACD?**
📍 **A) MACD Crossover Strategy**
🔹 **Bullish Signal (Buy Trade)** – When the MACD Line crosses **above** the Signal Line.
🔹 **Bearish Signal (Sell Trade)** – When the MACD Line crosses **below** the Signal Line.
📍 **B) MACD Histogram Strategy**
🔹 When the **histogram is positive and increasing**, it signals strong bullish momentum.
🔹 When the **histogram is negative and increasing**, it signals strong bearish momentum.
📍 **C) MACD Divergence Strategy**
🔹 **Bullish Divergence (Buy Signal)** – Price makes **lower lows**, but MACD makes **higher lows**.
🔹 **Bearish Divergence (Sell Signal)** – Price makes **higher highs**, but MACD makes **lower highs**.
📌 **Pro Tip:** Always confirm MACD signals with **support/resistance levels, RSI, or volume analysis** for stronger accuracy.
---
## **3️⃣ Best MACD Trading Strategies for High Profitability**
📍 **A) MACD + RSI Strategy**
🔹 Buy when MACD gives a **bullish crossover** and RSI is **above 50**.
🔹 Sell when MACD gives a **bearish crossover** and RSI is **below 50**.
📍 **B) MACD + Moving Averages Strategy**
🔹 Use **MACD crossovers** with **50-day & 200-day moving averages** for trend confirmation.
📍 **C) MACD + Support/Resistance Strategy**
🔹 When MACD gives a **buy signal near support**, it confirms a strong upward move.
🔹 When MACD gives a **sell signal near resistance**, it confirms a strong downward move.
---
## **4️⃣ Common Mistakes to Avoid in MACD Trading**
❌ **Trading Every Crossover** – Always confirm with other indicators.
❌ **Ignoring Market Trends** – Use MACD in **trending markets**, not sideways markets.
❌ **Not Using Stop-Loss** – Always set risk management rules.
📌 **Example:** If Nifty 50 is trending **upwards**, wait for a **bullish MACD crossover** near **support** instead of blindly following MACD signals.
---
## **Final Thoughts – Why MACD is a Game-Changer?**
🚀 MACD helps traders **identify trends, momentum, and reversals** with high accuracy.
📌 **To Master MACD Trading:**
✅ Use **MACD crossovers** with RSI & Moving Averages.
✅ Confirm MACD **signals with price action & volume**.
✅ **Backtest MACD strategies** before using real money.
By combining **MACD with other technical tools**, traders can **increase profitability and trade with confidence!** 📈💰
---
🔹 **Disclaimer**: This content is for educational purposes only. *SkyTradingZone* is not SEBI registered and does not provide financial or investment advice. Please conduct your own research before making any trading decisions.

which sector will boom in 2025 ?As we look ahead to 2025, several sectors are poised for significant growth, driven by technological advancements, evolving consumer behaviors, and global economic trends. Here are some key sectors to watch:
**1. Artificial Intelligence (AI) and Machine Learning**
AI and machine learning are transforming industries by enabling automation, enhancing data analysis, and improving decision-making processes. Companies specializing in AI technologies are expected to experience substantial growth as businesses increasingly adopt these solutions to gain a competitive edge.
**2. Clean Energy and Storage Technologies**
The global shift towards sustainability is driving demand for clean energy sources and efficient energy storage solutions. Investments in solar, wind, and battery technologies are anticipated to surge, offering opportunities for companies in these sectors.
**3. Healthcare Technology**
Advancements in healthcare technology, including telemedicine, wearable health devices, and personalized medicine, are revolutionizing patient care. The healthcare sector is projected to grow as these innovations become more integrated into everyday healthcare practices.
**4. Cybersecurity**
With the increasing frequency and sophistication of cyber threats, the demand for robust cybersecurity solutions is escalating. Companies providing services to protect against cyberattacks are expected to see significant growth.
**5. Real Estate and Rental Services**
The real estate sector, including rental and leasing services, is projected to experience steady growth. Factors such as urbanization, population growth, and evolving work patterns contribute to the demand for residential and commercial properties.
**6. Financial Services**
The financial sector is anticipated to benefit from economic recovery and increased consumer spending. Institutions offering innovative financial products and services are well-positioned for growth.
**7. Industrials**
The industrial sector, encompassing manufacturing, aerospace, and infrastructure development, is expected to thrive. Factors such as reshoring, increased defense spending, and infrastructure investments contribute to the sector's positive outlook.
**8. Consumer Discretionary**
As consumer confidence rises, the discretionary spending sector, including retail and entertainment, is projected to see growth. Companies offering innovative products and experiences are likely to benefit.
**9. Communication Services**
The communication services sector, encompassing media, entertainment, and telecommunications, is expected to grow as demand for digital content and connectivity increases.
**10. Energy**
The energy sector, particularly traditional energy sources like oil and gas, is projected to benefit from rising global demand and limited supply, potentially leading to higher prices and profits.
While these sectors show promise, it's essential to conduct thorough research and consider individual investment goals and risk tolerance before making investment decisions.

what is fundamental analysis ?1. Introduction
Fundamental analysis determines the intrinsic value of an asset by analyzing economic, financial,
and qualitative factors.
It is crucial for long-term investment decisions and involves evaluating financial statements, industry
trends, and macroeconomic factors.
2. Key Components of Fundamental Analysis
A. Quantitative Analysis:
- Balance Sheet (Assets, Liabilities, Shareholder's Equity)
- Income Statement (Revenue, Profit, Expenses)
- Cash Flow Statement (Operational Cash Flow)
- Financial Ratios (EPS, P/E Ratio, ROE, Debt-to-Equity)
B. Qualitative Analysis:
- Business Model & Competitive Advantage
- Management Quality & Leadership
- Market Share & Industry Trends
- Economic Indicators (GDP, Inflation, Interest Rates)
3. Fundamental Analysis vs. Technical Analysis
- Fundamental Analysis: Focuses on company financials, economy, and intrinsic value (Best for
long-term investments).
- Technical Analysis: Focuses on price trends, charts, and indicators (Best for short-term trading).
4. How to Conduct Fundamental Analysis?
- Analyze Economic & Industry Trends
- Evaluate Company?s Financials & Growth Potential
- Compare Financial Ratios with Competitors
- Determine Intrinsic Value Using Valuation Models
5. Advantages & Limitations
? Advantages:
- Identifies long-term investment opportunities.
- Provides deep insights into a company's value.
- Reduces emotional trading decisions.
? Limitations:
- Time-consuming process.
- Not suitable for short-term trading.
- Market sentiment can temporarily override fundamentals.
6. Conclusion
Fundamental analysis is a powerful tool for investors to make informed decisions.
Combining it with technical analysis can improve accuracy and risk management.
Disclaimer:
This content is for educational purposes only and does not constitute financial advice.
GlobalTradeView is not SEBI registered.

what are the things to remember while tradingWhen trading in the stock market, there are several key things to keep in mind to improve your chances of success and minimize risk. Here’s a list of **important things to remember while trading**:
---
### 1. **Have a Trading Plan**
- **Set clear goals**: Know why you’re trading and what you want to achieve. Are you looking for short-term profits, or are you aiming for long-term growth?
- **Define your strategy**: Create a strategy that aligns with your goals (e.g., day trading, swing trading, long-term investing). Specify the entry and exit criteria for each trade.
- **Stick to your plan**: Avoid the temptation to deviate from your strategy based on emotions, hype, or market noise.
### 2. **Risk Management is Key**
- **Never risk more than you can afford to lose**: Only trade with money you can afford to lose, as losses are a part of trading.
- **Set stop-loss orders**: Use stop-loss orders to limit potential losses by automatically selling a position if it reaches a certain price.
- **Use appropriate position sizing**: Adjust the size of your trades according to your risk tolerance and account size. Risking 1-2% of your capital per trade is a common rule.
- **Risk-to-reward ratio**: Ensure your potential reward outweighs the risk you’re taking. A 3:1 risk-to-reward ratio means that for every $1 you risk, you expect a $3 reward.
### 3. **Control Your Emotions**
- **Don’t let greed drive decisions**: Greed can lead to overtrading or chasing after unrealistic returns. Stick to your strategy and avoid taking impulsive trades.
- **Don’t let fear control you**: Fear can lead to hesitation or exiting trades too early. Trust your analysis and stick to your plan.
- **Avoid revenge trading**: If you lose a trade, don’t try to “get back” at the market by making another trade out of frustration. It can lead to more losses.
### 4. **Use Technical and Fundamental Analysis**
- **Technical analysis**: Use charts, indicators, and patterns to identify potential price movements and trends. Examples include moving averages, RSI, MACD, and candlestick patterns.
- **Fundamental analysis**: Understand the financial health of the companies you're investing in. Look at earnings reports, balance sheets, growth prospects, and overall economic conditions.
- **Combine both**: While technical analysis helps identify entry/exit points, fundamental analysis can help you choose which stocks to trade.
### 5. **Be Patient and Disciplined**
- **Wait for the right setup**: Don’t rush into trades. Wait for a confirmed signal based on your strategy (e.g., breakout, reversal pattern, etc.).
- **Avoid chasing the market**: If you missed a trade or the price is moving too fast, resist the urge to jump in just because others are trading. Focus on your plan.
- **Consistency**: Stick to your strategy over time. Don’t be swayed by short-term fluctuations. Trading is a marathon, not a sprint.
### 6. **Don’t Overtrade**
- **Less is more**: Don’t trade just for the sake of trading. Overtrading can lead to unnecessary risks and higher transaction costs.
- **Quality over quantity**: Focus on high-probability setups rather than forcing trades. Take only the best opportunities that fit your plan.
- **Take breaks**: Stepping away from the market allows you to reset mentally and reduces emotional trading.
### 7. **Keep Learning and Improving**
- **Keep a trading journal**: Record your trades, including entry/exit points, rationale, and outcomes. Reviewing your journal helps you learn from mistakes and improve.
- **Study and adapt**: Markets are constantly evolving. Stay updated with news, strategies, and new technologies like algorithmic trading. Continuously refine your strategy based on experience and new knowledge.
### 8. **Accept Losses as Part of Trading**
- **Losses are inevitable**: No trader wins all the time. Learn to accept losses and view them as part of the learning process.
- **Don’t compound losses**: Avoid trying to recover losses by taking bigger risks or overtrading. Maintain discipline and follow your plan.
- **Cut losses early**: If a trade isn’t working out, close the position and move on. It’s better to cut small losses than to hold onto a losing position hoping it will turn around.
### 9. **Understand Market Conditions**
- **Different market conditions**: Understand whether the market is trending or in a range. Trend-following strategies work in trending markets, while range-bound strategies work in sideways markets.
- **Volatility**: High volatility can present more opportunities but also increases risk. Be prepared for big price swings, and adjust your strategy accordingly.
- **Avoid trading during major news events**: Big news (e.g., earnings reports, economic data releases, central bank announcements) can create unpredictable volatility. If you’re not prepared for such volatility, it may be best to sit out or adjust your positions.
### 10. **Keep Costs in Mind**
- **Transaction costs**: Be aware of commission fees, spreads, and slippage, which can erode profits over time, especially if you trade frequently.
- **Taxes**: Understand the tax implications of your trades. For example, long-term capital gains (for positions held for over a year) may be taxed differently from short-term gains.
### 11. **Develop a Risk Tolerance**
- **Know your risk tolerance**: Before you start trading, determine how much risk you are willing to take on each trade and how much you are comfortable losing overall.
- **Diversify**: Spread your risk across different assets, sectors, and strategies to avoid large losses in any single trade or market condition.
### 12. **Use Technology Wisely**
- **Leverage trading platforms and tools**: Use charting software, market scanners, and trading algorithms to help with decision-making.
- **Consider automated trading**: If you find it difficult to stick to a strategy, you can explore algorithmic trading to automate your trading process based on your defined rules.
### 13. **Be Aware of Market Manipulation**
- **Pump-and-dump schemes**: Be cautious of stocks with sudden price spikes driven by rumors or manipulative activities. These can be short-lived and lead to significant losses.
- **Follow reliable sources**: Don’t chase stock tips from unverified sources or social media. Rely on proven research and analysis.
### 14. **Take Care of Your Mental Health**
- **Avoid burnout**: Trading can be stressful. Take breaks when needed and maintain a healthy work-life balance.
- **Stay calm and focused**: Don’t let emotions cloud your judgment. If you’re feeling overwhelmed, take a step back from the markets.
---
### Summary Checklist:
- **Have a clear trading plan**.
- **Set realistic goals and expectations**.
- **Stick to risk management rules** (e.g., stop-losses, position sizing).
- **Control your emotions** and avoid impulsive decisions.
- **Be patient** and wait for the right setups.
- **Focus on learning and improving** your strategy continuously.
- **Understand market conditions and adapt** accordingly.
- **Keep track of your trades** through journaling.
By incorporating these principles into your trading routine, you'll have a better chance of becoming a disciplined and successful trader. Remember, the market is a long-term game, and success often comes from patience, consistency, and ongoing learning!
