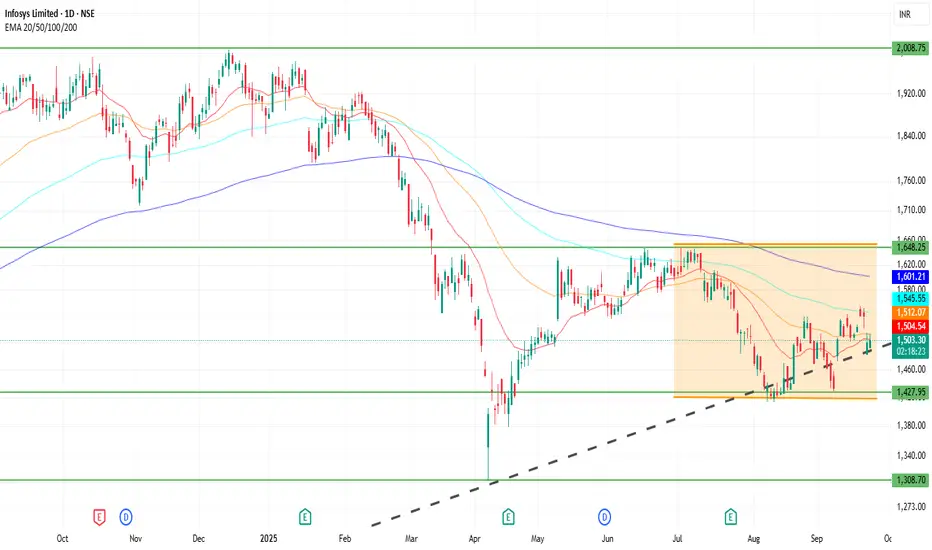
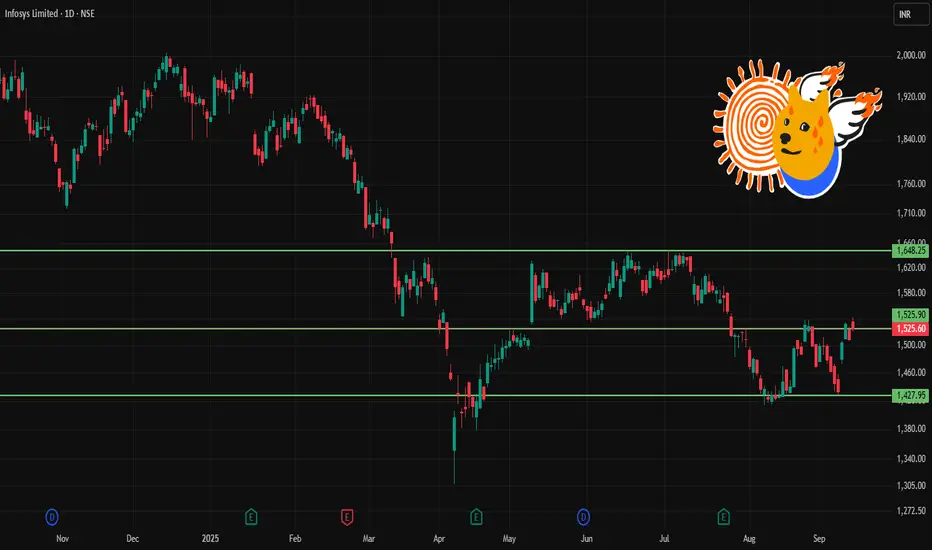
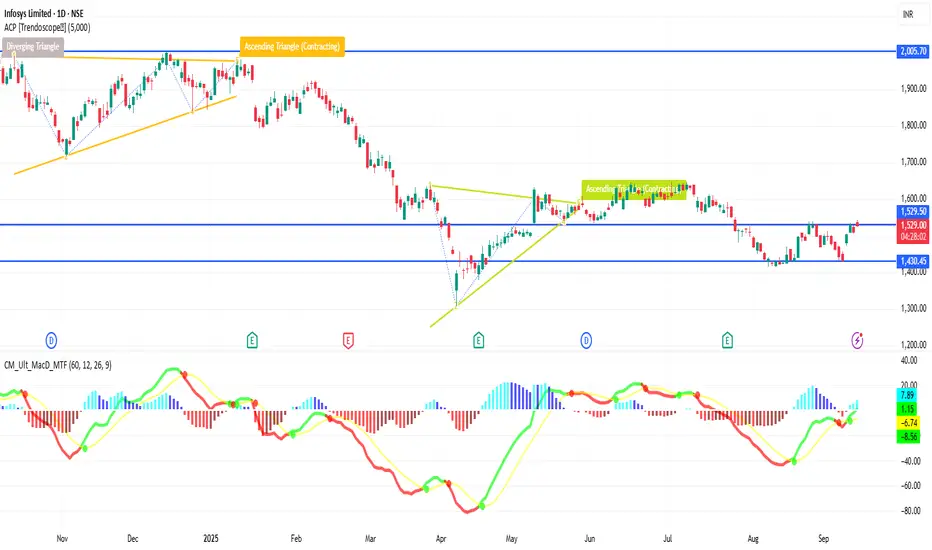
INFY 1D Time frame📍 Current Price & Range
Current Price: ₹1,503.00
Day’s High / Low: ₹1,540.20 / ₹1,499.50
52-week High / Low: ₹2,006.45 / ₹1,307.00
🔍 Key Levels
Immediate Resistance: ₹1,540–₹1,550
Next Resistance: ₹1,600
Immediate Support: ₹1,450–₹1,460
Strong Support: ₹1,400
📊 Indicators & Momentum
Short-term Trend: Neutral to slightly bearish; recent price action shows hesitation near resistance levels.
Volume: Higher-than-average trading volume observed, indicating increased investor interest.
Relative Strength Index (RSI): Approaching overbought territory; caution advised for potential pullbacks.
Moving Averages: Price trading below key moving averages; may act as resistance if price approaches them.
🔮 Possible Scenarios
Bullish Breakout: If INFY sustains above ₹1,550 with strong volume, it could target ₹1,600 and higher levels.
Sideways Consolidation: Price may trade between ₹1,450 and ₹1,550, awaiting a catalyst for direction.
Bearish Reversal: A drop below ₹1,450 could lead to a retest of the 52-week low around ₹1,307.
⚠️ Outlook
At the current level of ₹1,503.00, Infosys is at a critical juncture. A decisive move above ₹1,550 could open up upside potential, while a failure to hold above ₹1,450 may lead to further downside. Monitoring volume and RSI for confirmation is recommended.
Trade ideas
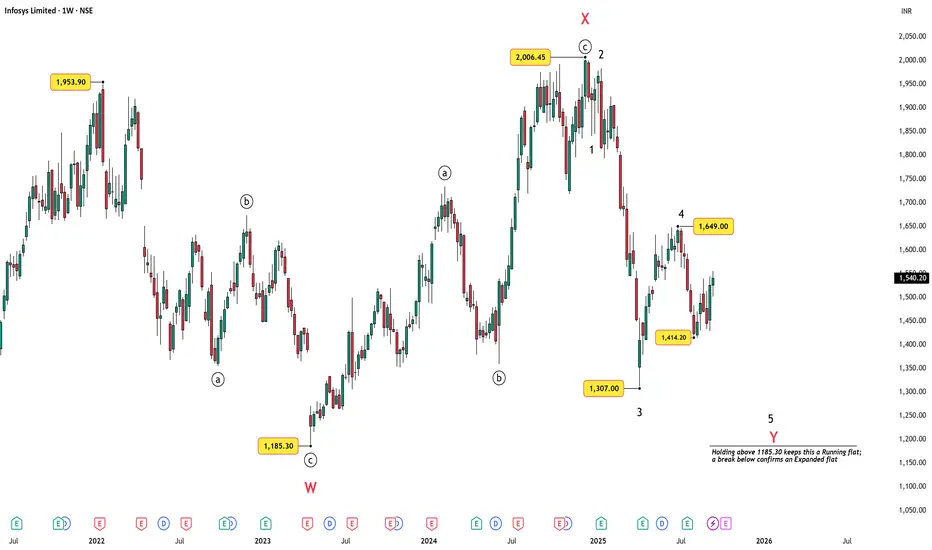
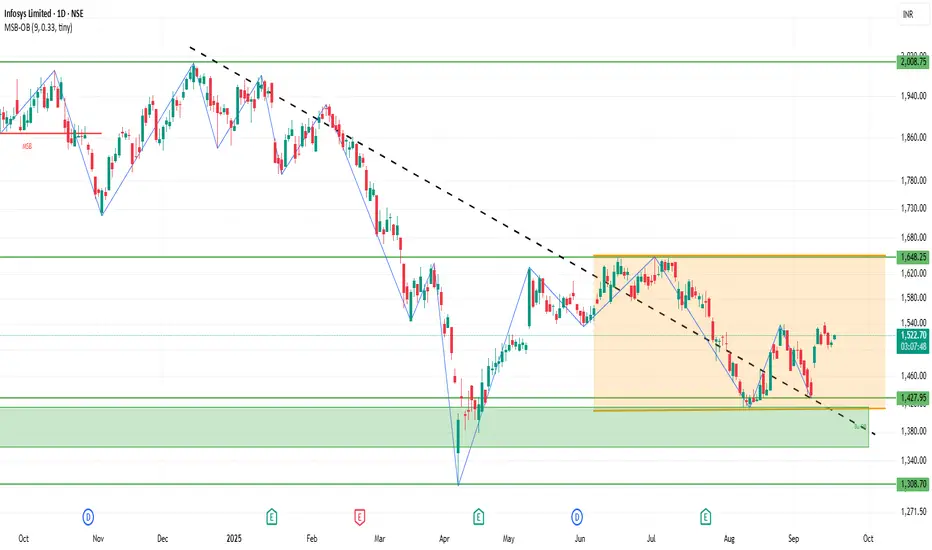
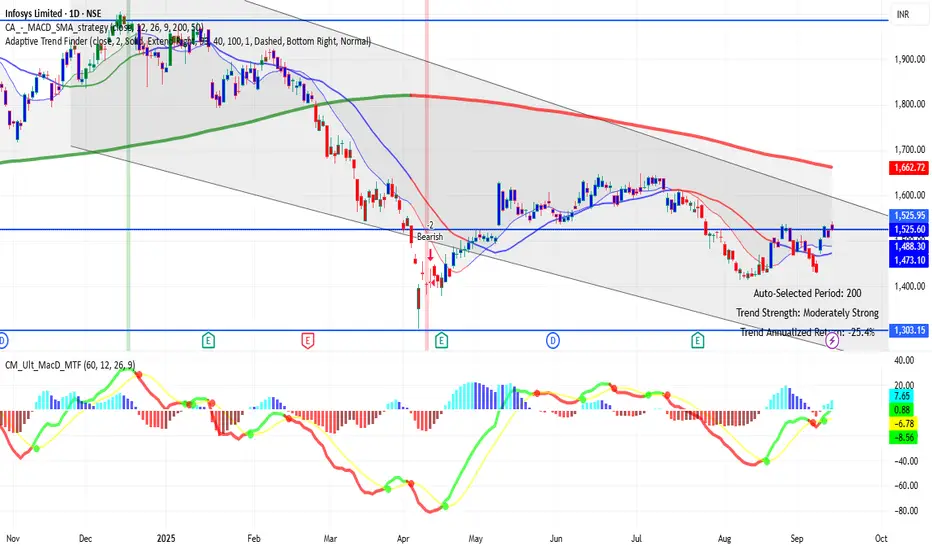
Infosys: Technicals Align with H-1B HeadwindsInfosys (NSE: INFY) has been moving within a larger corrective structure after topping near ₹2006. The weekly Elliott Wave count suggests a possible W–X–Y correction, where the Y-leg may be unfolding as a 3-3-5 flat. With prices currently hovering in the mid-1500s, the bigger picture hints at unfinished business on the downside.
Weekly Chart – The Bigger Picture
The weekly count shows:
Wave W completed near ₹1185,
A strong bounce into Wave X topping at ₹2006,
And now Wave Y in play, potentially forming a flat correction.
Key levels to watch:
₹1307 – the low of Wave 3, which remains the immediate bearish target.
₹1185 – the critical level that decides whether this becomes a Running Flat (if held) or an Expanded Flat (if broken).
In simple terms: holding above ₹1185 keeps this a controlled correction, but breaking below it could mean a deeper and more extended decline.
Fundamental Note – U.S. H-1B Visa Shock
Adding to the technical picture, fundamentals just turned heavy. Infosys ADR fell nearly 4% on Friday-Sep 19, after U.S. President signed an executive order imposing a $100,000 fee on new H-1B visa petitions.
Since North America contributes one-third to two-thirds of Indian IT revenues , this sudden spike in visa costs introduces a policy headwind. While not an existential threat, it raises uncertainty for future growth and could act as a catalyst for the bearish structures already visible on the charts.
News source: in.tradingview.com
Daily Chart – Zoomed In
On the daily timeframe, the larger Wave 4 looks complete near ₹1649. Infosys has since begun its Wave 5 decline. Within this drop, price found a low at ₹1414.20, which likely marks the end of a smaller Wave 3. The current bounce is best viewed as a smaller Wave 4 inside this ongoing Wave 5.
Price is still capped below the SMA100 and SMA200, both acting as strong resistance.
RSI at ~58 shows mid-range momentum, leaving room for the final Wave 5 leg to extend lower.
The key structural invalidation remains ₹1649. Any sustained move above this level would negate the bearish count.
As long as the stock stays under 1649, the expectation is for Wave 5 to resume down, aligning with the weekly flat structure.
Summary & Key Levels
The weekly and daily charts together point to a bearish bias in Infosys. The larger corrective W–X–Y flat is still in play, and the stock has already rolled into Wave 5 down.
Short-term: A smaller Wave 4 bounce is underway, but unless price clears ₹1649, the expectation is for a continuation lower.
Medium-term: A retest of ₹1414.20 is likely, with scope for an extension toward ₹1307.
Long-term pivot: Holding above ₹1185 keeps the structure a Running Flat; a break below it would confirm an Expanded Flat.
In short: 1649 is the bearish invalidation, 1414.20 is the immediate watch level, and 1185 is the big-picture decider.
Disclaimer: This analysis is for educational purposes only and does not constitute investment advice. Please do your own research (DYOR) before making any trading decisions.
INFY 1D Time frameCurrent Facts
INFY is trading around ₹1,525-₹1,530.
Recent high / resistance being tested around ₹1,540-₹1,550.
The stock has a 52-week low around ₹1,307 and a high near ₹2,006.
Technical momentum is neutral to mildly bullish. Indicators like MACD are positive but RSI is not yet overbought.
🔍 Key Support & Resistance Levels
Immediate Support: ~ ₹1,500-₹1,510 — this is the level to watch closely. If INFY remains above this, it helps maintain bullish bias.
Secondary Support: ~ ₹1,470-₹1,490, in case the nearer support fails.
Immediate Resistance: ~ ₹1,540-₹1,550 — price is facing supply pressure here.
Stronger Resistance: ~ ₹1,560-₹1,570 if INFY manages to break above the nearer resistance.
⚙️ Interpretation & Outlook
As long as INFY stays above the ~₹1,500 support, bulls have a chance to push toward resistance.
Selling pressure is visible near the resistance zone; repeated failures at that zone could lead to consolidation or a pullback.
If INFY breaks above ₹1,550 with strong volume, the upside may extend toward ~₹1,560-₹1,570 and beyond.
⚠️ Risk Points
Breakdown below ₹1,500 may drag INFY toward the ~₹1,470-₹1,490 support.
If that too fails, deeper weakness may set in, possibly toward lower zones depending on market sentiment.
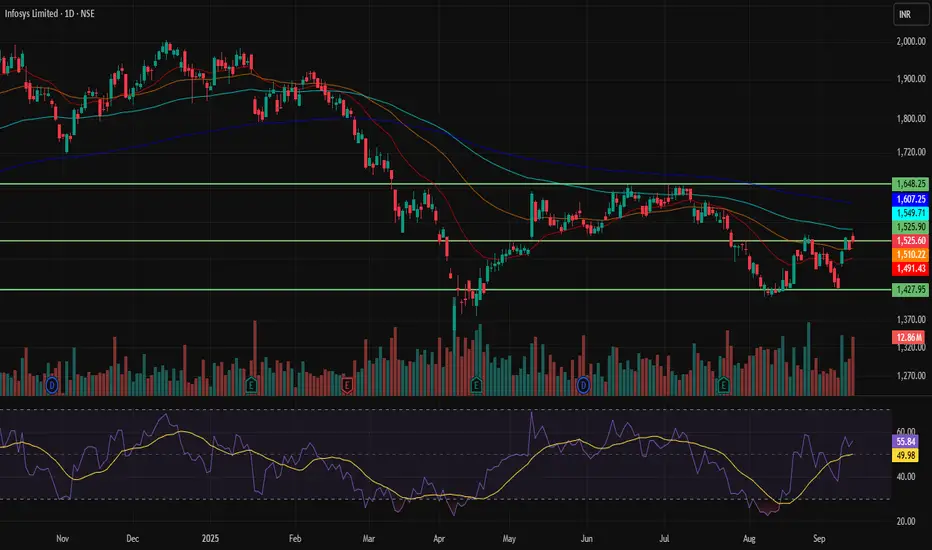
INFY 1D Time frameCurrent Snapshot
Price is trading near ₹1,545.
Stock is holding above the 50-day moving average, showing underlying strength.
Near medium-term averages (100-day and 200-day), so trend is stable with mild bullish bias.
⚙️ Indicators / Momentum
RSI (14): Mid-to-high range, showing steady strength but not overbought yet.
MACD: Positive, suggesting upward momentum is intact.
Overall Momentum: Slightly bullish with chances of consolidation near resistance.
📌 Key Levels
Immediate Resistance: ₹1,550 – ₹1,560.
Immediate Support: ₹1,510 – ₹1,520.
Stronger Support: ₹1,450 – ₹1,480 zone if bigger pullback happens.
✅ Outlook
As long as the stock stays above ₹1,510, trend remains bullish.
Breakout above ₹1,560 could open further upside targets.
If price slips below ₹1,510, short-term weakness may pull it toward ₹1,450 – ₹1,480.

INFY 1D Time frameCurrent Stock Price
Current Price: ₹1,525.60
Day’s Range: ₹1,521.10 – ₹1,542.90
52-Week Range: ₹1,307.00 – ₹2,006.45
Market Cap: ₹6.33 lakh crore
P/E Ratio (TTM): 23.0
EPS (TTM): ₹65.63
Dividend Yield: 2.82%
Book Value: ₹230.65
📈 Trend & Outlook
Short-Term Trend: Bullish; the stock is trading near its 52-week high, indicating strong investor confidence.
Resistance Levels: ₹1,542.90 (day’s high), ₹2,006.45 (52-week high).
Support Levels: ₹1,521.10 (day’s low), ₹1,500.00 (psychological support).
Investor Sentiment: Positive, with strong institutional interest and favorable analyst outlooks.
🧭 Analyst Insights
Valuation: The stock is trading at a P/E ratio of 23.0, which is below the sector average of 28.56, suggesting potential value.
Growth Prospects: The company’s strong earnings growth and robust capital position support its premium valuation.
INFY 1D Time frameCurrent Price: ₹1507 (approx)
Day’s Range: ₹1507 – ₹1543
Previous Close: ₹1509.10
🔹 Support & Resistance
Support 1: ₹1500
Support 2: ₹1490 – ₹1470
Resistance 1: ₹1539 – ₹1552
Resistance 2: ₹1560 – ₹1570
Infosys Turns to BullishBuy @ CMP -1514
Stoploss - 1428.20
Target - 1586.55
1631.00
1750.00
Maintain stoploss strictly. Follow me for update on this calls.
One shot - Clear shot
Happy Trading
Jai Hind
INFY 1D Time frameCurrent Price & Trend
Current Level: ~₹1,525
Trend: Neutral to bullish → stock is slowly recovering from recent lows.
Momentum: Buying support is visible near ₹1,500 zone.
Indicators
RSI: Around 59 → healthy, not yet overbought.
MACD: Positive crossover → signals upward momentum.
Moving Averages: Price is above short-term averages, but medium-term trend is still consolidating.
Bullish Scenario
If INFY sustains above 1,540, it can move toward 1,560 – 1,600.
A breakout above 1,600 could trigger further rally toward 1,650.
INFY 1D Time frame📉 Current Market Snapshot
Current Price: ₹1,525.60
Previous Close: ₹1,509.70
Day's Range: ₹1,521.10 – ₹1,542.90
52-Week High: ₹2,006.45
52-Week Low: ₹1,307.00
Market Cap: ₹6,33,794 crore
P/E Ratio: 23.0
Dividend Yield: 2.82%
ROE: 28.72%
Debt-to-Equity Ratio: 0.09
Beta: 1.11
EPS (TTM): ₹65.63
Face Value: ₹5.00
VWAP: ₹1,529.86
Volume: 12,856,963 shares
ATR (14): ₹5.72
MFI: 71.75
INFY (Infosys) 1D Time Frame Current Status
Price around ₹1525
Positive momentum today
Key Levels
Support: ₹1510 → ₹1500
Resistance: ₹1535 → ₹1545
Outlook
Holding above ₹1510 keeps trend bullish. Break above ₹1535–1545 can push price higher, but falling below ₹1500 may bring weakness.
INFY 1D Time frame🔢 Current Level
Trading near ₹1,525.60
🔑 Key Resistance & Support Levels
Resistance Zones:
~ ₹1,539 – ₹1,552 (near-term resistance)
~ ₹1,560 – ₹1,570 (stronger resistance if price moves higher)
Support Zones:
~ ₹1,510 – ₹1,500 (immediate support)
~ ₹1,470 – ₹1,450 (secondary support)
~ ₹1,380 – ₹1,400 (deeper support if selling pressure builds)
📉 Outlook
Bullish Scenario: A close above ₹1,540 could fuel momentum toward ₹1,560+.
Bearish Scenario: If it slips below ₹1,510, risk opens toward ₹1,470 or even ₹1,400.
Neutral / Range: Likely sideways between ₹1,510 – ₹1,552 until a breakout.
INFY 1D Time frame🔢 Current Level
Trading around ₹1,523.50 - ₹1,528.50
🔑 Key Resistance & Support Levels
Resistance Zones:
₹1,540 – ₹1,550 (recent highs; breakout above this may lead to further upside)
₹1,570 – ₹1,580 (stronger resistance above)
Support Zones:
₹1,510 – ₹1,520 (immediate support; failure to hold above this may lead to a decline)
₹1,490 – ₹1,500 (short-term support; a break below this could indicate weakness)
₹1,460 – ₹1,470 (deeper support zone if price dips further)
📉 Outlook
Bullish Scenario: If Infosys holds above ₹1,520, upward momentum may continue. Break above ₹1,550 can open the way toward ₹1,570+.
Bearish Scenario: If it falls below ₹1,490, risk increases toward ₹1,460 – ₹1,470.
Neutral / Range: Between ₹1,520 – ₹1,550, Infosys may consolidate before a directional move.
INFY 1D Time frame🔢 Current Level
INFY is trading around ₹1,510 – ₹1,529
🔑 Key Resistance & Support Levels
Resistance Zones:
₹1,518 – ₹1,520 (near-term resistance; breakout above this may lead to further upside)
₹1,530 (stronger resistance above)
Support Zones:
₹1,484 – ₹1,485 (immediate support)
₹1,481 (stronger support if price dips further)
₹1,470 – ₹1,472 (deeper support zone)
📉 Outlook
Bullish Scenario: If INFY holds above ₹1,485, upward momentum may continue.
Breakout Scenario: A move above ₹1,520 can open the way toward ₹1,530+.
Bearish Scenario: If it falls below ₹1,481, risk increases toward ₹1,470 – ₹1,472.
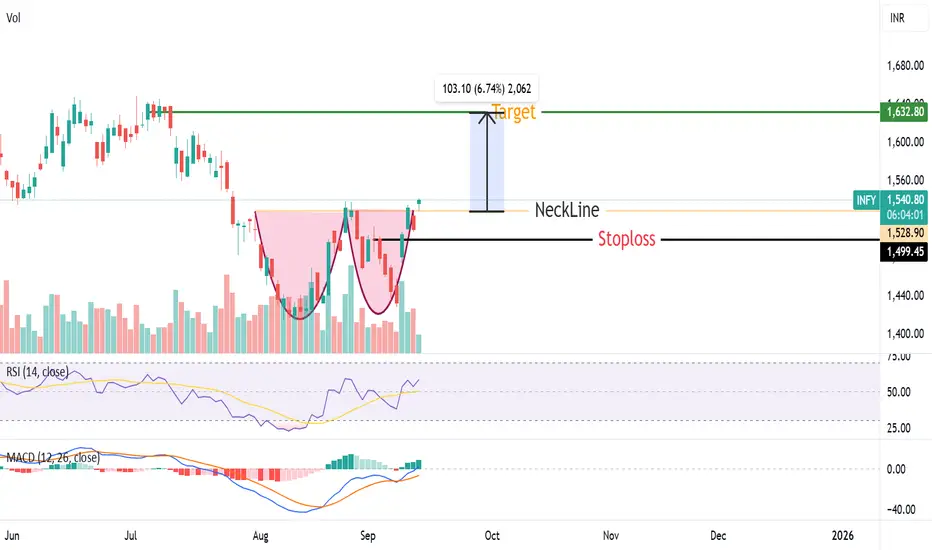
Double Bottom Pattern Breakout in InfosysInfosys given Double bottom Pattern breakout from Neckline arround 1530.Target of it will be arrround 1630 with a stoploss of 1500.
it's not a buy or sell call ..For education only.
INFY 1D Time frame📍 Current Price Action
Current Price: ~₹1,509
Day Change: about –1.5%
Daily Range: ₹1,500 – ₹1,515
⚙ Technical Indicators
RSI (14): ~57–60 → neutral to mildly bullish momentum
MACD: Positive → signals upward bias
Stochastic Oscillator: Near oversold zone → indicates possible bounce
ADX (14): ~26 → moderate trend strength
Money Flow Index (MFI): Mid-range → no extreme buying/selling pressure
📊 Moving Averages
Short-term (5, 10-day): Price trading slightly below → short-term weakness
Medium to Long-term (50, 100, 200-day): Price still above → long-term structure supportive
📉 Support & Resistance
Immediate Support: ~₹1,500
Next Support: ~₹1,480 – ₹1,470
Immediate Resistance: ~₹1,512 – ₹1,515
Breakout Target (if above resistance): ~₹1,530 – ₹1,540
🧠 Summary
INFY is neutral to mildly bullish on the daily chart. Support at ₹1,500 is crucial — holding above it keeps momentum intact. If the stock breaks above ₹1,515, it can push toward ₹1,530–1,540. On the downside, breaking below ₹1,500 may invite weakness toward ₹1,480–1,470.

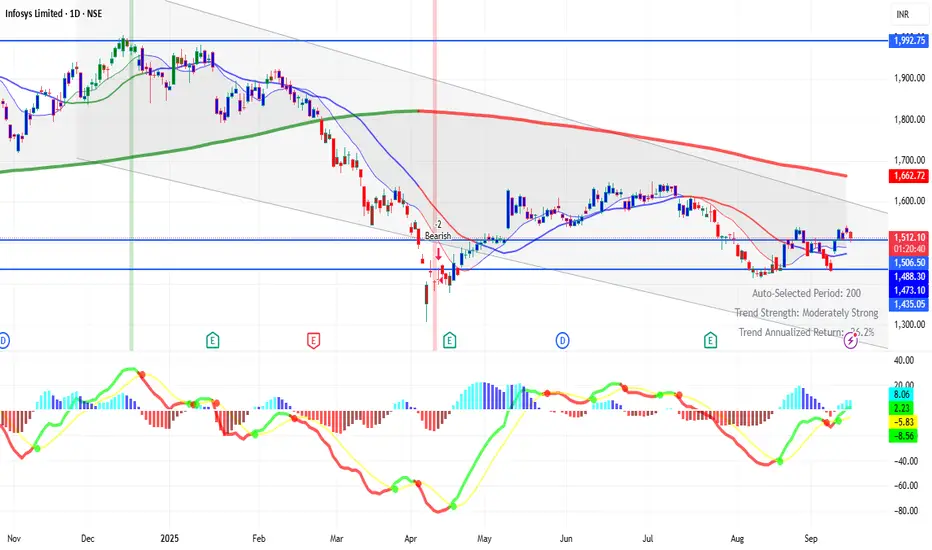
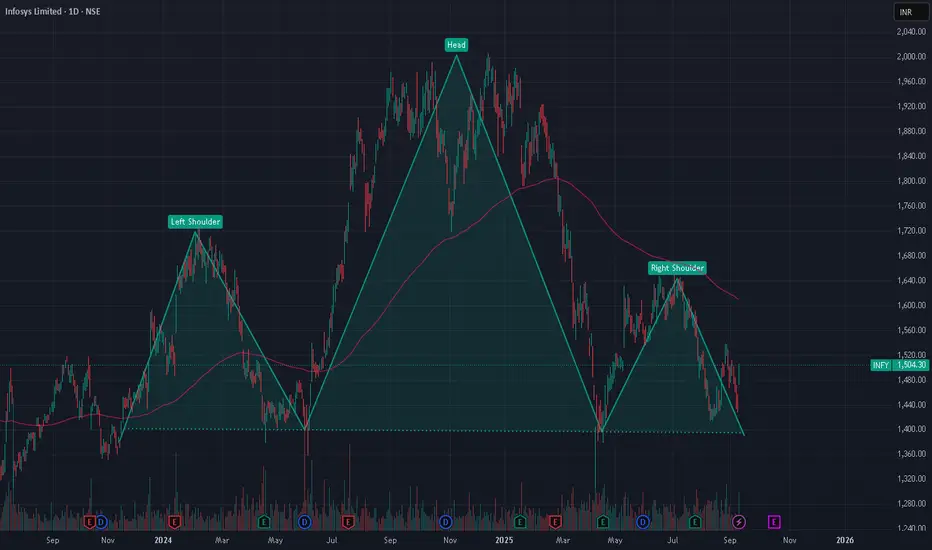
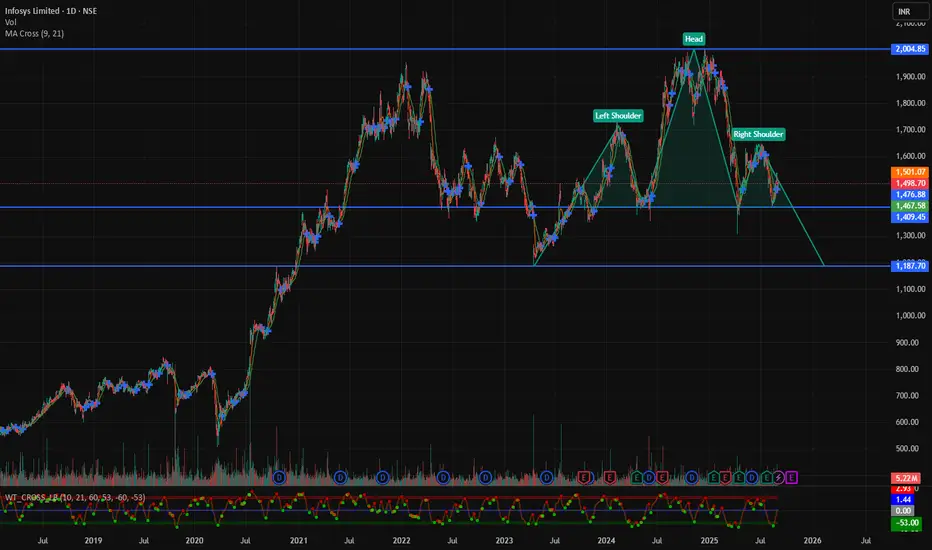
INFY showing Head and Shoulder Pattern - Analysis Infosys (INFY) has formed a prominent **head and shoulders pattern** on its daily chart around September 2025, signaling a possible bearish trend reversal. Recent news and brokerage views show cautious optimism, but global factors—especially upcoming US regulations and tax proposals—are causing market volatility and uncertainty in the IT sector.
## Head and Shoulders Pattern Analysis
- The chart for Infosys displays a classic **head and shoulders formation**, with visible left shoulder, head, and right shoulder, generally seen as a bearish reversal signal after a preceding uptrend.
- Key support levels observed: around ₹1345–1376 where the stock has repeatedly bounced, and resistance at ₹1645–1650, which INFY has failed to breach recently.
- Breakdown below the neckline (current support range) could trigger a move towards ₹1150; however, some analysts argue the pattern’s symmetry and volume confirmation are lacking for a textbook reversal, so a decisive breakout is awaited.
- RSI hovers at neutral levels (~50), suggesting indecision and the need for confirmation before traders take strong positions.
## Brokerage Views and Target Prices
- **Nomura:** Maintains a ‘Buy’ rating, with a target of ₹1,880, slightly reduced from ₹1,900. This indicates ~19% potential upside from recent prices.
- **Jefferies:** Also retains a ‘Buy’ call, targeting ₹1,700 (~22% upside), noting strong cash flows despite a ~26% correction YTD.
- Many top brokerages still consensus ‘Buy’ for Infosys, with 26 out of 39 analysts in strong agreement. However, there are isolated bearish calls (e.g., CapitalVia’s ₹1,000 target).
- Trading range in the near term is forecast between ₹1,334–1,574.
## Impact of US News on INFY Shares
- **Buyback Announcement:** Infosys’ decision to consider a share buyback on September 11, 2025, sparked a bounce in IT stocks, including a 4% surge in INFY, temporarily boosting sector sentiment.
- **US Tax Threats:** The HIRE Act proposes a steep 25% excise tax on payments by US companies to foreign service providers, making Indian IT exports less competitive and worrying investors about FII outflows and renewed tariffs.
- FIIs sold nearly ₹32,000 crore of Indian IT shares in July-August, leading to a correction in INFY and peers.
- Market players are watching for US diplomatic resolutions—any positive news could stabilize IT stocks, but implementation of tough US policies would likely trigger further downside.
- **US Rate Cuts:** Hopes of US interest rate reductions have lent some support, as weaker dollar could help Indian exporters, but persistent trade tensions remain a headwind.
## Conclusion
- The **head and shoulders pattern** in Infosys charts indicates caution; a breakdown below neckline supports could lead to sharp declines.
- Brokerages see upside potential, with targets around ₹1,700–1,880, but are wary of international regulatory risks—especially from the US
- Buyback news is currently bolstering price and sentiment, counteracting negative US headlines, but the outlook remains highly sensitive to global policy shifts.
Careful attention to technical confirmation, brokerage guidance, and evolving US market news is recommended before making investment decisions in Infosys.
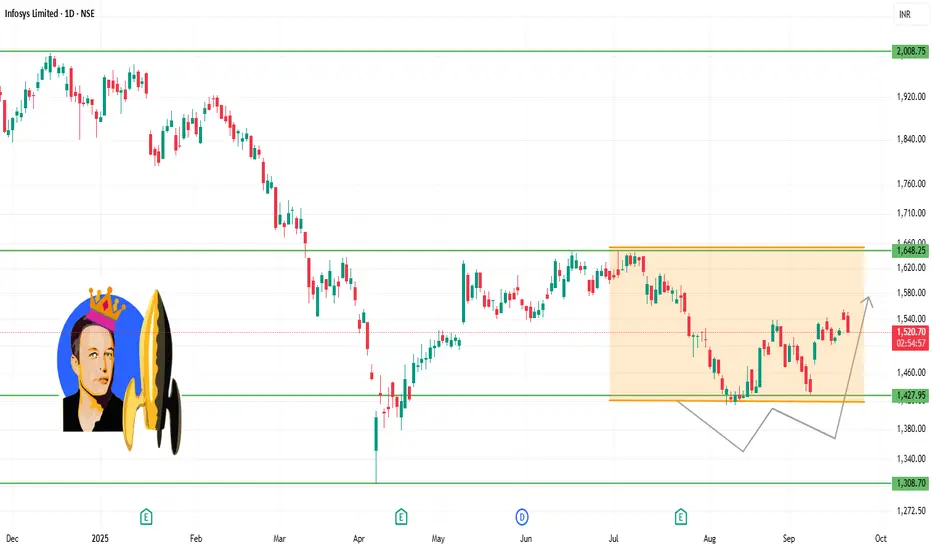
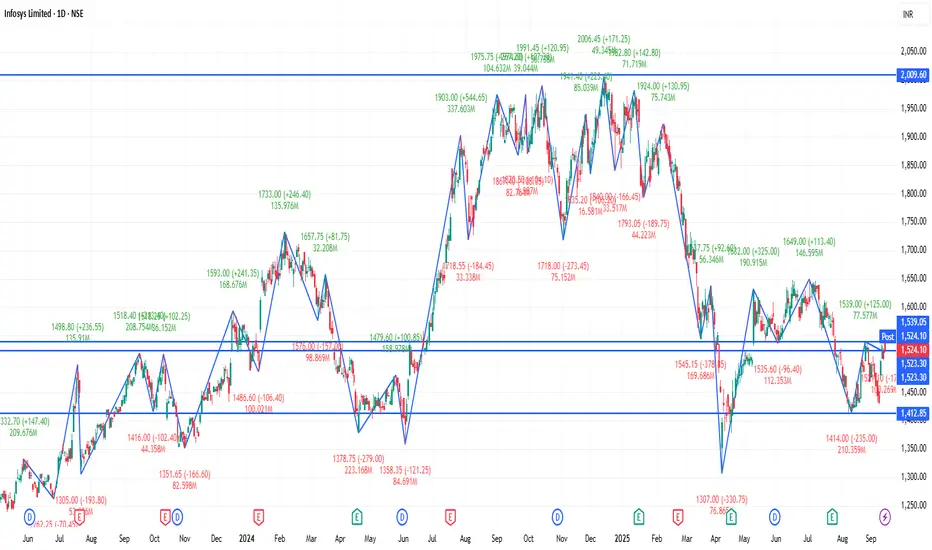
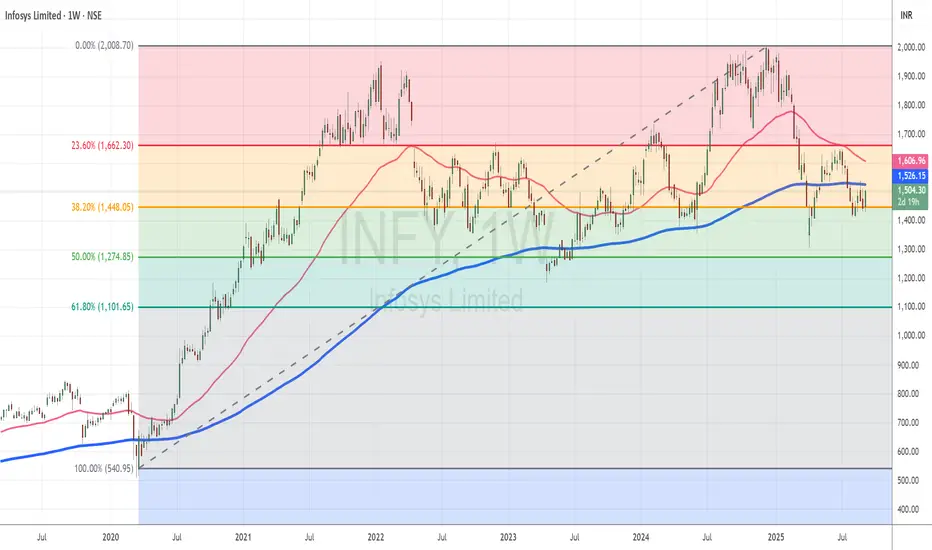
Infy Trades Sideways Since 2022, Offering Support-Driven Entry OTopic Statement:
Infosys has remained stuck in a broad sideways zone since 2022, with strong support levels offering promising long-term accumulation signals.
Key Points:
1. The stock has been range-bound between 1400 and 2000, repeatedly failing to break above the upper resistance
2. It currently stands on the 38.2% Fibonacci retracement level, where it is receiving strong support
3. Price is below the 200-day EMA, making the stock technically oversold and presenting an attractive investment opportunity
Part 1 Ride The Big MovesIntroduction
The world of financial markets offers countless opportunities for investors and traders to grow wealth, hedge risks, and speculate on price movements. Among these opportunities, options trading stands out as both exciting and intimidating. For beginners, the term "options" might sound complex, but once you understand the building blocks, options open the door to powerful strategies that stocks alone cannot provide.
Options trading is not gambling, though many mistake it for that. Instead, it’s a sophisticated tool that—when used wisely—can help traders generate income, protect their portfolios, or profit from both rising and falling markets. In this guide, we’ll walk through every fundamental aspect of options trading, simplifying concepts for beginners while also highlighting practical examples.
By the end of this guide, you’ll know:
What options are and how they work
Key terms every beginner must understand
Why people trade options
The risks and benefits of options
Basic strategies suitable for beginners
Mistakes to avoid in your early journey
A roadmap to becoming a skilled options trader

Infosys buy @ cmp 1500
can we see the profitable trade from infosys, the levels mentioned as targets
add to watchlist and place order
stoploss - 1461.30
targets - 1527, 1577, 1613, 1662
follow me for future profitable trades
this idea for educational purpose only

Divergence SecretsIntroduction to Options Trading (Educational Foundation)
Options are one of the most important financial instruments available in modern markets. For a beginner, understanding them may feel overwhelming at first, but with the right approach, they can become a powerful tool for investment, speculation, and risk management.
An option is a financial contract that gives its holder the right (but not the obligation) to buy or sell an asset, such as a stock, at a predetermined price, within a fixed time frame.
There are two major types of options:
Call Option – Provides the right to buy the underlying asset at a fixed price (called the strike price).
Put Option – Provides the right to sell the underlying asset at a fixed price.
For example:
Imagine you believe Infosys stock, currently at ₹1600, will rise soon. Instead of buying the stock directly, you can buy a call option with strike ₹1650. If Infosys rises to ₹1700, your option increases in value, and you earn profit without investing the full cost of shares.
This flexibility is what makes options attractive—but also dangerous if used without proper strategies.
Why Beginners Need Strategies Instead of Random Trades
Options can generate huge profits, but they can also cause significant losses. Many beginners are tempted to “buy cheap options” hoping for quick riches. Unfortunately, statistics show that most lose money in the long run.
The reasons are:
Options lose value with time decay (Theta).
Market moves are unpredictable; random bets rarely succeed.
Beginners underestimate risk exposure.
That’s why structured strategies are necessary. A strategy gives:
Clarity – A defined plan for entry and exit.
Risk management – Limited losses instead of unlimited risk.
Flexibility – Ability to profit in different market conditions (bullish, bearish, sideways, or volatile).
In education terms: A strategy is like a map. Just as students need a study plan to pass exams, traders need strategies to succeed in markets.

INFY showing head and shoulders pattern.
INFY might fall down to 1100 in spite of being fundamentally undervalued.
The stock might get carried away by weak nifty.
Crash of 25% possible.
Option Trading Risks of Options Trading
High Risk for Sellers: Unlimited losses possible.
Complexity: Requires deep understanding.
Time Decay: Options lose value as expiry approaches.
Liquidity Issues: Some contracts may not have enough buyers/sellers.
Over-leverage: Small mistakes can wipe out capital.
Options Pricing
An option’s premium depends on:
Intrinsic Value (IV): Actual profit if exercised now.
Time Value (TV): Extra value due to time left till expiry.
Formula:
Premium = Intrinsic Value + Time Value
Example: Nifty at 20,000
Call @ 19,800 = Intrinsic value 200.
If premium is 250 → Time value = 50.
The Greeks (Advanced Concept)
Options pricing is also affected by "Greeks":
Delta: Sensitivity to price change.
Theta: Time decay effect.
Vega: Impact of volatility.
Gamma: Acceleration of delta.
These help traders understand risks better.

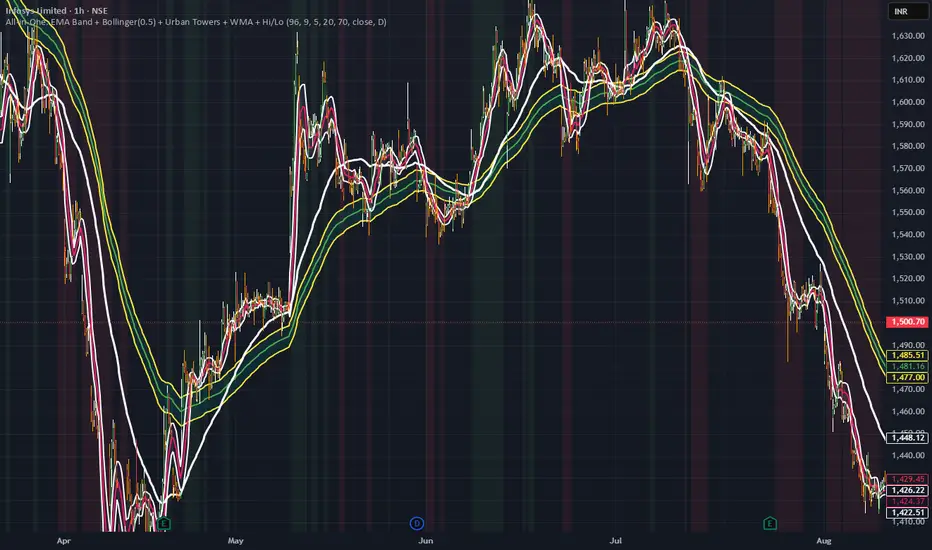
Market’s Current Crowd – Why SD 0.5 Matters with 96WMAEvery candle on the chart is a footprint of the crowd.
Some are footprints of long-term investors, others of restless scalpers, and in between lie the majority — the current active population.
Most traders look at Bollinger Bands with ±1 SD or ±2 SD. But here’s the catch:
±1 SD (68% zone) is too wide, it includes noise that the current crowd may not actually be trading.
±2 SD (95% zone) often shows overreactions — moments that only a small, emotional part of the market touches.
🔹 This is why 0.5 SD is powerful.
It captures the true heartbeat of the current population — the majority of trades happening right now.
Instead of focusing on the extremes, it filters the chatter and shows us where the real action is.
Importance of 96WMA:
Above it, the active crowd is leaning bullish, even if short-term noise distracts.
Below it, the weight shifts bearish.
Together, 0.5 SD + 96WMA forms a map — the pulse of the market (0.5 SD) laid against the backbone of trend (96WMA).
The market is not moved by everyone at once, but by the dominant population of the moment.
By tracking SD = 0.5, we see that population more clearly than any other band width.
Combine it with the quiet guide of 96WMA, and we stop guessing the crowd’s mood — we start seeing it.