Infosys - Possible Wyckoff accumulation scenarioKey highlights:
⚡️ Consolidating in the weekly demand zone for the last 4 months.
⚡️ Wyckoff accumulation schematic on the daily time frame.
⚡️ The market structure started shifting after the establishment of the low on 17 July. Hence, it is an important low.
⚡️ The logical short-term target is near the 1730 zone. If the price manages to push above the range high, expect 1700 and higher in the coming weeks.
Disclaimer : This is NOT investment advice. This post is meant for learning purposes only. Invest your capital at your own risk.
Happy learning. Cheers!
Rajat Kumar Singh (@johntradingwick)
Community Manager (India), TradingView
Trade ideas

Will NASDAQ's short run move INDIAN IT stocks? I'm not sure if the bear run is over, but it'd be good to find stocks for swing trading and to pump money into Mutual funds and long term holdigs.
will the momentum push infy towards sky?

Why Its time to go with INFY now I am sharing INFY chart on weekly time frame.
The idea is to trade this stock for few couple of weeks.
Reasons to pick this stock are:
1. On weekly time frame we have bullish engulfing candle stick pattern.
2. What I observed is, the stock has stopped making new low . The last low is in the month of June.
3. With the help of harmonics XABCD Pattern , we can calculate its probable next swing which comes around 1860 .
So we have a great risk to reward ratio.
risk is your SL which is 1438.
Final target is 1860.
Trust these simple things, like candle stick pattern, they do work..specially on weekly time frame.

Varun Beverages LtdVBL with Donchan Channel Explaning Varun Beverages Limited stock in equity segment with the Donchan Channel strategy for holding long term

INFY ON BUYSIDEHi.,
infy breakout on day chart after long consolitation..,
buy at current market price keep stop below 1525 day close basis target of 1660
the pattern is BOX or we can call at as triple bottom..
SL hunting also there ..,if hunting in stock it will move fast & furious
keep watch this for long side
thank u

INFY at a huge Risk to Reward opportunity !!Monthly TimeFrame : OverSold zone
Weekly TimeFrame : Accumulation
Daily TimeFrame : At a Orderblock

Infy trade setup for tomorrow after a sharp fall in it sector might chance of short covering in it sector all levels in given in chart

Intraday pick stocks for 25 augustInfy looking weak. Desending triangle pattern. Sell below 1533 Stop loss 1541 and target 1520.

Infosys - Looks Good for target 1680Infosys looking very good with rounding bottom pattern. May buy for easy target of 1680.

{Educational} ... Fight in INFY.......! Hello Everyone ... I m going to share one of my observation , may it will help all of you for understanding one of the way in which price flows ...........
Stomach Pattern Definition and Action.
1) Above Stomach Pattern
•What is Above Stomach Pattern ?
The above stomach pattern is a two candlestick pattern which evolves over a period of two sessions. It requires a existing downtrend and usually appears at the bottom of a downtrend.
• Psychology Behind Above Stomach Pattern.
The first day of the pattern, bears are still in control as we have a confirmed downtrend. Second day, price opens higher above the mid of point of previous filled candle and also closes above the mid point .This clearly indicates that sentiments have changed completely and further buying will happen in coming sessions.
• How to Trade Below Stomach Pattern ?
- Decision :
In case of Above stomach pattern,traders should start looking for buying opportunities, buy price should be around the close price of hollow candle after the filled candle.
- Stop loss :
What if the market reverse its direction after printing the above stomach pattern? The lowest low of the two candles making above stomach pattern will act as stop-loss in case that happen.
2) Below Stomach Pattern
• What Below Stomach Pattern ?
The below stomach pattern is a two candlestick pattern which evolves over a period of two sessions. It requires a existing uptrend and usually appears at the top of a uptrend.
• Psychology Behind Below Stomach Pattern
The first day of the pattern, bulls are still in control as we have a confirmed uptrend. Second day, price opens lower, below the mid of point of previous hollow candle and also closes below the midpoint .This clearly indicates that sentiments have changed completely and further selling will happen in coming sessions.
• How to Trade Below Stomach Pattern.
- Decision :
In case of Below stomach pattern,traders should start looking for selling opportunities, sell price should be around the close price of filled candle after the hollow candle.
- Stop loss :
What if the market reverse its direction after printing the below stomach pattern? The highest high of the two candles making below stomach pattern will act as stop-loss in case that happen.
• Main Points to Consider
• If it appears at support/resistance , it will make for high probability setup.
• Pattern with large body works better compared to the pattern with short bodies.


Infosys long tradeOn regression rend, it has made bottom at the low and it is poised to move North. Any closing above 1489 then it will fill the gap on daily chart.

Infosys Ltd - ShortInfosys CMP is at Resistance level. Bearish reversal pattern (Hanging man pattern) can be seen and the RSI indicator also indicates the overbought zone. We can expect an trend reversal from here.
*Educational purpose only!

Infy- InfosysInfy- It formed clear Tripple Bottom and also Ascending Triangle Which shows its ready for the up move as market as Target
Disc- Only for Learning Purpose and not a trading Recommendation.

INFY building LongTranch1 - 49 shares at 1545
1. Market is in what stage - Identified by what kind of highs and lows that are being formed + movement of price w.r.t 21, 50 and 200 EMA
Price in range since Aug 2021, now started decline on 6 May i.e. broke previous support, will build poistions at major supports
2. Is there any trend reversal in play?
1. Multiple divergence confirmations on MACD , RSI and MFI? No
2. At important support or resistance - horizontal - Yes - 1564
3. At important confluence of EMAs + price + support - Yes - Weekly 50
3. How are the candlesticks behaving and what is the volume doing
Candlesticks -LL LL
4. Is there any trend continuation in play?
Currently dropping, may drop more.. next big support 1369
5. Is there any pullback or breakout in play with volume confirmation from a strong horizontal level (support or resistance)
No
6. Fundamental factors in play
1. Revenue growth - EPS vs PE ratio - last 5 years comparison - EPS rising quarterly + Yearly... PE lowest in last 6 months - revenue and profit growth very strong
2. Are institutional investors/promotors increasing their stake - No major change, all constant

INFY forming inverse H&S patternBUY INFY above 1565 breaking out of inverse h&s pattern on weekly timeframe. TGT 1690/1720. invalid below 1540 on two days closingbasis

Infosys Breaking Out from Consolidation Infosys Breaking from consolidation after long time, One can go long for a swing keeping a stop loss of 1499/-
Stock Also forming higher high on 1h time frame with Cup and Handle breakout with decent volume.


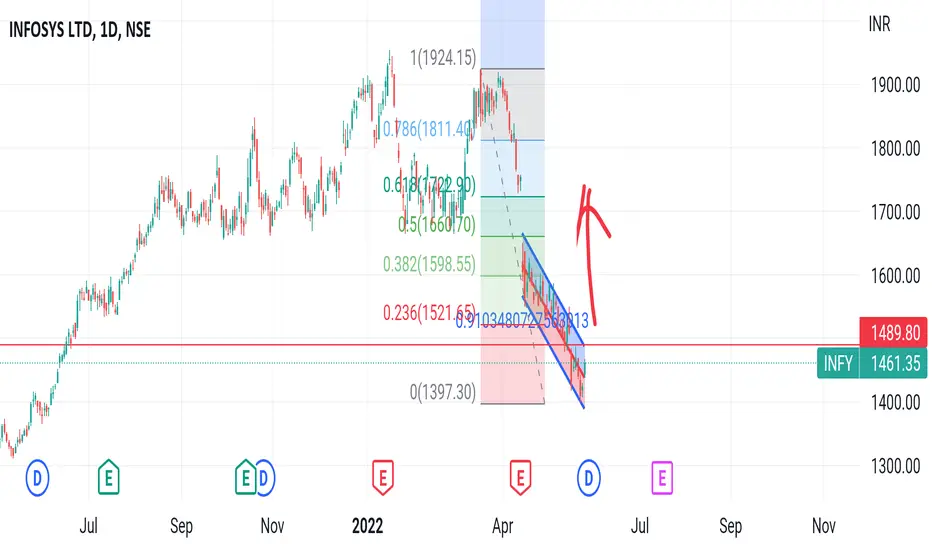
Infy Fib levels for swing trade (Learning purpose)Infy Fib levels for swing trade, let the the hourly candle closes above the entry point to take a trade

INFYNSE:INFY
One Can Go long with a Strict SL below the Trendline or Swing Low of Daily Candle.
Close should be good, and Clean.
R:R ratio should be 1 :2 .
Disclaimer : You are responsible for your Profits and loss, Shared for Educational purpose


Infosys lTD to take long entryNow turn for IT sector booming. Long after the BO of Inverse head and should pattern after the BO of Neckline. For the very huge target with minimum risk. Very good risk-to-reward trade setup. This is for your educational purpose only.
