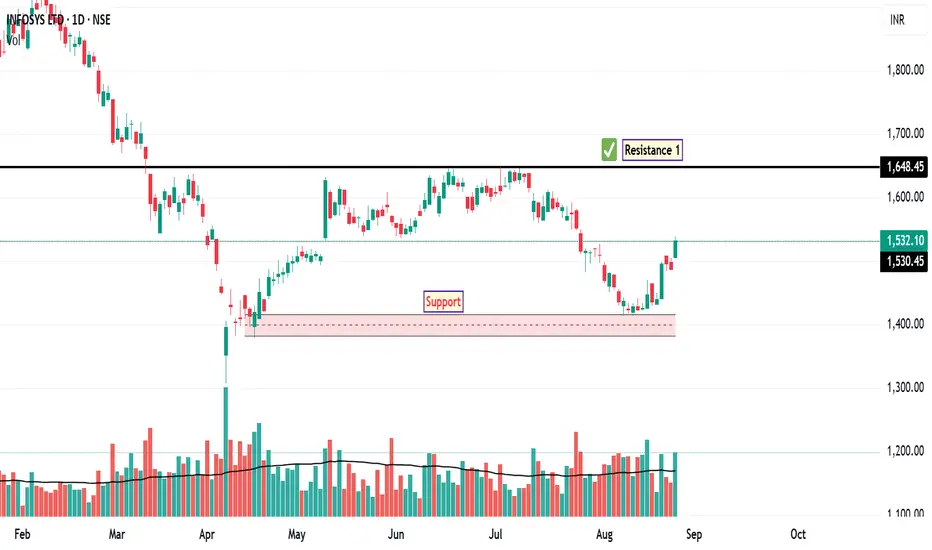
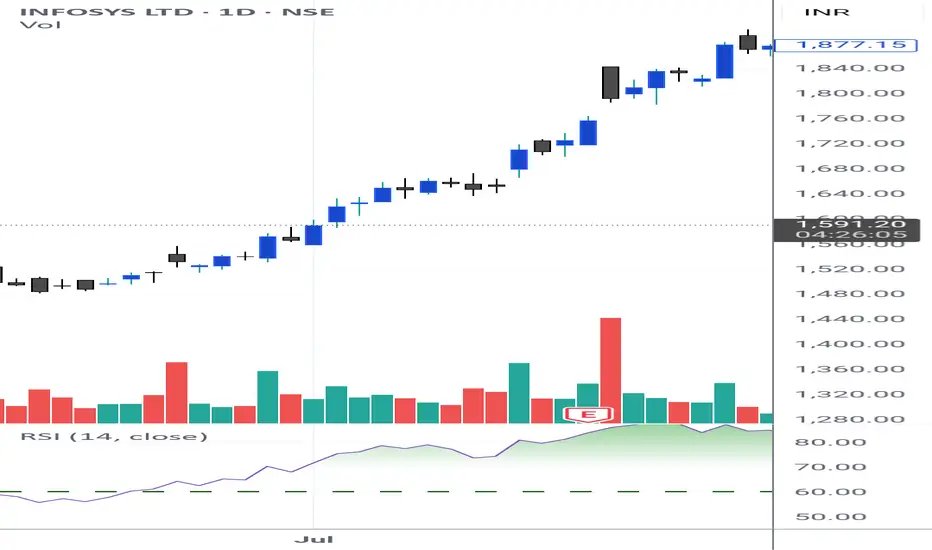
INFY: Swing SetupAfter experiencing a sustained downtrend since February 2025, Infosys has recently shown signs of a potential reversal on the daily chart. The stock has managed to close above its 50-day EMA, indicating a shift in short-term momentum and suggesting that buyers are beginning to regain control.
The RSI is currently hovering near the 60 level, which reflects improving bullish sentiment without yet entering overbought territory. This positioning often precedes further upside if supported by volume and price action.
Additionally, today's price action saw Infosys touch the upper Bollinger Band, a technical signal that often precedes a short-term pullback or consolidation. However, it can also indicate strong momentum if the price continues to ride the band. This move suggests a potential retest of the recent swing high near ₹1480 .
From a structural standpoint, the next key resistance level is identified at ₹1648 , which aligns with previous supply zones and Fibonacci retracement levels. On the downside, a logical stop-loss placement would be just below ₹1417 , which serves as a near-term support and a level where the bullish structure would be invalidated if breached.
Disclaimer: This analysis is for educational and informational purposes only. It does not constitute investment advice or a recommendation to buy, sell, or hold any security. Always conduct your own research or consult a licensed financial advisor before making investment decisions.
Trade ideas
INFOSYS: A stock to consider adding to your portfolioHello,
Infosys Limited (NSE: INFY, NYSE: INFY) has long been one of the crown jewels of India’s IT sector. Founded in 1981, the company has grown into a global leader in consulting, technology, and outsourcing services. Today, Infosys is not only a key player in India’s digital transformation but also a significant competitor on the global stage against names like Accenture, IBM, and Capgemini. Infosys offers a broad suite of services—ranging from application development, engineering, and cloud solutions to its flagship banking platform, Finacle. Its operations are diversified across industries:
• Financial Services & Insurance
• Manufacturing & Hi-Tech
• Energy, Utilities & Communication
• Retail, Consumer & Logistics
• Life Sciences & Healthcare
The competition is intense. Infosys battles with domestic rivals like TCS, Wipro, HCL Tech, LTIMindtree, and globally with Accenture, Cognizant, IBM, and Capgemini. Still, Infosys has carved out a strong position thanks to its cost efficiency, high-quality talent pool, and scalable digital solutions.
One thing investors love about Infosys is consistency. Over the last 10 years, revenue has climbed from ₹501.33B in 2013 to ₹1.63T in 2024. That’s more than 3x growth in just a decade. Even in the last financial year, despite global tech spending slowdown, revenues still grew +6% YoY.
Net Income tells a similar story. In 2013, the company earned ₹106.56B, but by 2024 that figure swelled to ₹267.13B. Net margins have stayed healthy, averaging ~16% over the last three years. Return metrics are impressive too:
• ROA: 18.57%
• ROE: 30.63%
Infosys runs a very clean balance sheet. Assets stood at ₹1.38T in 2024 against a very manageable ₹83.59B in debt. That low leverage gives the company flexibility to weather downturns and invest in growth.
Cash is king, and Infosys has plenty of it. Free cash flow has grown from ₹94.56B in 2013 to ₹354.97B in 2024. This allows the company to fund innovation, buy back shares, and keep rewarding investors through dividends.
Infosys is set to release its next earnings report on October 16th, 2025, with analysts expecting an EPS of ₹17.47. This could be a key event to watch for short-term volatility.
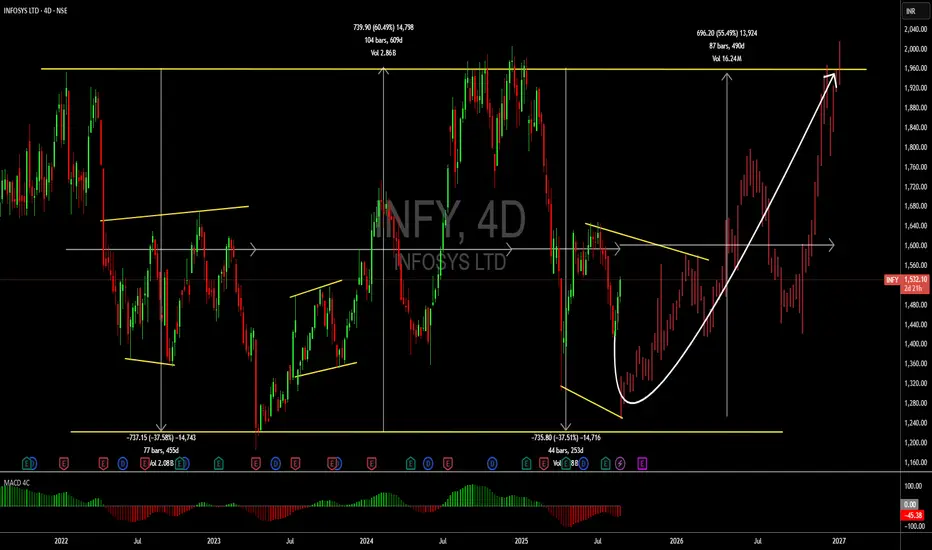
From a technical perspective the stock has been on a sideways move since 2022 and is currently trading at the bottom of the flat channel. We see this as a perfect time for investors to join into the upward move as the current valuations present a perfect entry opportunity. We see INR 1960 as a short term achieve.
Commodities & Currency TradingIntroduction
Financial markets are not limited to stocks and bonds. Beyond equity trading, two of the most important and widely traded asset classes are commodities and currencies (forex). These markets are essential for global trade, economic stability, and investment diversification. They are vast, liquid, and influenced by macroeconomic, geopolitical, and natural factors.
Commodities represent real physical goods like gold, crude oil, wheat, or natural gas.
Currencies represent the exchange rate between two different countries’ monetary systems, like USD/INR or EUR/USD.
Both markets attract traders, investors, speculators, and hedgers. While commodities protect against inflation and provide opportunities during supply-demand imbalances, currency trading allows participants to profit from fluctuations in exchange rates, driven by international trade, interest rates, and monetary policy.
In this guide, we will explore these markets in depth, covering fundamentals, participants, trading mechanisms, strategies, risks, and practical tips for success.
Part 1: Understanding Commodities Trading
What are Commodities?
Commodities are raw materials or primary goods used in commerce. They are standardized, meaning one unit of a commodity is interchangeable with another unit of the same grade and quality. For example, one barrel of crude oil or one ounce of gold is the same everywhere.
Types of Commodities:
Metals – Gold, silver, platinum, copper, aluminum.
Energy – Crude oil, natural gas, coal, gasoline.
Agricultural Products – Wheat, corn, coffee, sugar, cotton.
Livestock – Cattle, hogs, poultry.
Why Trade Commodities?
Hedging: Farmers, oil producers, and companies hedge against price fluctuations.
Speculation: Traders bet on rising or falling prices for profit.
Diversification: Commodities often move differently than stocks and bonds.
Inflation Hedge: Gold and oil, for example, rise when currency value falls.
Commodity Exchanges
Trading takes place on global exchanges such as:
Chicago Mercantile Exchange (CME) – US-based futures and derivatives.
London Metal Exchange (LME) – Specializes in metals.
Multi Commodity Exchange (MCX) – India’s largest commodity exchange.
Intercontinental Exchange (ICE) – Covers energy, agricultural, and financial products.
Forms of Commodity Trading
Spot Trading – Buying or selling the physical commodity for immediate delivery.
Futures Trading – Contracts to buy/sell at a predetermined price on a future date.
Options on Commodities – Gives the right, not obligation, to buy or sell futures.
Commodity ETFs – Exchange-traded funds that track commodity prices.
CFDs (Contracts for Difference) – Speculating on price without owning the commodity.
Key Influences on Commodity Prices
Supply & Demand – Fundamental factor; drought affects wheat, OPEC decisions affect oil.
Geopolitics – Wars, sanctions, and trade disputes impact energy and metals.
Weather & Natural Disasters – Hurricanes affect crude oil; droughts impact crops.
Currency Movements – Commodities priced in USD; weaker USD makes commodities cheaper globally.
Technology & Alternatives – Renewable energy can reduce demand for oil and coal.
Example: Gold Trading
Gold is considered a safe-haven asset. When equity markets are uncertain, investors flock to gold. It is traded both physically and via futures contracts. Factors affecting gold include inflation, central bank policies, and geopolitical risks.
Part 2: Understanding Currency Trading (Forex)
What is Forex?
Forex (Foreign Exchange) is the world’s largest and most liquid financial market, with daily turnover exceeding $7 trillion (BIS 2022). It involves trading one currency against another, such as USD/JPY or EUR/INR.
Currency Pairs
Currencies are quoted in pairs:
Major Pairs – USD paired with EUR, GBP, JPY, CHF, AUD, CAD.
Minor Pairs – Non-USD pairs like EUR/GBP or AUD/NZD.
Exotic Pairs – Emerging market currencies like USD/INR, USD/TRY.
Example:
EUR/USD = 1.1000 means 1 Euro = 1.10 US Dollars.
Why Trade Currencies?
Speculation: Profiting from price movements.
Hedging: Companies hedge against foreign exchange risks in trade.
Arbitrage: Exploiting differences between currency markets.
Global Trade: Facilitates international business transactions.
Participants in Forex
Central Banks – Control monetary policy and intervene in markets.
Commercial Banks – Provide liquidity.
Corporations – Hedge foreign earnings or payments.
Hedge Funds & Investors – Large speculators.
Retail Traders – Small participants trading via brokers.
Trading Mechanisms
Spot Forex – Immediate exchange of currencies.
Forward Contracts – Agreement to exchange at a future date.
Futures & Options – Standardized exchange-traded contracts.
CFDs – Retail traders speculate without owning currencies.
Factors Affecting Currency Prices
Interest Rates – Higher rates attract foreign capital.
Inflation – High inflation weakens a currency.
Economic Indicators – GDP, employment, trade balance.
Geopolitical Events – Elections, wars, sanctions.
Central Bank Policies – Quantitative easing, intervention.
Risk Sentiment – “Risk-on” favors emerging currencies, “Risk-off” favors safe-havens like USD/JPY/CHF.
Example: USD/INR
If the US Federal Reserve raises interest rates, demand for USD increases, and INR weakens. Conversely, strong Indian GDP data could strengthen INR.
Part 3: Strategies in Commodities Trading
Trend Following – Trade in direction of price momentum.
Seasonal Trading – Agricultural commodities follow cycles.
Spread Trading – Long one commodity, short another (e.g., WTI vs Brent crude).
Hedging – Farmers lock prices using futures.
Technical Analysis – Using charts, candlestick patterns, indicators.
Part 4: Strategies in Currency Trading
Carry Trade – Borrow in low-interest-rate currency, invest in high-yielding one.
Scalping & Day Trading – Small, quick profits in liquid pairs like EUR/USD.
Swing Trading – Capture medium-term currency trends.
News Trading – Trading around economic releases (NFP, CPI, Fed rate decisions).
Hedging – Companies use forwards to protect against currency risk.
Part 5: Risks in Commodities & Currency Trading
Leverage Risk: Both markets offer high leverage, magnifying losses.
Price Volatility: Sudden moves due to geopolitical or natural events.
Liquidity Risk: Exotic currencies and less-traded commodities may have low liquidity.
Counterparty Risk: In OTC forex and CFD markets.
Regulatory Risk: Government bans, restrictions, and policy shifts.
Emotional Risk: Greed and fear drive many traders into poor decisions.
Part 6: Risk Management & Best Practices
Position Sizing – Never risk more than 1–2% of capital on a single trade.
Stop-Loss Orders – Protect against unexpected volatility.
Diversification – Trade multiple commodities/currencies, not just one.
Stay Informed – Follow economic calendars, OPEC meetings, and weather reports.
Technical + Fundamental Mix – Balance chart reading with economic analysis.
Avoid Over-Leverage – Excessive borrowing leads to margin calls.
Keep a Trading Journal – Track mistakes and learn from them.
Part 7: Future Trends in Commodities & Currencies
Digital Currencies (CBDCs & Cryptocurrencies) may influence forex.
Green Energy Transition will shift commodity demand from oil/coal to lithium, copper, and renewable resources.
Algorithmic & AI Trading is expanding in both markets.
Geopolitical Fragmentation will continue to impact global trade and currency alignments.
Conclusion
Commodities and currency trading are the lifeblood of the global economy. They are more than speculative arenas—they enable trade, protect producers and consumers, and balance international financial systems.
For traders, these markets provide immense opportunities, but also demand discipline, knowledge, and risk management. A successful trader must understand both macroeconomic fundamentals and technical signals, while maintaining emotional control.
In the end, whether trading gold futures or EUR/USD pairs, the principles remain the same: manage risk, stay informed, follow discipline, and trade with a plan.

INFY Bullish Setup** IF you like my observation, please boost and follow for more content."
Ticker: INFY
Time Frame: 1-Hour
Trade Type: Bullish
Entry Point: 1486.20
Target Price (TP): 1589.15
Stop Loss (SL): 1417.45
Risk-to-Reward Ratio (RRR): 1:1.5
Trade Setup and Rationale:
Market Context:
INFY has been showing signs of recovery, breaking out of a corrective phase. The price is currently positioned for a potential uptrend, supported by a significant bullish pattern forming on the chart.
Entry Point (1486.20):
The price has recently tested a support zone and is now showing signs of a strong reversal. The entry point is set just above this level, ensuring a confirmation of the bullish trend before committing to the trade.
Target Price (1589.15):
The target is set at a key resistance level where price is expected to face potential selling pressure. This level aligns with previous highs and is a reasonable place to lock in profits while riding the trend.
Stop Loss (1417.45):
The stop loss is placed just below the recent swing low, ensuring that the trade has a controlled risk. This placement minimizes the risk of getting stopped out in case of minor fluctuations while keeping the risk-to-reward ratio favorable.
Trade Logic:
The trade is supported by a bullish breakout pattern with increasing volume. After a period of consolidation, price action is showing signs of upward momentum, making this a high-probability trade setup.
The risk-to-reward ratio of 1:1.5 offers a balanced risk for the potential reward, providing a good trading opportunity with a well-placed stop loss.
Volume Confirmation:
Volume is showing a steady increase as the price starts moving upward, indicating that market participants are supporting the bullish move.
Trend Confirmation:
The trend is confirmed by the price breaking above previous resistance, and the bullish setup aligns with the market structure.

Banking & Financial Sector TradingIntroduction
The banking and financial sector is often called the “backbone of the economy.” It provides credit, liquidity, and financial services that allow businesses, governments, and households to function smoothly. In the stock market, the Bank Nifty Index (for banking) and the Nifty Financial Services Index (for financials) are widely tracked because they reflect the health of India’s financial system. Traders and investors keep a very close eye on these sectors because movements here often lead the overall market direction.
Trading in the banking and financial sector is not just about price speculation—it’s about understanding monetary policy, liquidity, credit cycles, interest rates, and even global market cues. In India, the sector is home to giant players like HDFC Bank, ICICI Bank, SBI, Axis Bank, Kotak Mahindra Bank, Bajaj Finance, HDFC Ltd., and insurance companies like SBI Life, ICICI Prudential, etc. These stocks often have high weightage in Nifty 50 and Bank Nifty, making them critical for traders.
In this guide, we’ll explore the dynamics of banking and financial sector trading in detail—covering fundamentals, technical aspects, strategies, and risks.
1. Importance of Banking & Financial Sector in Markets
1.1. Market Leadership
Banking and financial stocks carry a huge weightage in indices like Nifty 50 (about 35–40%) and Bank Nifty (100% financials).
Their movement can pull up or drag down the entire market.
1.2. Economic Indicator
A strong banking sector signals credit growth, consumer demand, and corporate expansion.
Weak banking stocks often warn of bad loans (NPAs), liquidity crunches, or slowing growth.
1.3. Liquidity Provider
Banks are intermediaries that channel savings into investments.
NBFCs (Non-Banking Financial Companies) provide credit in segments where banks are limited (retail loans, small businesses, etc.).
1.4. Regulatory Influence
RBI policy decisions (repo rate, CRR, SLR) directly impact profitability of banks and NBFCs.
Insurance and AMC regulations also affect financial services companies.
2. Key Drivers of Banking & Financial Stocks
2.1. Interest Rates & Monetary Policy
Banks earn profit through Net Interest Margin (NIM) = Interest earned – Interest paid.
When RBI hikes rates, borrowing costs rise, loan demand may slow, and NIMs can shrink.
NBFCs, which depend on borrowing from banks/markets, suffer more in a rising rate cycle.
2.2. Credit Growth
Rising loan disbursements (retail, housing, corporate) show healthy demand and economic expansion.
Slowing credit growth indicates weak business activity.
2.3. Asset Quality & NPAs
Non-performing assets (bad loans) directly impact profitability.
Market reacts sharply to NPA trends in quarterly results.
2.4. Global Cues
US Fed interest rates, global liquidity, and FII flows strongly influence Indian financials.
Banking and financial stocks are FII favorites due to their scale and liquidity.
2.5. Regulations & Reforms
RBI norms on lending, provisioning, and digital banking.
Reforms like PSU bank recapitalization or mergers often trigger big moves.
3. Major Segments in Banking & Financial Sector
3.1. Public Sector Banks (PSBs)
Examples: SBI, PNB, Bank of Baroda.
Sensitive to government policies and recapitalization news.
Often trade at lower valuations compared to private banks.
3.2. Private Sector Banks
Examples: HDFC Bank, ICICI Bank, Axis Bank, Kotak Bank.
Preferred by investors for efficiency, growth, and better asset quality.
3.3. NBFCs & Housing Finance Companies (HFCs)
Examples: Bajaj Finance, HDFC Ltd., LIC Housing Finance.
More volatile due to dependence on borrowing.
Sensitive to liquidity conditions (IL&FS crisis in 2018 showed the risks).
3.4. Insurance Companies
Examples: SBI Life, HDFC Life, ICICI Prudential.
Long-term business models; growth tied to financialization of savings.
Sensitive to regulations, persistency ratios, and premium growth.
3.5. Asset Management Companies (AMCs)
Examples: HDFC AMC, Nippon Life AMC.
Earnings linked to equity market performance and SIP inflows.
4. Trading Approaches for Banking & Financial Sector
4.1. Fundamental Trading
Focus on quarterly results (NIMs, NPAs, loan growth, provisions).
Trade based on monetary policy expectations.
Position around events like RBI policy, Fed meetings, budget announcements.
4.2. Technical Trading
Use Bank Nifty and FinNifty charts for market direction.
Patterns like breakouts, volume surges, and moving averages are reliable due to high liquidity.
4.3. Options Trading in Bank Nifty
Bank Nifty options are among the most liquid in India.
Strategies: Straddle, Strangle, Iron Condor, Bull Call Spread—especially effective around RBI policy days.
4.4. Event-Based Trading
Quarterly earnings: Banks often move 5–10% after results.
RBI policy announcements: Big intraday volatility.
Budget & government announcements: Impact PSBs and NBFCs.
5. Key Trading Strategies
5.1. Bank Nifty Trend Following
Use 20-day & 50-day EMA crossover.
Trade long when 20 > 50 EMA, short when 20 < 50 EMA.
5.2. Volume Profile & Support-Resistance
Identify high-volume zones on Bank Nifty to trade breakouts.
Example: A breakout above 50,000 level with high volume often leads to strong momentum.
5.3. Options Straddle for RBI Days
Place both Call and Put options near ATM (at-the-money).
RBI policy usually triggers sharp moves, giving profit on one side.
5.4. Pair Trading
Go long on strong private bank (e.g., ICICI Bank) and short on weaker PSU bank (e.g., PNB).
Profits from relative performance rather than market direction.
5.5. Momentum Trading in NBFCs
Stocks like Bajaj Finance, HDFC Ltd. show sharp moves.
Trade based on breakout with tight stop-loss.
6. Risk Management in Banking & Financial Trading
6.1. Volatility Risk
Bank Nifty is more volatile than Nifty.
Use proper stop-loss and position sizing.
6.2. Event Risk
RBI meetings, global Fed decisions can cause whipsaws.
Hedge positions with options.
6.3. Credit Cycle Risk
Sudden rise in NPAs (like during COVID) can crash banking stocks.
Always track asset quality updates.
6.4. Liquidity Risk in NBFCs
NBFCs may face liquidity crunches (e.g., IL&FS crisis).
Traders must stay alert to bond market signals.
7. Case Studies
7.1. Yes Bank Crisis (2018–2020)
Once a market darling, collapsed due to hidden NPAs.
Stock crashed from ₹400+ to below ₹10.
Lesson: Always track asset quality, not just growth numbers.
7.2. HDFC Bank Consistency
Delivered consistent growth in NIMs and low NPAs for years.
Became a favorite for traders and investors alike.
7.3. Bajaj Finance Volatility
Known for strong growth but sharp corrections.
A stock loved by momentum traders.
8. Future Trends in Banking & Financial Sector
8.1. Digital Banking
UPI, fintech partnerships, and digital lending will reshape the sector.
Stocks tied to fintech may see explosive growth.
8.2. Consolidation of PSBs
Mergers will strengthen balance sheets and efficiency.
Trading opportunities in re-rating of PSU banks.
8.3. Global Integration
Indian financial stocks will be increasingly influenced by global capital flows.
8.4. Rise of Retail Participation
Growing SIPs and insurance penetration will boost financial stocks.
9. Practical Trading Checklist
📌 Track RBI policy and global central banks.
📌 Watch NIMs, NPAs, and credit growth in results.
📌 Use Bank Nifty chart for market direction.
📌 Trade with stop-loss and manage risk carefully.
📌 Use options strategies during high-volatility events.
Conclusion
The banking and financial sector is the heartbeat of the stock market. Traders must understand interest rate cycles, credit growth, and regulatory changes to succeed. With indices like Bank Nifty and FinNifty, this sector offers huge liquidity, volatility, and opportunities for both short-term and long-term traders.
Whether you are trading a PSU bank breakout, riding a private bank trend, playing NBFC volatility, or hedging with Bank Nifty options, success depends on combining fundamental awareness with technical precision and disciplined risk management.
In India’s growth journey, the financial sector will continue to lead—making it one of the most exciting and rewarding sectors for trading.

Trading Master ClassIntroduction to Options Trading
Options trading is one of the most flexible and powerful tools in the financial markets. Unlike stocks, where you simply buy and sell ownership of a company, options are derivative contracts that give you the right, but not the obligation, to buy or sell an underlying asset at a predetermined price within a specified time frame.
The beauty of options lies in their strategic possibilities — they allow traders to make money in rising, falling, or even sideways markets, often with less capital than buying stocks outright. But with that flexibility comes complexity, so understanding strategies is crucial.
Key Terms in Options Trading
Before we jump into strategies, let’s understand the key terms:
Call Option – Gives the right to buy the underlying asset at a fixed price (strike price) before expiry.
Put Option – Gives the right to sell the underlying asset at a fixed price before expiry.
Strike Price – The price at which you can buy/sell the asset.
Premium – The price you pay to buy an option.
Expiry Date – The date the option contract ends.
ITM (In-the-Money) – When exercising the option would be profitable.
ATM (At-the-Money) – Strike price is close to the current market price.
OTM (Out-of-the-Money) – Option has no intrinsic value yet.
Lot Size – Minimum number of shares/contracts per option.
Intrinsic Value – The real value if exercised now.
Time Value – Extra premium based on time left to expiry.

Technical Analysis for Modern Markets1. Introduction to Technical Analysis (TA)
Technical Analysis (TA) is the study of price action, volume, and market data to forecast future price movements. Unlike Fundamental Analysis (FA), which focuses on the intrinsic value of an asset, TA focuses on how the market is behaving rather than why it behaves that way.
The core idea is simple:
All known information is already reflected in the price, and market behavior tends to repeat because human psychology is consistent.
However, in modern markets — dominated by high-frequency trading (HFT), AI algorithms, global interconnection, and social media-driven sentiment — TA has evolved far beyond simple chart patterns.
2. The Core Principles of Technical Analysis
Charles Dow, considered the father of TA, laid the groundwork in the late 19th century. His principles still hold today, even with algorithmic speed:
Price Discounts Everything
All factors — earnings, news, global events — are already priced in.
Prices Move in Trends
Markets move in identifiable trends until they reverse.
History Tends to Repeat Itself
Patterns emerge because market participants (humans or algorithms programmed by humans) react in similar ways over time.
3. Evolution of Technical Analysis in Modern Markets
Old Era (pre-2000s):
Hand-drawn charts, daily candles, minimal computing power.
Indicators like RSI, MACD, and Moving Averages dominated.
Modern Era (2000s–Present):
Intraday data down to milliseconds.
AI-powered trading systems scanning thousands of instruments simultaneously.
Social sentiment analysis integrated into price action.
Cross-market correlations (forex, equities, crypto, commodities).
Volume profile, order flow, and market microstructure becoming mainstream.
Why it matters:
Today’s TA must adapt to speed, complexity, and noise.
4. Types of Technical Analysis
4.1. Chart-Based Analysis
This is the visual study of price movement:
Candlestick Charts — Show open, high, low, close (OHLC) data.
Line Charts — Simpler, based on closing prices.
Heikin Ashi & Renko — Smooth out market noise.
Modern use: Candlestick charts are still king, but traders combine them with volume profile and order flow data for deeper insight.
4.2. Indicator-Based Analysis
Indicators transform price/volume data mathematically to highlight trends and momentum.
Categories:
Trend Indicators
Moving Averages (SMA, EMA)
Ichimoku Cloud
Supertrend
Momentum Indicators
RSI (Relative Strength Index)
Stochastic Oscillator
MACD (Moving Average Convergence Divergence)
Volatility Indicators
Bollinger Bands
ATR (Average True Range)
Volume Indicators
On-Balance Volume (OBV)
Chaikin Money Flow (CMF)
Volume Profile (Modern favorite)
Modern twist:
Traders often use custom-coded indicators and multi-timeframe confluence instead of relying on one default indicator.
4.3. Market Structure Analysis
Instead of just indicators, traders look at:
Support & Resistance zones
Swing highs/lows
Break of Structure (BoS)
Liquidity zones (stop-hunt areas)
Modern adaptation: Market structure is paired with order flow & footprint charts for precision.
5. Volume Profile and Order Flow in Modern TA
Traditional TA often ignored volume’s deeper story. Now, Volume Profile and Order Flow show where trading activity is concentrated.
Volume Profile — Plots volume at price levels, revealing high-volume nodes (support/resistance zones).
Order Flow Analysis — Tracks buy/sell imbalances at specific prices using Level II and footprint charts.
Why it matters:
Institutions place orders at certain price clusters — knowing these can reveal hidden market intentions.
6. Multi-Timeframe Analysis (MTA)
Modern markets demand MTA:
Higher timeframe: Identifies the main trend (weekly, daily).
Lower timeframe: Finds precise entries (1-min, 5-min).
Example:
Weekly chart shows uptrend.
Daily chart shows pullback.
5-min chart shows bullish reversal candle at support → high-probability long entry.
7. Market Psychology in Technical Analysis
TA works largely because human emotions — fear and greed — repeat over time:
Fear causes panic selling at lows.
Greed causes overbuying at highs.
Even in algorithmic markets, humans program the algorithms — embedding the same patterns of overreaction.
8. Chart Patterns in Modern Context
Classic patterns still work but require confirmation due to fake-outs caused by HFT.
Common patterns:
Head & Shoulders
Double Top/Bottom
Triangles
Flags/Pennants
Modern approach:
Pair patterns with:
Volume confirmation
Breakout retests
Order flow validation
9. Fibonacci & Harmonic Trading
Fibonacci retracements/extensions identify potential reversal zones.
Harmonic patterns (Gartley, Bat, Butterfly) extend this with specific ratios.
Modern adaptation:
Combine Fibonacci with Volume Profile to find strong confluence zones.
Use algorithmic scanners to detect patterns instantly.
10. Supply and Demand Zones
Supply zones = where sellers overwhelm buyers.
Demand zones = where buyers overwhelm sellers.
Modern use:
Use multi-timeframe supply/demand mapping.
Watch for liquidity grabs before major moves.
Conclusion
Technical Analysis for modern markets is not just about drawing lines — it’s about understanding the story behind the price.
From candlesticks to order flow, from Fibonacci to AI sentiment tools, TA has evolved into a fusion of art and science.
In modern markets:
Speed matters.
Data depth matters.
Adaptability matters most.
Mastering TA means blending classic principles with cutting-edge tools, managing risk, and continuously learning — because markets, like technology, never stop evolving.
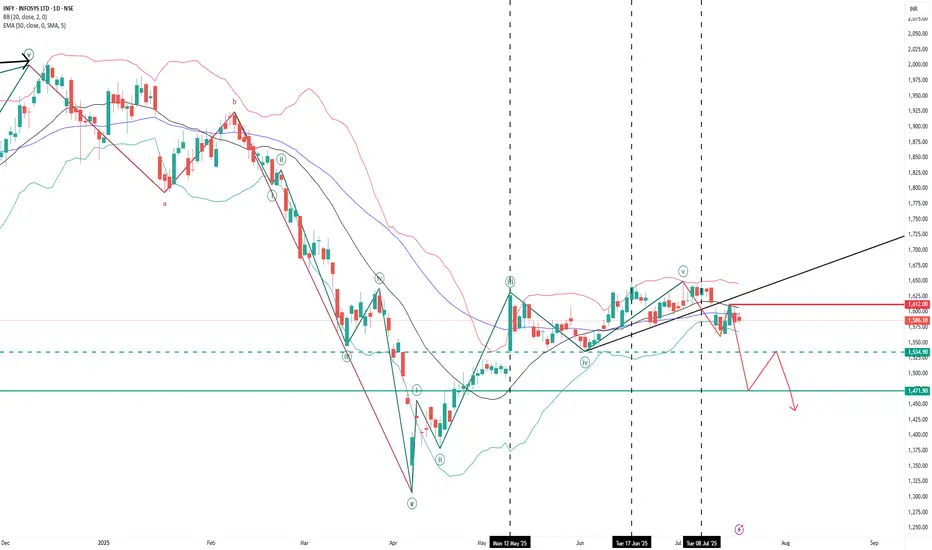
Buy Infosys, stop loss 1546Infosys completed its major correction on 7 April after correcting about 35%. The stock has been forming a new impulse wave ever since.
As given in the charts, the new impulse wave had a iii-wave extension and completed wave iii on 12 May and has been undergoing correction.
Rationale :
As marked in the charts, the structure represents a flat corrective structure under Elliot wave theory which is a 3-3-5 structure. Wave A (divides into three waves), wave B (divides into three waves) and wave C divides into 5-waves. The minimum requirement for wave A to Wave B ratio is >1 (for normal flat).
As given in the chart, the corrective structure complies with all above conditions. Wave C has a 5-wave structure, sub-wave three has an extension (i.e. it has its own 5 waves). At Wave 2-3 to 4 ratio of 0.5 stocked bounced up and in the process completing the minimum requirement of Wave A to Wave B ratio of >1. Given this there is a good possibility for stock to proceed upwards.
Buy with a stop loss of 1546, TP will be updated as waves unfold.

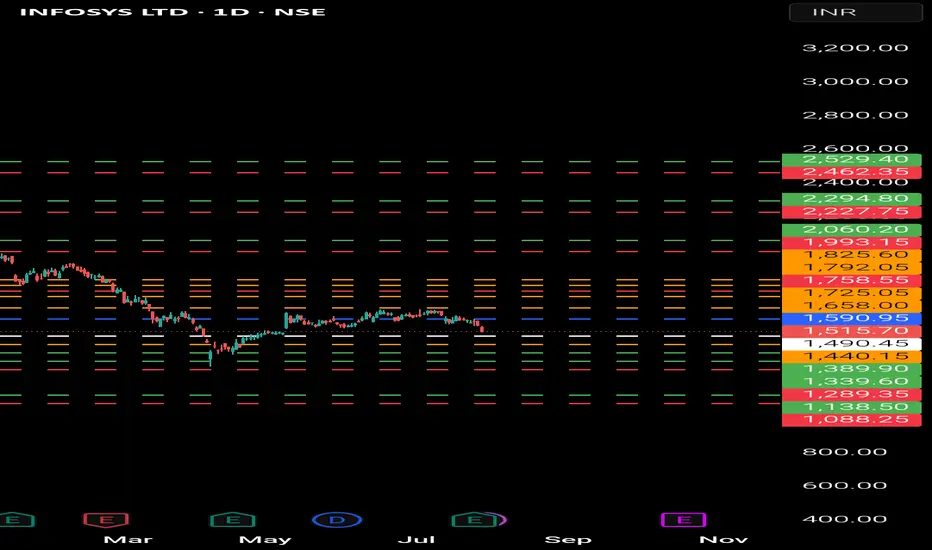
INFY (Infosys Ltd)- Analysis Bullish Levels -if sustain above 1591 (early entry risky) then 1658 then 1725 then 1759 safe entry if sustain above this for 2 weeks) target can be around 1993 to 2060 if sustain above for a week or two then we expect more upside and wait for targets around 2227 to 2294 then 2462 to 2529 if sustains above for two weeks then hold for long term
Bearish levels :- if sustain below 1490 to 1457 to 1440 below this bearish then 1389 to 1366 or 1339 good support with SL of 1289 below this more bearish. Then 1139 to 1088 will be the last hope
**Consider some Points buffer in above levels
**Disclaimer -
I am not a SEBI registered analyst or advisor. I does not represent or endorse the accuracy or reliability of any information, conversation, or content. Stock trading is inherently risky and the users agree to assume complete and full responsibility for the outcomes of all trading decisions that they make, including but not limited to loss of capital. None of these communications should be construed as an offer to buy or sell securities, nor advice to do so. The users understands and acknowledges that there is a very high risk involved in trading securities. By using this information, the user agrees that use of this information is entirely at their own risk.
Thank you.
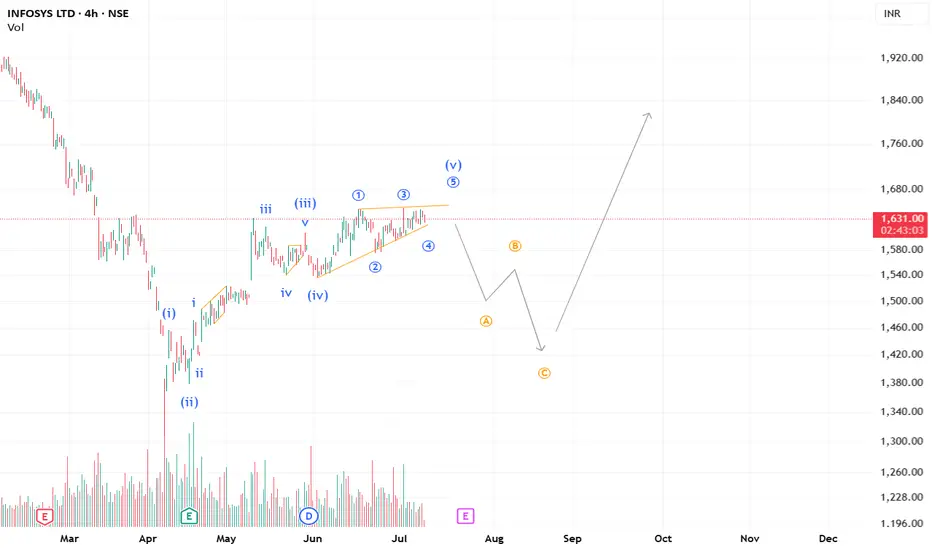
INFY : 4H : Bearish View=============================
INFY
=============================
Daily TF
-------------
Elliot Impulse waves 1-2-3-4-5 is complete.
Correction wave A-B seems complete and C to start anytime Soon.
Bearish Divergences visible.
Breakdown of Support Trendline and Re-testing seems complete.
Huge Call Writing visible.
================================
Swing Trading - Stock Options - Setup CE/PE🔥 Stock Options Trading Strategy – Built on Core Swing/Positional Principles (85% Win Rate Setup)
As a continuation of my last post on Swing and Positional Trading Setup with 85% Win Rate, I’m now sharing a Stock Options Trading Concept that follows the same core principles but is tailored specifically for liquid stock options.
You’ve already been provided with a list of 100+ high-beta, liquid stocks. For this strategy, you will strictly focus only on those stocks.
✅ Strategy Setup
🔹 Timeframe Filters:
• Monthly RSI > 60 (RSI has crossed and is holding above 60)
• Weekly RSI > 60 (same condition as above)
• Daily RSI: RSI must be crossing 60 or on the verge of crossing
Now, on the Daily Chart, mark the current swing high and swing low.
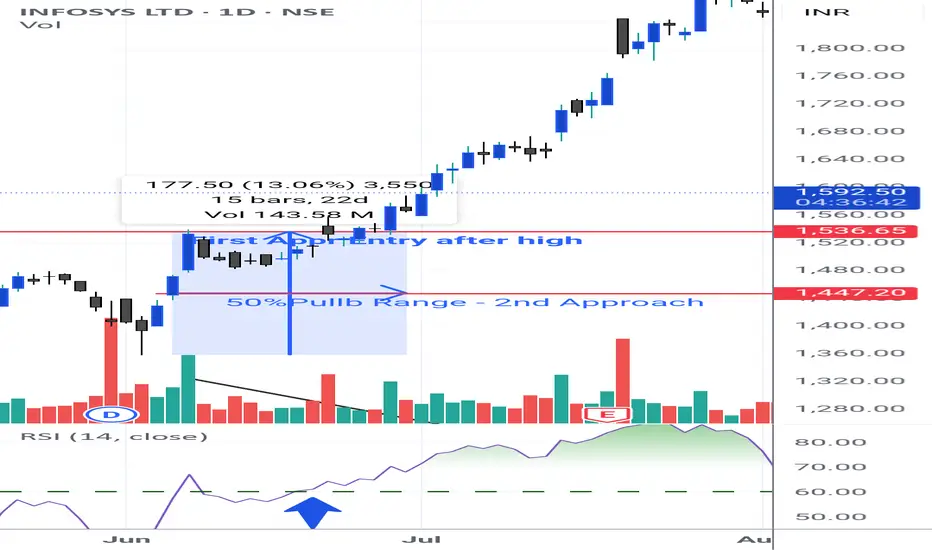
📌 Two Entry Approaches:
Approach 1: Breakout Entry
• Entry: When swing high is broken.
• Stop Loss (SL): Swing low or previous week’s low.
Approach 2: Pullback Entry
• Wait for a retracement from swing high (should not exceed 50% retracement).
• Confirmation of pullback weakness: Volume bars should be shrinking/decreasing.
• Entry: On breakout of the last candle high of the pullback.
• Stop Loss: Swing low or previous week’s low.
Once in the trade, trail your stop loss to cost after 3 consecutive bullish candles.
📤 Exit Rules
• Exit the Stock Options position only if the Daily RSI drops below 60.
⚠️ Important Guidelines for Stock Options
• 💡 Trade with only 1 lot. Never exceed your lot size.
• 📅 Enter after 2 days of the monthly expiry and exit before 2 days of next monthly expiry to avoid smart money manipulation.
• 🎯 Choose strike prices in multiples of 25, 50, 75, or 100 for better liquidity.
• Example: If stock is at 1564, choose 1550 ITM or 1575 ATM.
• ⏱️ For quick exits, always place exit orders at round numbers like 5 or 10 levels.
• Example: If you entered at ₹70 and the option is at ₹144, place an exit at ₹140 or ₹145—not any random price.
For PE buying-
Monthly RSI < 40
Weekly RSI < 40
Daily RSi crossing 40 or below
Same process for PE with 2 approach as you like but in reverse form.
🧠 Final Thoughts
Stick to this simple, structured setup. Don’t complicate it.
✅ Backtest thoroughly
✅ Understand each setup
✅ Plan your trades BEFORE entering, never after.
Let the market come to you—don’t chase it.
Disclaimer -
These posts are only to educate you all. You are responsible for the actions you take. Consult your advisor if you need. I am a Sr. Research Analyst in Equity Firm BUT not yet SEBI reg.
High Beta Stock List for Options-
🚗 Auto
• Bajaj Auto
• Bosch Ltd
• Eicher Motors
• Hero Motocorp
• Maruti Suzuki
• TVS Motors
• Tata Motors
🏦 Banking & Financial Services
• Bank of Baroda
• Kotak Mahindra Bank
• Axis Bank
• ICICI Bank
• HDFC Bank
• IndusInd Bank
• Bajaj Finserv
• Bajaj Finance
• SBI
🧪 Chemicals
• Aarti Industries
• Atul Ltd
• Navin Fluorine
• UPL
• Tata Chemicals
🍫 FMCG
• Britannia Industries
• Godrej Consumer
• Tata Consumer
• DMart
• Hindustan Unilever
• Dabur
💊 Pharma & Healthcare
• Apollo Hospitals
• Alkem Labs
• Biocon
• Divis Labs
• Dr. Reddy’s
• IPCA Labs
• Laurus Labs
• Lupin
• Aurobindo Pharma
• Sun Pharma
• Cipla
💻 IT Sector
• HCL Technologies
• Infosys
• LTIMindtree
• TCS
• Tech Mahindra
• Wipro
⛓️ Steel & Metals
• APL Apollo Tubes
• JSW Steel
• Jindal Steel
• Tata Steel
• Hindalco
• L&T
🛢️ Oil & Gas
• Reliance Industries
• Gujarat Gas
• Indraprastha Gas (IGL)
• Mahanagar Gas (MGL)
• Tata Power
🏢 Realty
• DLF Ltd
• Godrej Properties
• Lodha (Macrotech Developers)
• Oberoi Realty
• Phoenix Mills
🛋️ Durables & Others
• Sona BLW (Sona Comstar)
• Amber Enterprises
• Bata India
• Crompton Greaves
• Dixon Technologies
• Titan Company
• ACC Cement
• Ambuja Cement
• Ultratech Cement
• Voltas Ltd
• Polycab India
• Mazagon Dock (Mazdock)
• Asian Paints
• Berger Paints
Cummins
Swing Trading Stock Options - High Momentum Strategy🔥 Stock Options Trading Strategy – Built on Core Swing/Positional Principles (85% Win Rate Setup) -
As a continuation of my last post on Swing and Positional Trading Setup with 85% Win Rate, I’m now sharing a Stock Options Trading Concept that follows the same core principles but is tailored specifically for liquid stock options.
You’ve already been provided with a list of 100+ high-beta, liquid stocks. For this strategy, you will strictly focus only on those stocks.
✅ Strategy Setup
🔹 Timeframe Filters:
• Monthly RSI > 60 (RSI has crossed and is holding above 60)
• Weekly RSI > 60 (same condition as above)
• Daily RSI: RSI must be crossing 60 or on the verge of crossing
Now, on the Daily Chart, mark the current swing high and swing low.
📌 Two Entry Approaches:
Approach 1: Breakout Entry
• Entry: When swing high is broken.
• Stop Loss (SL): Swing low or previous week’s low.
Approach 2: Pullback Entry
• Wait for a retracement from swing high (should not exceed 50% retracement).
• Confirmation of pullback weakness: Volume bars should be shrinking/decreasing.
• Entry: On breakout of the last candle high of the pullback.
• Stop Loss: Swing low or previous week’s low.
Once in the trade, trail your stop loss to cost after 3 consecutive bullish candles.
📤 Exit Rules
• Exit the Stock Options position only if the Daily RSI drops below 60.
⚠️ Important Guidelines for Stock Options
• 💡 Trade with only 1 lot. Never exceed your lot size.
• 📅 Enter after 2 days of the monthly expiry and exit before 2 days of next monthly expiry to avoid smart money manipulation.
• 🎯 Choose strike prices in multiples of 25, 50, 75, or 100 for better liquidity.
• Example: If stock is at 1564, choose 1550 ITM or 1575 ATM.
• ⏱️ For quick exits, always place exit orders at round numbers like 5 or 10 levels.
• Example: If you entered at ₹70 and the option is at ₹144, place an exit at ₹140 or ₹145—not any random price.
For PE buying-
Monthly RSI < 40
Weekly RSI < 40
Daily RSi crossing 40 or below
Same process for PE with 2 approach as you like but in reverse form.
🧠 Final Thoughts
Stick to this simple, structured setup. Don’t complicate it.
✅ Backtest thoroughly
✅ Understand each setup
✅ Plan your trades BEFORE entering, never after.
Let the market come to you—don’t chase it.
Disclaimer -
These posts are only to educate you all. You are responsible for the actions you take. Consult your advisor if you need. I am a Sr. Research Analyst in Equity Firm BUT not yet SEBI reg.
100+ Stocks List - High Beta -
🚗 Auto
• Bajaj Auto
• Bosch Ltd
• Eicher Motors
• Hero Motocorp
• Maruti Suzuki
• TVS Motors
• Tata Motors
🏦 Banking & Financial Services
• Bank of Baroda
• Kotak Mahindra Bank
• Axis Bank
• ICICI Bank
• HDFC Bank
• IndusInd Bank
• Bajaj Finserv
• Bajaj Finance
• SBI
🧪 Chemicals
• Aarti Industries
• Atul Ltd
• Navin Fluorine
• UPL
• Tata Chemicals
🍫 FMCG
• Britannia Industries
• Godrej Consumer
• Tata Consumer
• DMart
• Hindustan Unilever
• Dabur
💊 Pharma & Healthcare
• Apollo Hospitals
• Alkem Labs
• Biocon
• Divis Labs
• Dr. Reddy’s
• IPCA Labs
• Laurus Labs
• Lupin
• Aurobindo Pharma
• Sun Pharma
• Cipla
💻 IT Sector
• HCL Technologies
• Infosys
• LTIMindtree
• TCS
• Tech Mahindra
• Wipro
⛓️ Steel & Metals
• APL Apollo Tubes
• JSW Steel
• Jindal Steel
• Tata Steel
• Hindalco
• L&T
🛢️ Oil & Gas
• Reliance Industries
• Gujarat Gas
• Indraprastha Gas (IGL)
• Mahanagar Gas (MGL)
• Tata Power
🏢 Realty
• DLF Ltd
• Godrej Properties
• Lodha (Macrotech Developers)
• Oberoi Realty
• Phoenix Mills
🛋️ Durables & Others
• Sona BLW (Sona Comstar)
• Amber Enterprises
• Bata India
• Crompton Greaves
• Dixon Technologies
• Titan Company
• ACC Cement
• Ambuja Cement
• Ultratech Cement
• Voltas Ltd
• Polycab India
• Mazagon Dock (Mazdock)
• Asian Paints
• Berger Paints
Cummins
Best of luck. Comments if you have any doubts. God bless you all, be happy!
Faraaz T
Sr. Equity Research Analyst
Stockholm Securities - UK
Swing & Positional Trading Setup - 85% Win Rate✅ Set up for Positional and Swing Trades (High Beta Liquid Stocks for Cash and Options)-
This trading guide outlines a simple and effective setup for both positional and swing trades, focused on high beta, highly liquid stocks. Follow the rules strictly for better consistency and profitability.
🔹 Positional Trade Setup
• Open the Monthly Chart of the stock.
• Add the RSI (Relative Strength Index) indicator.
• Uncheck all levels (30, 50, 70) and only keep one level at 60.
• Edit the level from 70 to 60 and highlight it in green.
Entry Criteria:
• Stock must cross the 60 RSI level on the monthly chart.
• Entry is only triggered if the price breaks the previous month's high and 60 levels are broken in RSI.
Stop Loss:
• Place the initial stop loss below the previous month's low.
Trailing Stop Loss:
• Trail the stop loss to the current month’s low, but only after the monthly candle closes.
• Continue trailing the stop loss every month using this method until exit.
Exit Rule:
• Exit the positional trade only if the current month’s candle closes below the previous month’s low OR Exit also if the BigWick is formed below previous month low.
⚡ Note: The RSI 60+ setup is a powerful momentum strategy with high reward probability.
🔹 Swing Trade Setup
• Monthly RSI must cross above the 60 level.
• Switch to the Daily Chart of the stock.
• Identify the current swing high on the daily chart.
• Entry is triggered only when the stock breaks the swing high.
• Place the stop loss below the previous week low at first.
Trailing Stop Loss:
• If the trade moves in your favor, trail the stop loss to cost from week low.
Exit Rule:
• Exit the swing trade only if RSI crosses below 60 with a daily candle close.
📌 High Liquid Stocks List
(Suitable for both Cash and Options Segment)
🚗 Auto
• Bajaj Auto
• Bosch Ltd
• Eicher Motors
• Hero Motocorp
• Maruti Suzuki
• TVS Motors
• Tata Motors
🏦 Banking & Financial Services
• Bank of Baroda
• Kotak Bank
• Axis Bank
• ICICI Bank
• HDFC Bank
• IndusInd Bank
• Bajaj FinServ
• Bajaj Finance
• SBI
🧪 Chemicals
• Aarti Industries
• Atul Ltd
• Navin Fluorine
• UPL
• Tata Chemicals
🍫 FMCG
• Britannia
• Godrej Consumer
• Tata Consumer
• DMart
• Hindustan Unilever
• Dabur
💊 Pharma & Healthcare
• Apollo Hospitals
• Alkem
• Biocon
• Divis Labs
• Dr. Reddy’s
• IPCA Labs
• Laurus Labs
• Lupin
• Aurobindo Pharma
• Sun Pharma
• Cipla
💻 IT Sector
• HCL Technologies
• Infosys
• LTIM
• TCS
• Tech Mahindra
• Wipro
⛓️ Steel & Metals
• APL Apollo
• JSW Steel
• Jindal Steel
• Tata Steel
• Hindalco
• L&T
🛢️ Oil & Gas
• Reliance Industries
• Gujarat Gas
• IGL
• MGL
• Tata Power
🏢 Realty
• DLF
• Godrej Properties
• Lodha
• Oberoi Realty
• Phoenix Mills
🛋️ Durables & Others
• Sona BLW (Sonacoms)
• Amber Enterprises
• Bata India
• Crompton
• Dixon Technologies
• Titan
• ACC Cement
• Ambuja Cement
• Ultratech Cement
• Voltas
• Polycab
• Mazdock
• Asian Paints
• Berger Paints
📝 Conclusion
This is the final and simplified setup designed for traders looking for clarity and consistency in trading. No complicated indicators or confusing rules—just clean chart action with momentum logic. Please don't trade Intraday and Index options - its a TRAP. Index and Options are hedging tools used by Sharks to secure their capital. Don't use as a tradable script. You will loose 100%. Focus on what you can achieve with their footprints.
Faraz T
Sr. Equity Research Analyst (Ind, US, UK)

Bullish on INFYYes, Nifty IT has presented a good swing long opportunity on INFY.
Never mind the crash today, the set up looks too promising to not take.
I'm Bullish on INFY with a Target of 1655 for this month series.
Notice how the stock gapped down today and there was immediate buying in the first one hour. This shows Bullish sentiment and this buying has come from a strong Daily price support zone.
P.S. Not a recommendation. Pls do your own due diligence.

No Need To Worry Today Gap Down Is Fixed Bcz Price Is Attract By Vwap
No Downside Left At This Stage in Infosys

Can it be a mini Ending Diagonal in INFY in Wave 1?INFY seems to be completing an Ending Diagonal in Wave 5. We may see a downside ABC correction and then Wave 3, probably.
**This analysis is based on the Elliott Wave Principle.
This analysis is for educational purposes only and not investment advice.
Please consult your SEBI-registered advisor before making any investment decisions. Markets are subject to risk.**
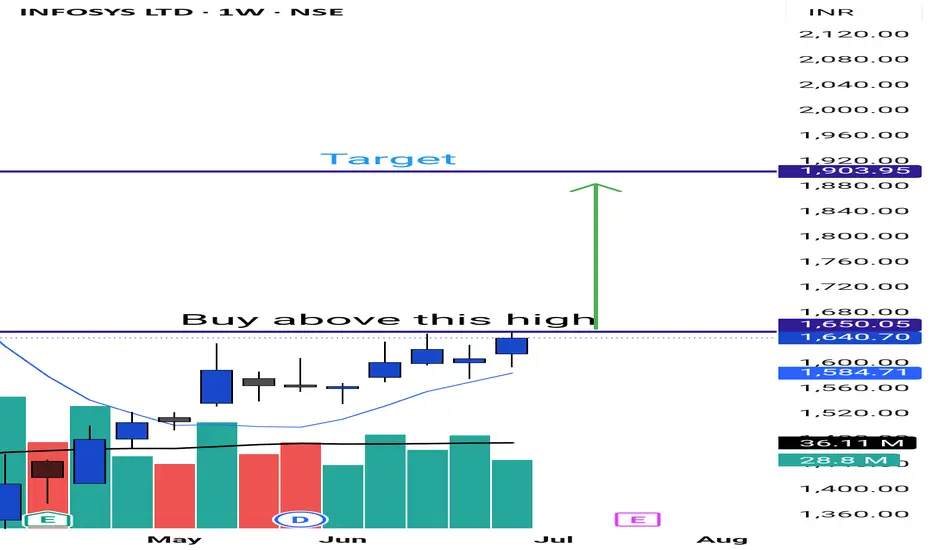
Swing Trading - Stock Option Buy : InfosysStock - Infosys
Buy - Above Marked (Blue Line)
Target - Marked in Red
Can go in Cash, Options or Futures segment.
SL - Swing low or 9 Sma low of Daily chart
Infosys Ready For 30% Potential UpsideFrom 2000 to 2020
Over period of 20 Years ( Observe The Marked Circles)
Infosys on Monthly TF has Bounced And Rallied Sharply Everytime it has Touched 88 ~ 100 MEMA after Crossing the 20-50 MEMA and has traded in a Parallel Channel which provides a Stable And Solid Structure to Match the Fundamental Growth of the Stock.
Ever Since The Mega Breakout of 2020 after crossing 1.618 Fib Extension of the Rally that began in 2000
We have Upgraded the Channel
We are Near the Trendline and have been consolidating for about 8 Weeks without any signs of Bearishness.
This Prolonged consolidation followed by Trendline break and Historical Higher Monthly TF Support makes good case for Potential Upside of about 30% from CMP 1618 which will gain momentum above 1720.
Targeting 2000~2100 which happens to coincide with Upper End of the Parallel Channel
Look for the Inv Head and Shoulder in Formation in Short term for Swing Trade
Hereby Sharing a Short term Potential Trade with Longer Term Perspective in The Description above.
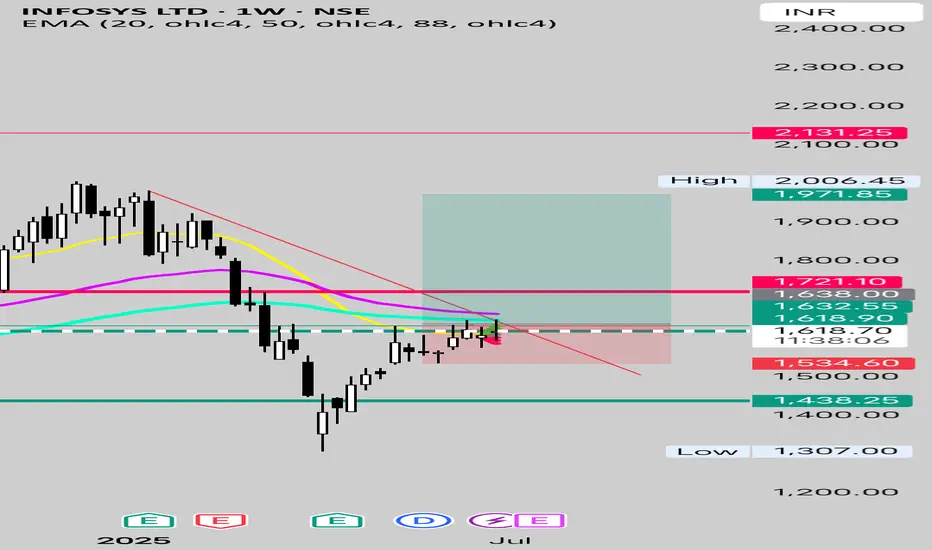
Buy Above 1638
SL below 1530
TP 1950~ 2000
R:R = 3
Infy Price actionInfosys (INFY) is currently trading around ₹1,608, with recent fluctuations between ₹1,606 and ₹1,629. Over the past year, the stock has delivered modest gains, slightly underperforming broader market indices and the IT sector. Financially, Infosys remains robust, maintaining strong revenues, healthy profit margins, and a debt-free balance sheet. The company continues to reward shareholders with consistent dividends, including a recent payout of ₹22 per share.
Looking ahead, growth expectations for Infosys are muted. The company has projected revenue growth of just 0–3% for the upcoming fiscal year, citing macroeconomic uncertainties and cautious client spending in its key markets. This represents one of the lowest growth forecasts for Infosys in over a decade and reflects broader industry headwinds, including delayed client decision-making and a focus on cost optimization.
Analyst sentiment is generally positive but cautious, with most maintaining a buy or hold rating. Price forecasts for the next year range from ₹1,667 to ₹1,945, indicating limited upside from current levels. Technical analysis shows immediate support near ₹1,579 and resistance around ₹1,633, suggesting the stock is likely to remain range-bound in the near term.
In summary, Infosys is financially sound and offers stable dividends, but near-term growth is expected to be subdued due to global economic challenges and restrained client budgets. The stock is more attractive for investors seeking stability and income rather than aggressive capital appreciation at this stage.
INFY | DOWNTRENDInfosys seems to have completed Wave B on a larger timeframe
and we have now entered Wave C to the downside.
Recommended to stay away from this stock for long term investment

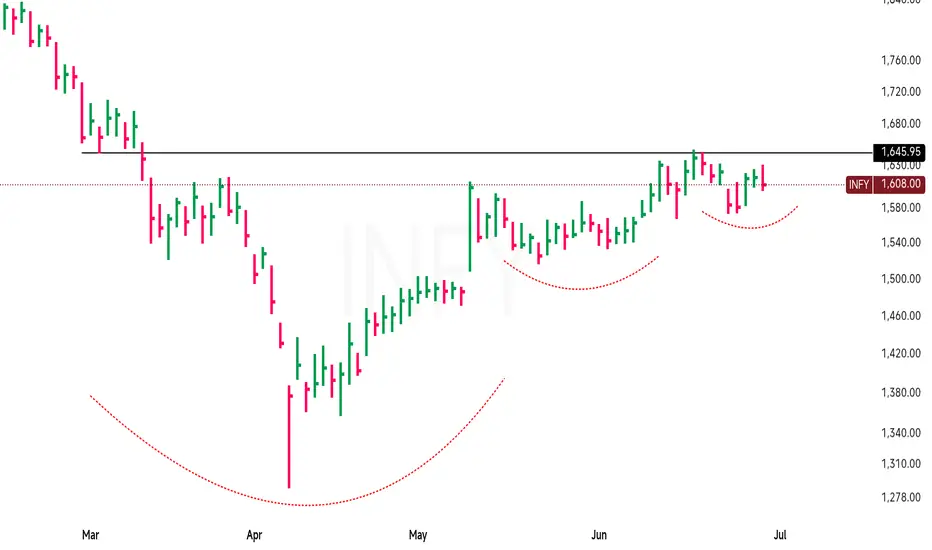
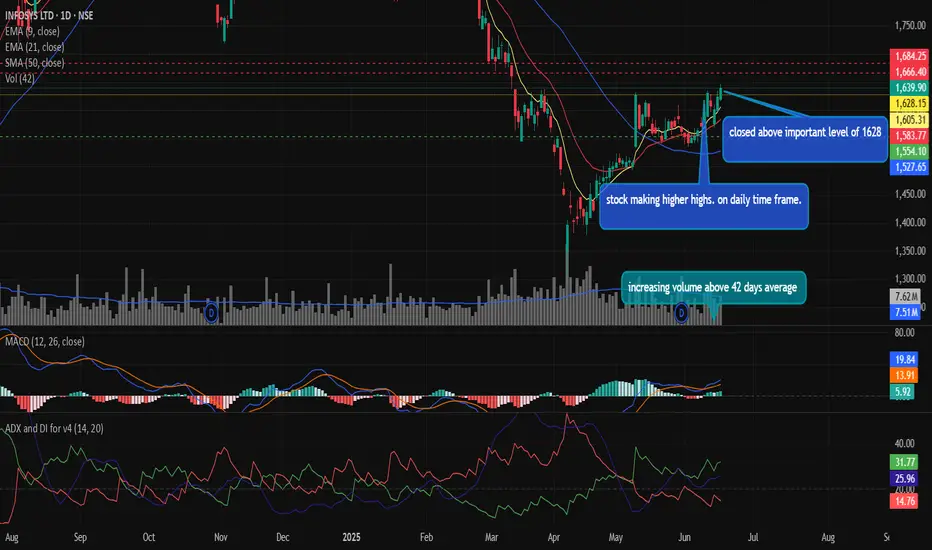
INFOSYS LTD Making higher high trend on daily time frame.Indian IT Sector is witnessing a recovery as most of the IT stocks closed on a postive note. Infosys Ltd being one of the secotral leader is seen making higher highs and higher lows trend on daily time frame as the with above average volume of 42 days (approx 2 Months).
The stock has closed above an important level of 1628 which acted as a hurdle. Now the stocks has suatianed above 1628 level a next resistance level of 1666.40 and 1684.25 seems to be achivabele.
MACD Indicator is alredy trading above zero line which signals postive momentum and alog with it ADX indicator is at 25.95 where +DI is trading above -DI which indicates strenghth in momentum.
let me know your thought in comment below.
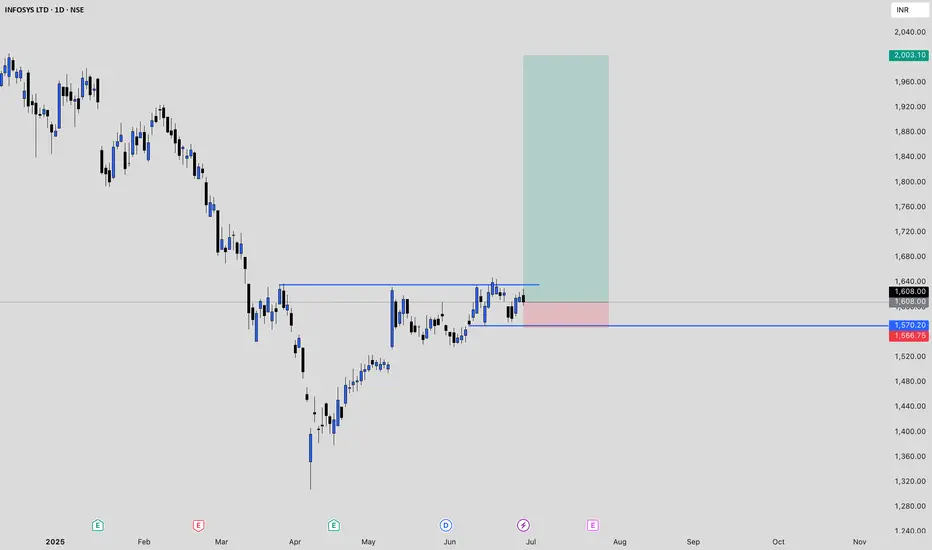
INFOSYSOn the daily candle chart there is breakout going to happen in Infosys. If it breaks above 1640-1650 range and closes above it, one can go for long side trade with stop loss below 1570 for the target of 1800
