Global Sanction Rules1. What Are Sanctions? — Definition and Scope
International sanctions are punitive measures imposed by one state, a group of states, or an international organization against a target state, group, organization, or individuals to influence their behaviour without using military force. They can inclu
NVIDIA Corporation Shs Cert Deposito Arg Repr 0.04166667 Sh
No trades
200 ARS
68.09 T ARS
121.92 T ARS
About NVIDIA Corporation
Sector
Industry
CEO
Jen Hsun Huang
Website
Headquarters
Santa Clara
Founded
1993
IPO date
Jan 22, 1999
Identifiers
2
ISIN ARBCOM460184
NVIDIA Corp engages in the design and manufacture of computer graphics processors, chipsets, and related multimedia software. It operates through the following segments: Graphics Processing Unit (GPU), Tegra Processor, and All Other. The GPU segment comprises of product brands, which aims specialized markets including GeForce for gamers; Quadro for designers; Tesla and DGX for AI data scientists and big data researchers; and GRID for cloud-based visual computing users. The Tegra Processor segment integrates an entire computer onto a single chip, and incorporates GPUs and multi-core CPUs to drive supercomputing for autonomous robots, drones, and cars, as well as for consoles and mobile gaming and entertainment devices. The All Other segment refers to the stock-based compensation expense, corporate infrastructure and support costs, acquisition-related costs, legal settlement costs, and other non-recurring charges. The company was founded by Jen Hsun Huang, Chris A. Malachowsky, and Curtis R. Priem in January 1993 and is headquartered in Santa Clara, CA.
Related stocks

Heikin Ashi Trend Continuation & Weakness Framework📈 Heikin Ashi Trend Continuation & Weakness Framework
This chart demonstrates how Heikin Ashi candles simplify trend analysis by filtering out market noise and emphasizing directional strength, momentum, and trend exhaustion.
Unlike standard candlesticks, Heikin Ashi focuses on average price behavi

Bearish Engulfing on Monthly Chart — Fibonacci Targets in SightThe monthly chart is showing a bearish engulfing pattern, which suggests potential profit booking in the coming sessions. This reversal signal indicates that sellers may take control after a strong bullish phase.
Using Fibonacci retracement levels for downside targets:
First target: 0.50 level — a

NVIDIA: Double Bottom Flat at Support — Bounce Setup in PlayNVIDIA is currently testing a well-defined support zone near the prior lows, where price action is starting to compress rather than accelerate lower. The structure forming at this level resembles a double-bottom flat , suggesting that selling pressure is gradually losing momentum.
From an Elliott

Derivatives Trading SecretsMastering Leverage, Risk, and Market Psychology
Derivatives trading is often seen as a complex and high-risk area of financial markets, reserved only for professionals. However, when understood correctly, derivatives can become powerful tools for profit generation, risk management, and strategic po

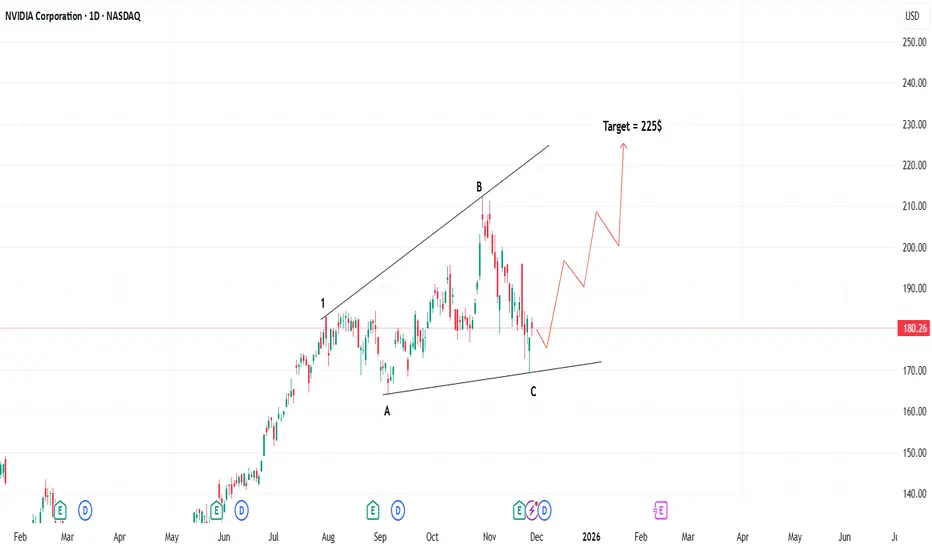
NVIDIA Bullish setupNvidia enter's into buy zone for an target of $225.
As per Wave analysis, Correction in daily time frame completed, now it's ready for an impulse with an target of $225
NVIDIA Turn consolidation phase In Weekly Time frame“Chip maker? More like dip maker today.”
#NVIDIA
Trend / Momentum
The stock is in a consolidation phase and range-bound lately, not in a strong runaway uptrend. However, RSI is around neutral (~52), indicating neither overbought nor oversold conditions.
Support & Resistance Levels
Support: Key
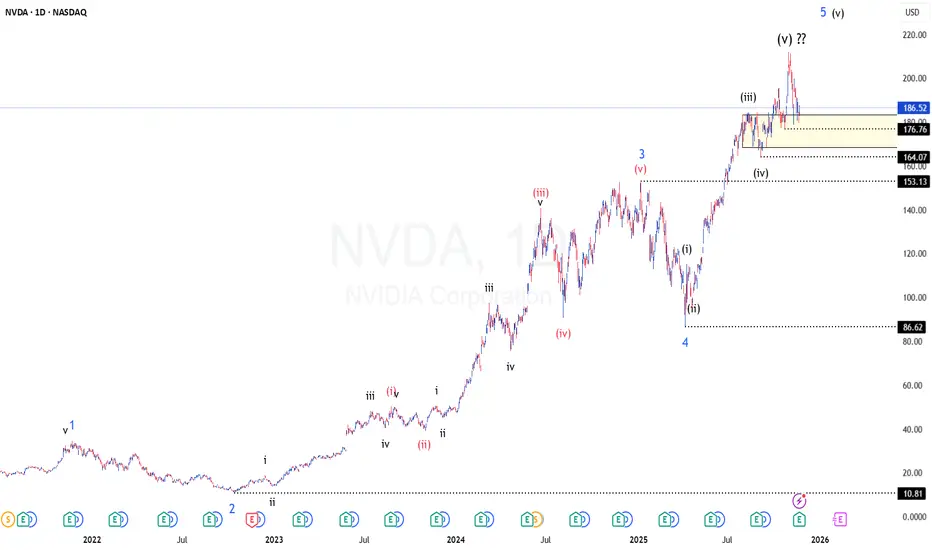
NVDA - End of Trend or one more high is due?TF: Daily
CMP: 186.52
The EW counts suggests that we are at the end of the trend on this counter.
The 4th wave ended at 86.62 on April 2025 and the price moved past 200 since then (3x move in about 7-8 months).
To me, looks like the upmove has ended, but no confirmation yet. So long as the price
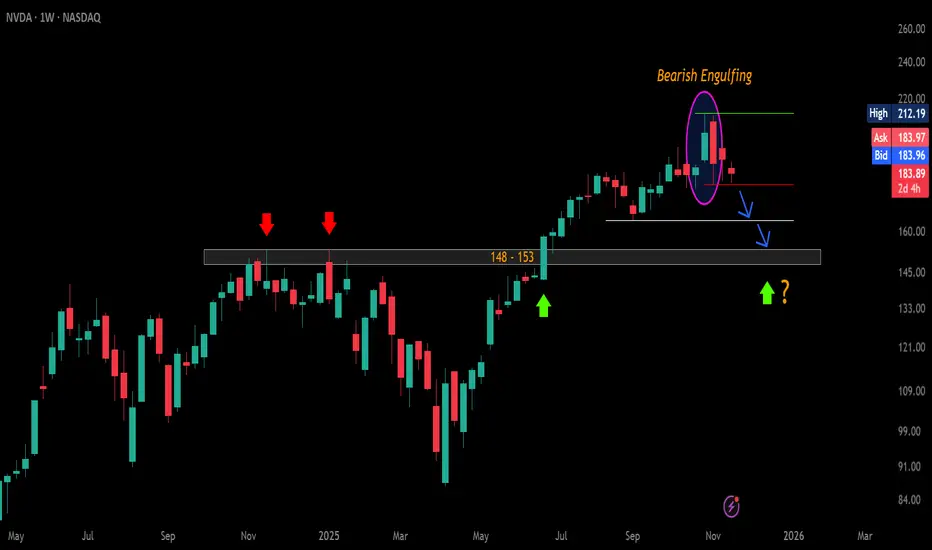
$NVDA – Weekly Bearish Signal Triggering?CMP: $184
NVDA has formed a Bearish Engulfing on the weekly chart and is currently trading inside the engulfed candle.
A WCB / sustained break below $178.91 will confirm the pattern → likely dragging price toward $164 and the major $153–$148 breakout-retest zone . 🔻
A WCB above the ATH $
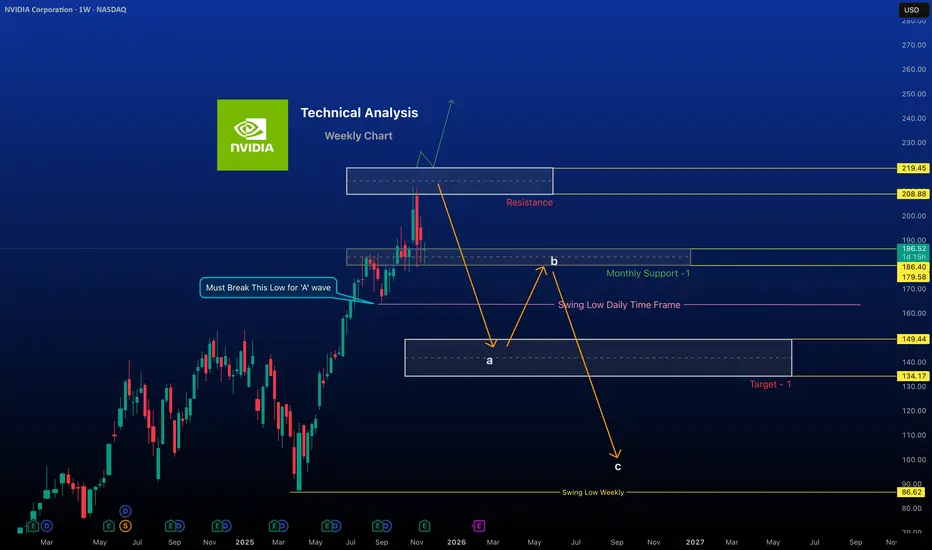
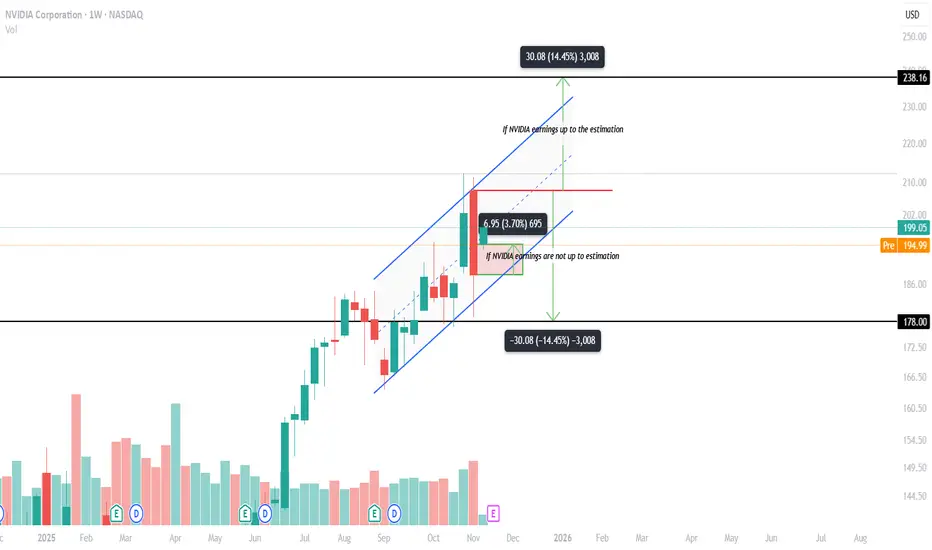
NVIDIA Technical analysis chartAs we know, I already publish the weekly chart technical analysis so here the analysis chart of weekly basis
See all ideas
Summarizing what the indicators are suggesting.
Oscillators
Neutral
SellBuy
Strong sellStrong buy
Strong sellSellNeutralBuyStrong buy
Oscillators
Neutral
SellBuy
Strong sellStrong buy
Strong sellSellNeutralBuyStrong buy
Summary
Neutral
SellBuy
Strong sellStrong buy
Strong sellSellNeutralBuyStrong buy
Summary
Neutral
SellBuy
Strong sellStrong buy
Strong sellSellNeutralBuyStrong buy
Summary
Neutral
SellBuy
Strong sellStrong buy
Strong sellSellNeutralBuyStrong buy
Moving Averages
Neutral
SellBuy
Strong sellStrong buy
Strong sellSellNeutralBuyStrong buy
Moving Averages
Neutral
SellBuy
Strong sellStrong buy
Strong sellSellNeutralBuyStrong buy
Displays a symbol's price movements over previous years to identify recurring trends.
NVDA4971919
NVIDIA Corporation 3.7% 01-APR-2060Yield to maturity
5.49%
Maturity date
Apr 1, 2060
NVDA4971918
NVIDIA Corporation 3.5% 01-APR-2050Yield to maturity
5.45%
Maturity date
Apr 1, 2050
NVDA4971917
NVIDIA Corporation 3.5% 01-APR-2040Yield to maturity
5.09%
Maturity date
Apr 1, 2040
NVDA4971916
NVIDIA Corporation 2.85% 01-APR-2030Yield to maturity
4.12%
Maturity date
Apr 1, 2030
NVDA5203205
NVIDIA Corporation 2.0% 15-JUN-2031Yield to maturity
4.10%
Maturity date
Jun 15, 2031
US67066GAE4
NVIDIA Corporation 3.2% 16-SEP-2026Yield to maturity
3.88%
Maturity date
Sep 16, 2026
NVDA5203204
NVIDIA Corporation 1.55% 15-JUN-2028Yield to maturity
3.67%
Maturity date
Jun 15, 2028
See all NVDA bonds