PLTR US🌎Palantir: Rocket Growth vs. Sky-High Valuation. Which Will Outweigh the Other?
The quarterly results are very strong, but investors face significant risks. Let's break it down.
🚀 Strengths:
Explosive revenue: $1.18 billion (+63% YoY), EPS: $0.21. Both metrics beat expectations.
Brighter-than-expected future: Q4 guidance ($1.33 billion) and 2025 guidance (~$4.4 billion) are significantly higher than consensus.
Commercial: 121% YoY growth in the US. This is the company's main driver.
Sales are strong: Closed contracts worth $2.8 billion. The client base grew to 911 companies (+45%).
Super-efficient: Revenue +63%, while headcount is only up 10%. An operating margin of 51% is fantastic.
AI is the fuel: Products like AIP are accelerating adoption, and customers are switching en masse to the Palantir platform.
⚠️ What's scary: Risks and "buts"
The price is sky-high: A P/S ratio of 110+ is nonsense, even for a growing company. Market cap is growing faster than revenue.
The model predicts a collapse: Under optimistic scenarios (40% annual growth), the fair price could be tens of percent lower than the current one.
Share dilution: Share-based compensation (SBC) eats up 24% of revenue—a huge amount. Insiders are actively selling.
Shorted a billion: The legendary Michael Burry bought put options on 5 million shares, betting against PLTR. He believes the AI sector is inflating.
Vulnerability: Business is concentrated in the US, creating regulatory and macro risks. Europe is experiencing stagnation.
Trade ideas
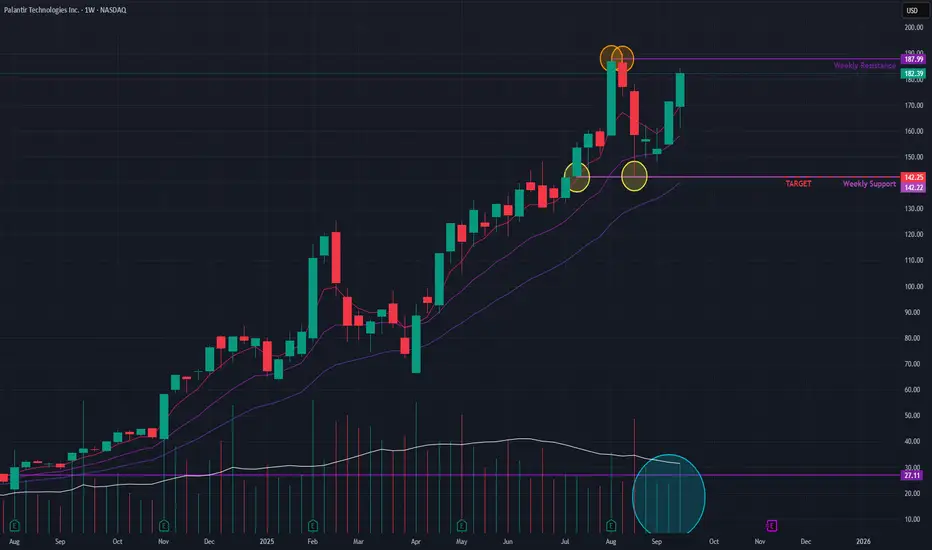
Palantir (Weekly) - Consolidation Near All-Time HighAfter reaching a new All-Time High (ATH) in recent weeks, Palantir has entered a period of consolidation. The stock has since been trading in a sideways range, struggling to break past the newly established resistance level.
Emerging Bullish Signals 👍
Despite the sideways movement, several indicators suggest that buyers are showing renewed interest:
- Momentum: Short-term Exponential Moving Averages (EMAs) have formed a positive crossover , a technical signal indicating that upward momentum is building.
- Volume: Trading volume has been noticeably increasing , which suggests growing accumulation and buyer interest at the current price levels.
Future Outlook and Key Price Levels
The stock is currently positioned for a potential move, with two clear scenarios:
- Bullish Case 📈: A decisive breakout above the short-term horizontal resistance would signal a continuation of the uptrend. If this occurs, the next potential price target could be USD 234 .
- Bearish Case 📉: If the stock fails to overcome the resistance and momentum fades, it may decline to the lower boundary of its consolidation range, with a potential support level near USD 142 .
Watchout for the next moves !!
$PLTRDaily gap filled with another HR gap below.
Resistance level above and more than likely exit there.

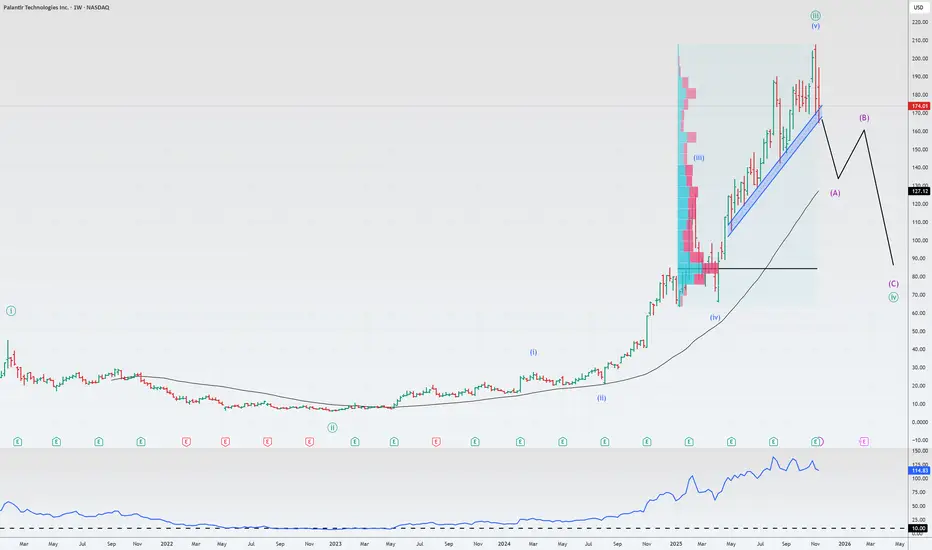
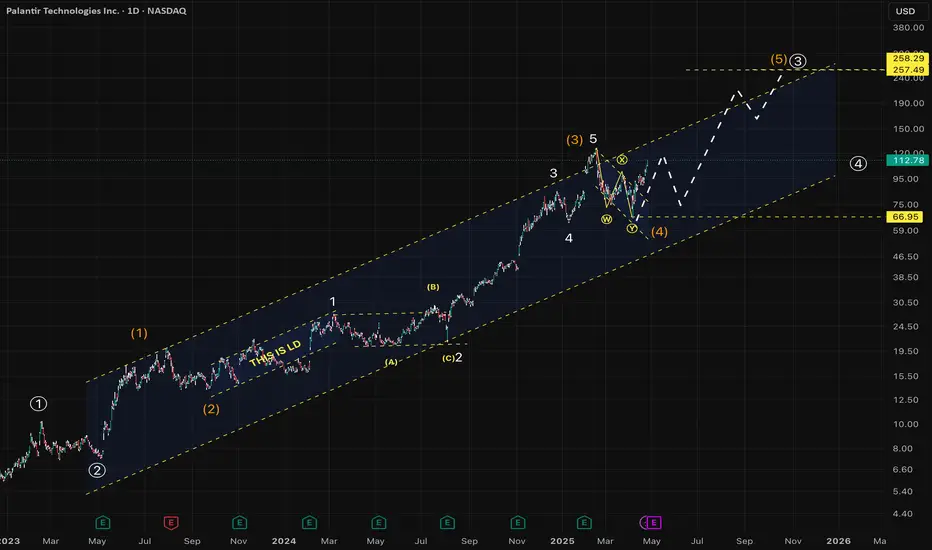
Can PLTR reach 250 in ~1.5Yrs ?PLTR seems to have completed complex correction and moving in a impulse structure towards a larger goal of 250 in 1 to 1.5yrs to complete its larger degree Wave-3.
Invalidation level:
Daily close below ~66.95 and below...
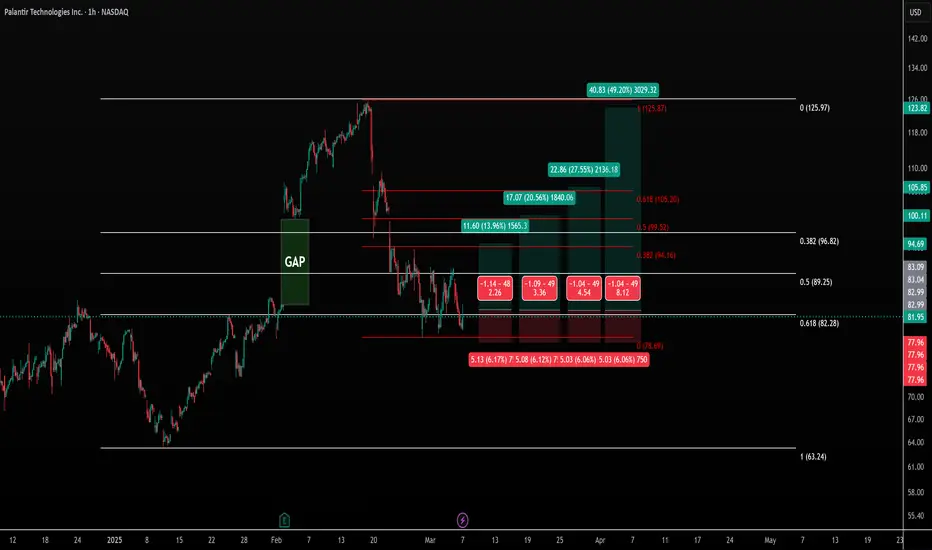
PLTR Long Idea: Key Retest – Bullish Continuation in Sight? Palantir (PLTR) has successfully closed the gap between $100 and $84 and is now retesting multiple key technical levels that could define the next move.
Technical Setup:
Previous All-Time High (ATH) & Resistance: The stock is currently retesting the $84.79 level, which previously acted as resistance.
Fibonacci Retracement (0.618 Level): This key level aligns with historical price action, adding confluence for a potential bounce.
Bullish Scenario: If PLTR confirms this level as support, we could see an impulse wave forming towards the next key levels.
Upside Targets:
Fibonacci Extensions:
0.382 Fib: Intermediate resistance
0.5 Fib: Mid-level retracement
0.618 Fib & Previous ATH ($123): Strong resistance area
A successful hold above $84.79 could trigger the next leg up, making these fib levels potential price targets.
Risk-Reward Perspective:
This setup presents an asymmetric risk-reward opportunity, favoring upside continuation if confirmation holds. Given the technical confluence, this is a trade setup I would take 9 times out of 10.
Conclusion:
A clean retest and hold of the $84.79 level could fuel bullish momentum, paving the way for higher price targets. Watching for a breakout confirmation before entering.
Palantir (PLTR) Technical Analysis – Bullish Trend Continuing?The weekly chart of Palantir Technologies (PLTR) reflects a strong bullish momentum, with price action consistently making higher highs and higher lows. Below is a detailed analysis of the technical indicators and projections:
Fibonacci retracements and extensions are plotted to identify potential upside targets. The price has surpassed the key level of 1.414, and higher targets at 4.236, 5.618, and beyond are being tested. These levels serve as speculative zones for future resistance.
The 20 Week MA is showing strong upward momentum, confirming a bullish trend. The 50 Week MA and 200 Week MA are far below the current price, indicating sustained momentum over the past months.
A sharp rise in volume during recent rallies suggests strong buying interest, further supporting the bullish outlook.
After a parabolic move in recent weeks, the price is consolidating above key Fibonacci levels, indicating potential continuation of the rally.
Risks to Consider
While the bullish trend is strong, traders should remain cautious of potential corrections or pullbacks, especially after such a sharp upward move.
Disclaimer:
I am holding Palantir (PLTR) stock for approximately one year. This analysis is based on personal observations and is not a recommendation to buy or sell. Please conduct your due diligence and consider consulting a financial advisor before making any trading decisions.

PLTR: The Best Stock of 2024 Could Face ChallengesPLTR demonstrated exceptional strength in 2024, becoming the best-performing stock in the S&P 500 with an impressive 346% gain since the beginning of the year. However, as we move into December, I notice signs that could indicate a potential correction.
The reasoning behind my outlook lies not in the bearish divergence pattern, which is secondary, but in the interaction between price and volume. Let’s examine the price and volume action on December 20. The volumes were extraordinarily high—imagine this as the level of effort—but what was the outcome of that effort?
The price reached a new high, which sounds great, but it didn’t hold there. Moreover, the breakout was minimal, more like a bull trap inviting buyers to go long on the breakout of the December 9 high.
The price quickly returned close to the opening level of the December 20 candle—the starting point of the pump. If these were genuine efforts from strong buyers, the result would have been significantly different.
Strong markets don’t behave this way. That’s why I anticipate that PLTR may enter a correction, potentially forming a descending red channel. The lower blue line represents the likely target and strong support.
