WMT Weekly trendlineOver the past two years, Walmart’s stock has shown a solid upward trajectory. From late 2023 through the end of 2025, WMT delivered double-digit returns, reflecting strengthening investor confidence and improved fundamentals. The stock recovered from the lows of 2024 — when it traded around the low-to-mid $80 range — to hit new highs of about $111–$114 per share in late 2025.
This rise corresponds with a favorable performance environment, supported by robust earnings, steady demand for essentials, and Walmart’s strategic investments in e-commerce and supply-chain efficiencies.
Trade ideas

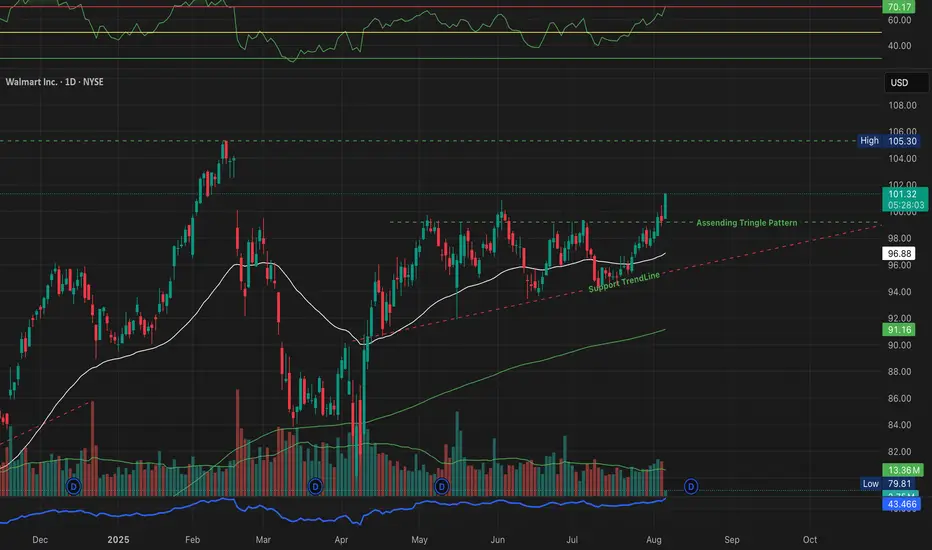
Has Walmart’s Ascending Triangle Breakout Been Confirmed?Walmart Inc. (Ticker: WMT), listed on the U.S. stock exchange (NYSE), appears to have formed a classic Ascending Triangle Pattern on the daily chart. As of August 6, 2025, the price has broken above the horizontal resistance near $100.60, closing at $101.16 with decent volume and strong bullish candles.
📈 Resistance zone: ~$100.60
📉 Support trendline: Rising since early May 2025
🔼 Breakout Level: ~$100.60 (now turned support)
📊 Volume: Breakout supported by above-average volume
💹 RSI: Currently near overbought zone (69.69), which indicates strength but also requires caution
If the price sustains above this level in the coming sessions, it could be a sign of continuation toward the next target zone of $105–106, as marked on the chart.
📊 Quick Fundamental Snapshot (2025):
Market Cap ~$400B
Revenue (TTM) ~$650B+
Net Income (TTM) ~$15B
EPS (TTM) ~$5.60
P/E Ratio ~18x
Dividend Yield ~1.5%
ROE ~18%
Walmart remains one of the strongest players in retail globally, with its recent focus on e-commerce, warehouse automation, and supply chain optimization boosting investor sentiment.
ANALYSIS BY MAYUR JAYANT TAKALIKAR -- FOR LEARNING & OBSERVATIONAL USE ONLY.
⚠️ Disclaimer
I am not a SEBI-registered advisor. This analysis is for educational and informational purposes only. Please do your own research or consult with a certified financial advisor before making any investment decisions.
WMTIn last 10 yr WMT has given handsome bull run. Recent profit booking may be start of profit booking which everyone may be looking.
80 is imp level to decide

Walmart Slow & Strong MovementThis year till date walmart is up in the 50% this movement is slow but the strong and simple trend, But Don"t worry this is not the first or not the last...

Wall Mart This Char Is Looking Beautiful The Wallmart Chart is showing in the Stready chart patter this chart is simple show Slow steady return.
This is fundamental good company, with Cashflow


Walmart Inc. - readying for a leapWalmart Inc. - Seems readying for a leap. Levels mentioned on the chart and as below:
Entry @ CMP 127
SL @ 120
Target @ 144

WALMARTBook profits or reduce position or exit long
some time back it was oversold which was the opportunity on back of negative news.
Now on the rise till new peak is not made book profits as it move near peak.
Expect near term correction or sideways volatility

WMT SHORTAfter a lot of time of DISDOS /
we want to see brake and close lower then 134
if the market prove to us that he want to go down .
we love this short
Target OMEK DISDOS /

$WMT Daily Target price 127 by 11/27. After potential next year around 216.
What is 216?
What is expansion and contraction of the universe?


WMT: Bullish Continue to see uptrend through Feb 18th earnings. Pullback after + earnings report (we have seen a pullback the past 4 earnings). Recovery back to trendline following wave 4 low.

BULLISH WALLMARTCUP & HANDLE FORMATION
TAKE LONG POSITION NEAR 116-115 $ ZONE
ANY BREAKOUT WILL LEAD THE STOCK PRICES TO ACHIEVE A TARGET ZONE OF 127$-128$ .
STOL LOSS SHOULD BE 112$


