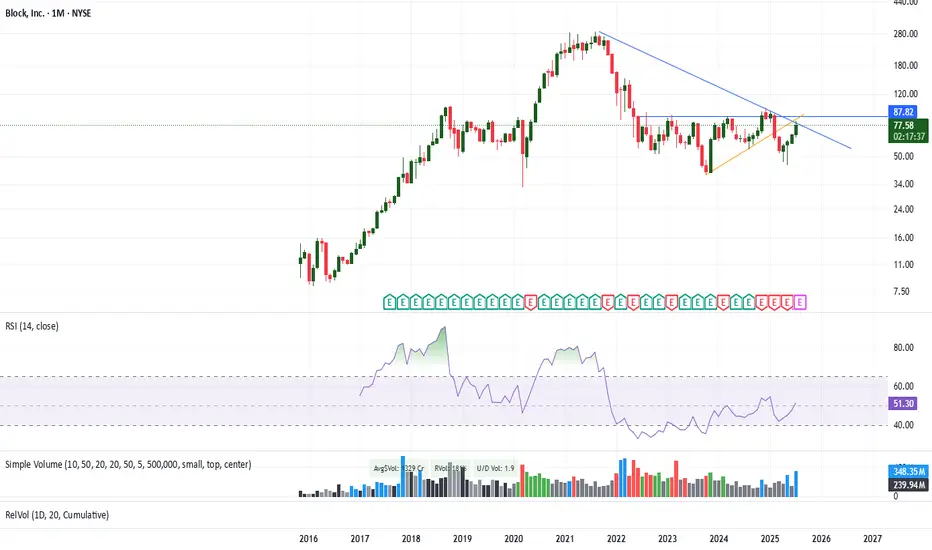
XYZ: Multiple resistance points being tested v/s High VolumeMonthly chart of XYZ shows multiple resistance points (including 200 week) are being tested, however significant volumes on 21st and 22nd July + 10week EMA crossing above 20 Week EMA, along side results day c.6th Aug make this an interesting intersection of resistance lines... am holding since the hammer created around bounce back zone.. will watch it over the next few days before exit.