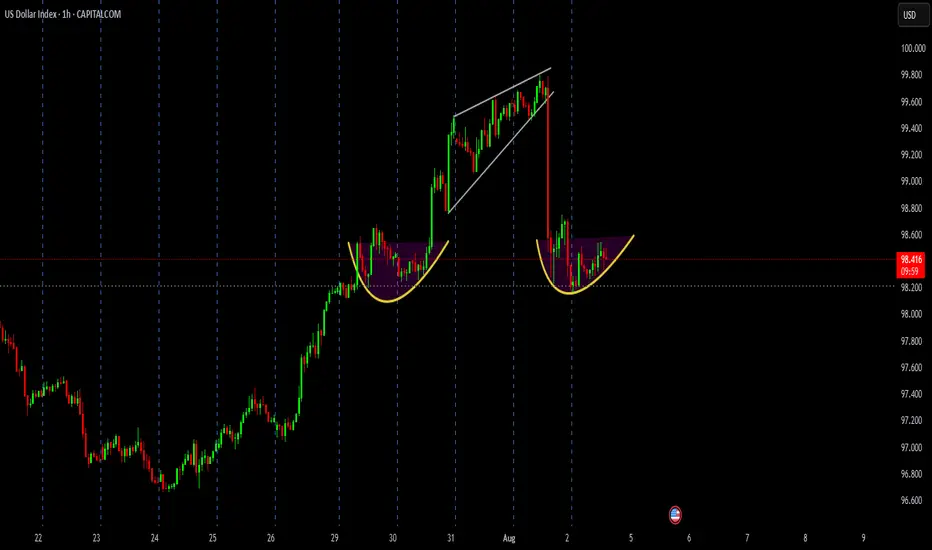
US Dollar Index (DXY) Analysis – 1H Chart📌 Chart Patterns in Focus:
1️⃣ Cup & Handle Formation (29–31 July):
Bullish reversal pattern spotted
Price broke out sharply upwards after the handle consolidation
2️⃣ Rising Wedge Breakdown (31 July – 1 Aug):
Bearish pattern triggered heavy selling
Sharp red candle confirms strong bearish pressure
3️⃣ New Cup Base Forming (2 Aug – Present):
Price consolidating after drop
Another Cup & Handle formation in progress
Break above neckline near 98.60 could trigger next bullish wave
💡 What to Watch Next:
Breakout above 98.60 = Possible upside continuation
Failure to breakout = Range-bound or bearish retest of 98.00
📍Current Price: 98.425
⏱️ Timeframe: 1 Hour
📈 Bias: Cautiously Bullish (if neckline breaks)
📉 Risk: Another rejection may lead to 97.80 zone retest
🔔 Stay tuned for breakout confirmation before positioning!
#DXY #USDIndex #TechnicalAnalysis #ChartPatterns #ForexTrading #PriceAction #CupAndHandle #RisingWedge #SmartTrading
Trade ideas
DXYAs you can see, this is the US Dollar Index (DXY) on the 15-minute chart. Coming down from the higher timeframes, the macro bias on DXY remains bearish. While fundamentals will, of course, play a key role, technically speaking, after a strong move to the upside, it's natural for price to retrace lower—whether as a correction before continuing higher or potentially beginning a deeper move down.
📉 What I'm Watching:
If price reacts from the current zone and starts dropping, this could serve as extra confirmation for potential XXX/USD buys.
If that setup doesn't play out here, I'm still expecting a similar scenario—just slightly higher, possibly from within the daily supply zone.
Either way, I'm remaining patient and letting price show its hand.
Have a great week ahead!
Blessings! 🙏

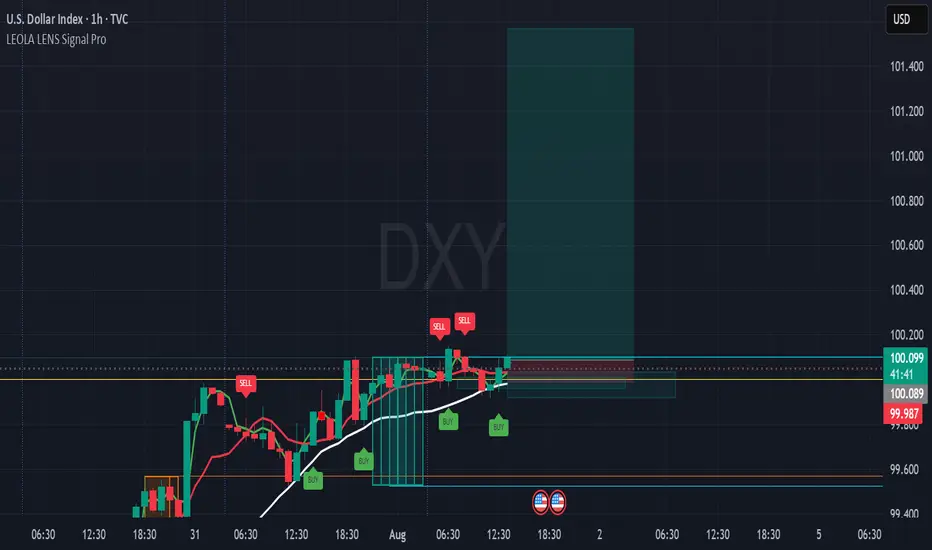
DXY Long Setup Forming After Structure Reclaim-101.567This intraday chart on DXY (U.S. Dollar Index) showcases a structure-aware long setup using Leola Lens SignalPro on the 1H timeframe.
⚙️ Key Technical Highlights:
🟢 Multiple BUY signals appeared near 99.98–100.00 zone after reclaiming short-term structure.
⚪ Price holds above the white adaptive base trendline — suggesting support strength.
🟥 Liquidity Control Box defines a clear invalidation zone under 99.98.
🔁 Prior SELL signals failed to follow through, indicating weakening bearish momentum.
📊 Target projection: 101.567 (based on structural extension and signal alignment).
📌 What to Monitor:
🔎 A decisive candle close above 100.10–100.15 can confirm bullish intent.
🎯 Reward-to-risk favored on clean setups post-breakout, aligning with momentum model.
📉 Invalid if structure re-breaks below base zone with volume.
⚠️ Educational use only. Not financial advice. Structure zones visualize behavior — not prediction.
🔐 Invite-only tool — access details in author bio.
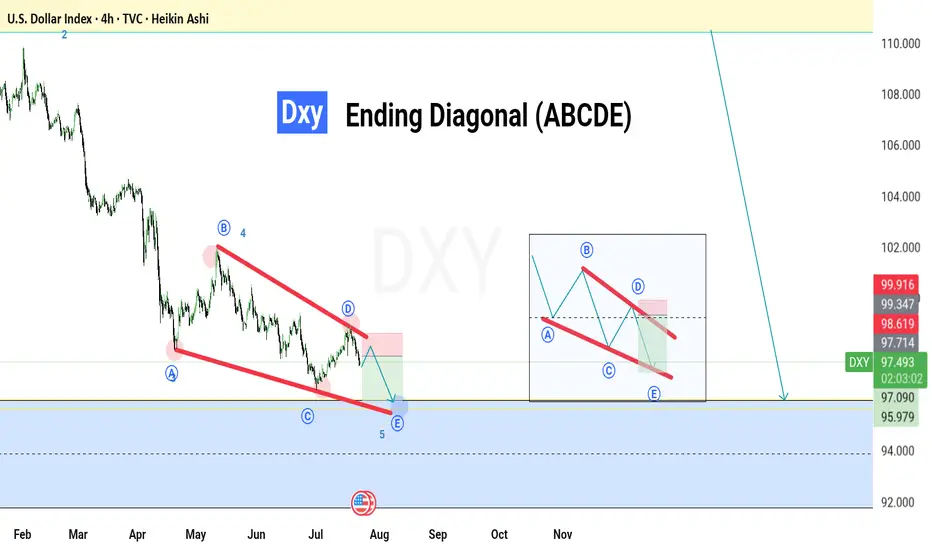
DXY – Elliott Wave Ending Diagonal In Play (4H Chart)
Price is moving within a well-defined falling wedge structure, forming an Ending Diagonal (ABCDE).
🔹 Currently in Wave D → E, expecting final leg down toward the 95.97–97.00 zone.
🔹 Previous resistance at 98.60–99.30 acted as a key rejection area.
🔹 If the wedge holds, we could see a potential bullish reversal from the blue support zone.
Key Outlook:
📍 Short-term bearish pressure
📍 Medium-term reversal expected if Wave E completes
📍 Eyes on confirmation from price action + volume near the wedge base
💡 Trade smart. Respect structure. Wait for confirmation.
🔔 Follow for more real-time wave-based analysis.
#DXY #ElliottWave #TechnicalAnalysis #Forex #PriceAction #TradingView #DollarIndex #WaveTheory
my idea on DXYHEY as of right now dollar is losing strength . so am thinking it is going to drop and create a new low. so this is my view on DXY. if DXY falls then EURUSD and GBPUSD will be good for buys
. will update those pairs in next idea

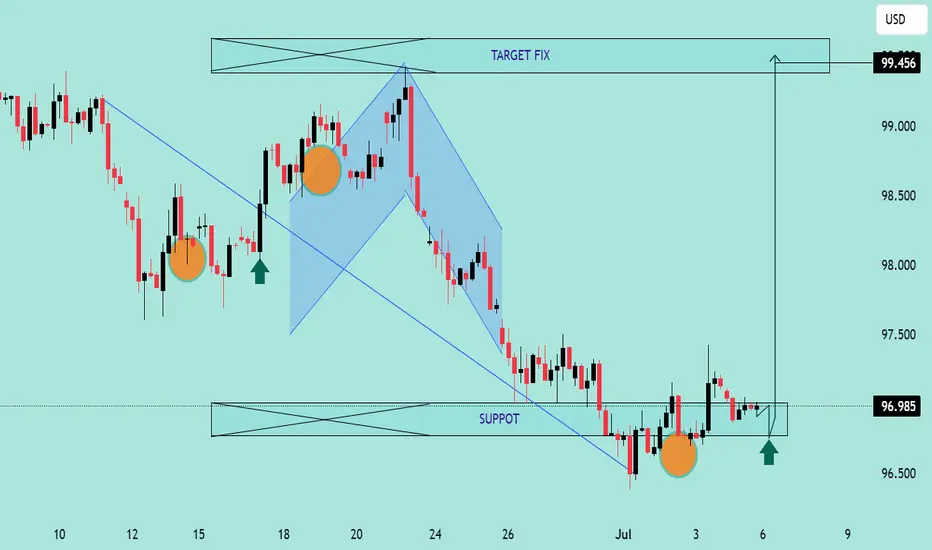
DXY Potential Bullish Reversal – Target 99.456DXY Potential Bullish Reversal – Target 99.456 🎯
Technical Analysis Overview:
🔹 Trend Structure:
The chart illustrates a recent downtrend, which has been broken as price moved above the descending trendline, signaling a potential trend reversal.
🔹 Pattern Insight:
A bullish harmonic pattern is visible (possibly a bullish Bat or Gartley), with the price reacting from the PRZ (Potential Reversal Zone), aligning with key support near 96.500. The market has respected this zone multiple times, evident from the orange highlighted circles showing price rejections.
🔹 Support & Resistance:
Support Zone: ~96.500
Breakout Zone: ~96.985 (current consolidation near this resistance)
Target Zone: Marked at 99.456, which aligns with previous structure and fib projection.
🔹 Market Sentiment:
Price is consolidating after breaking the downtrend, forming a bullish rectangle (accumulation). The green arrows indicate bullish intent from buyers defending support levels.
🔹 Price Action Signal:
Formation of higher lows.
Break of structure and close above previous highs.
Possible breakout pending above consolidation box.
📊 Conclusion:
DXY shows bullish potential as it builds a base around strong support. A confirmed breakout above the rectangle could fuel a rally toward 99.456. Keep an eye on volume and confirmation candles for entry. ✅
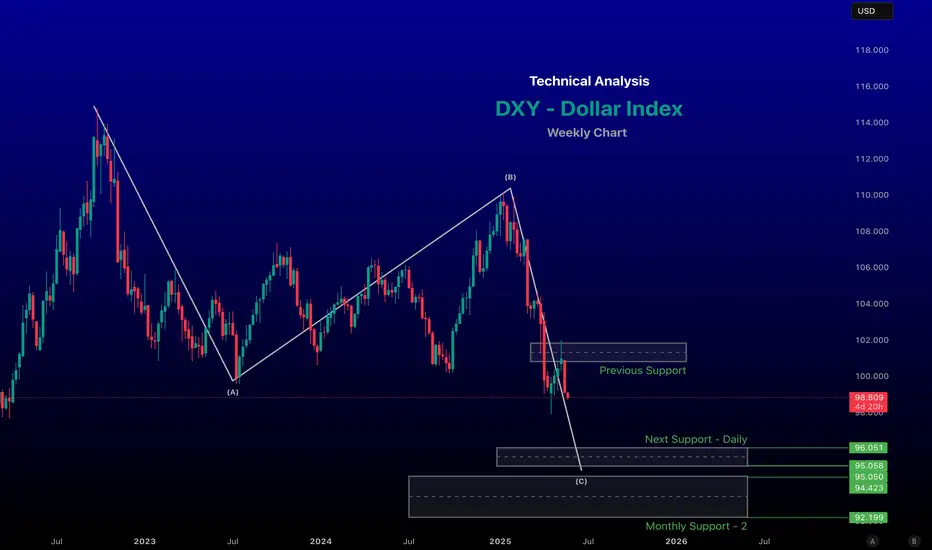
DXY is close to making a bottom - Watch for IT & Metal StocksDXY counts are marked herein. The correction is complete or one more low is due after a pullback.. But the bottom is not far away. The index is due for a pullback.
Time to exit short positions and slowly find long opportunities.
Weekly chart (Channel bottom confluence both on rising and falling channels) is attached
Indian Stocks from IT and Metal space to be tracked in line with this view.
IT index looks good for a decent rally.
Some of the Metal names are at the end of their 3rd wave in smaller TF, so a pullback is due there; be cautious with your LONGS on Metals Space (short term)
Will post individual charts later this week
Disclaimer: I am not a SEBI registered Analyst and this is not a trading advise. Views are personal and for educational purpose only. Please consult your Financial Advisor for any investment decisions. Please consider my views only to get a different perspective (FOR or AGAINST your views). Please don't trade FNO based on my views. If you like my analysis and learnt something from it, please give a BOOST. Feel free to express your thoughts and questions in the comments section.
DXY MONTHLY ANALYSIS 01-JUL-2025 @ 96.75LTP 96.75
Resistances: 99.55/102/110.19
Support: 89.19
As per my analysis, as long as 99.55/102 holds resistance, we can see 95/91.55 first.
Further, we can see 87.64/85.12-83.6-81.55.
More bearish targets would be 80.21/75.77
Is the DXY fading in strength?

DXY QUATERLY CHART SINCE 1970 - TARGET 165 AWAITEDQuaterly chart is attached which can play out over coming years. Target 165 +
Regards
THE KING TRADER

DXY headed to 165+ in coming years- Buckle upI have shared a chart earlier of DXY Monthly where DXY is going to 135+ in coming months. This is quaterly chart, which says that DXY will reach 165+ in coming years.
Thats what chart says I know there is talk about Dllar Crash and what not.
But I see only charts.
Regards
THE KING TRADER

DXY headed to 135+ in coming months - Fasten the seat belts.We are in a Diagonal in making and currently in wave 5. In that we are currently in subwave 2 and 3rd wave is going to start within couple of months which will take it to 135+. DXY at such level can wreck havoc for Equity and Metals like GOLD, SILVER.
I dont give a shit what propoganda of Dollar Index is, what chart says I am presenting in front of you.
Be careful and is this pattern plays out fasten your seat belts.
Regards
THE KING TRADER

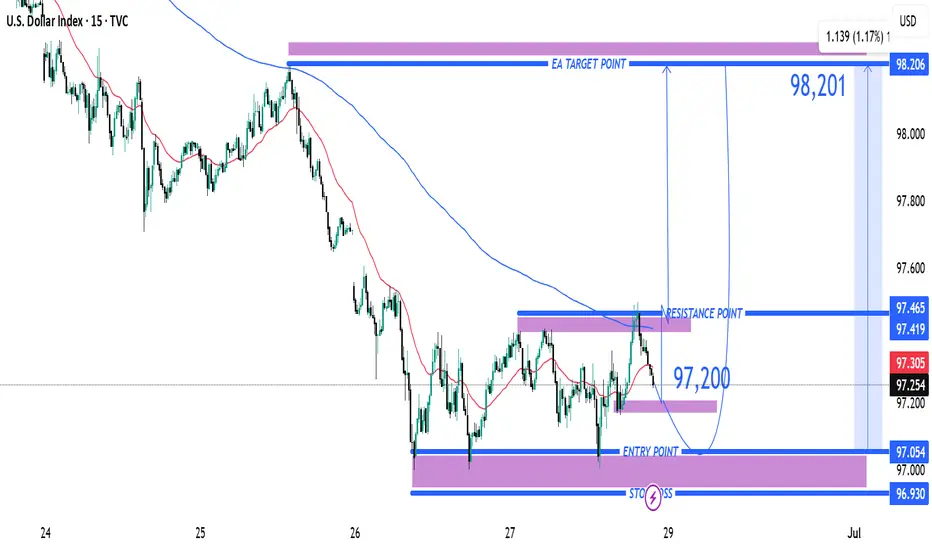
Entry Point Marked at: ~97.200 The price has already reacted m Entry Point
Marked at: ~97.200
The price has already reacted multiple times around this level, suggesting it's a key support zone.
🛑 Stop Loss
Placed at: ~96.930
Just below the support zone, protecting against a breakdown below recent lows.
This implies a risk of about 27 pips from the entry.
🎯 Target Point (TP)
Marked at: ~98.201
Strong resistance zone from previous price action.
Target implies a potential reward of 100+ pips, offering a risk-reward ratio (RRR) of ~3.7:1, which is favorable.
📊 Resistance Area
Around 97.419–97.465
This is the first obstacle the price must break through to confirm bullish continuation.
The 200 EMA (blue curve) is currently acting as dynamic resistance, aligning near this zone.
📉 Indicators
Moving Averages:
Red: Likely 50 EMA
Blue: Likely 200 EMA
Price is currently below both EMAs — so trend is still bearish, but trying to shift.
📌 Strategy Insight
The setup anticipates a bullish reversal from 97.200, aiming for a breakout above the 200 EMA and resistance to reach the 98.201 zone.
For confirmation, watch for a strong bullish candle close above 97.465, which would validate upside continuation.
⚠️ Risks
Price is still under both moving averages → downward momentum may persist.
If support at 97.00 breaks, downside acceleration could occur.
✅ Conclusion:
This is a bullish breakout setup on DXY with:
Defined entry and stop-loss.
Clear target.
High RRR.
But it’s crucial to wait for confirmation above resistance (97.465) before full conviction on the long trade.
DXY Weekly Free Analysis (28-06-25 to 05-07-25)DXY
In early July 2025, the US Dollar Index (DXY) may start moving up from the support area around 96.70. This is because the US is expected to release strong job and service sector data (like Non-Farm Payrolls and ISM Services), which shows the economy is still doing well. Also, the US central bank (Federal Reserve) is likely to keep interest rates high to control inflation, which usually supports the dollar. On the other hand, Europe’s economy is slowing down, so the European Central Bank might lower rates, making the euro weaker compared to the dollar. If global markets become risky, more people may buy dollars as a safe option. All these reasons could help the dollar bounce back in the coming days.

DXY Bullish Reversal & Cup FormationThe DXY (US Dollar Index) is exhibiting a strong bullish reversal pattern, with multiple technical signals suggesting upward momentum:
🔍 Technical Analysis Summary:
✅ Support Holding Strong:
Price has respected the horizontal support zone around 98.00–98.50 on multiple occasions (highlighted by orange circles and green arrows), forming a solid base.
✅ Breakout from Downtrend:
A clear breakout above two descending trendlines (black and blue) indicates a shift from bearish to bullish sentiment.
✅ Cup Pattern Formation ☕:
A textbook Cup pattern is visible, where price formed a rounded bottom — a bullish continuation formation. The handle is minor and price has broken above the neckline (around 99.00), signaling a potential continuation toward the target.
✅ Bullish Target 🎯:
Based on the cup pattern and prior resistance, the projected target is around 101.846, aligning with previous major resistance.
📌 Key Levels to Watch:
Support Zone: 98.00 – 98.50
Immediate Resistance: 99.50 – 100.00
Major Resistance/Target: 101.846
🧭 Outlook:
As long as the price remains above the 98.50 zone, the bullish scenario remains intact. The cup breakout indicates strong buying pressure, and momentum could push DXY toward the 101.846 target in the coming sessions.

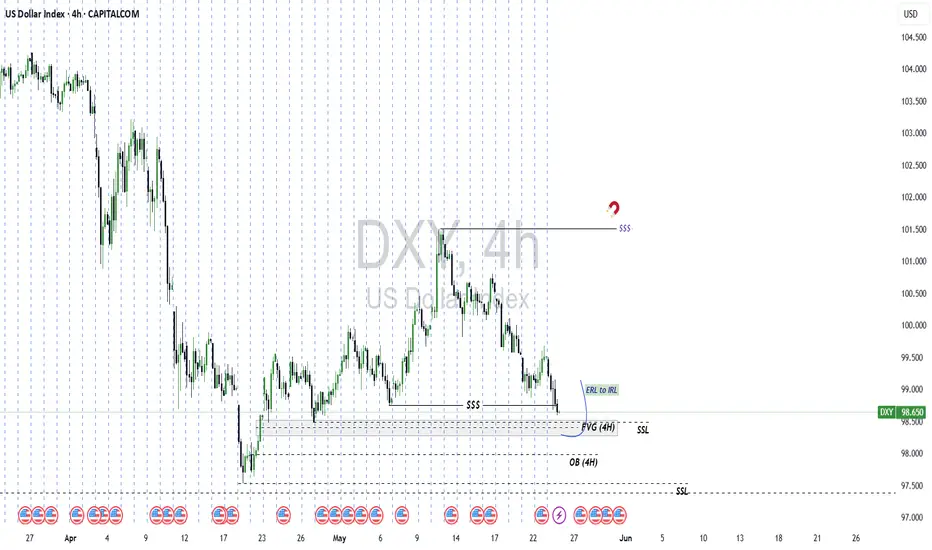
U.S. Dollar Index (DXY) Bearish Setup – Supply Zone Rejection & 🔹 Trend Overview
📊 Overall Trend: Bearish (Downtrend)
📉 Price is forming lower highs and lower lows within a descending channel.
🔻 Recently bounced off a support zone, now heading toward a potential pullback.
🔵 Supply Zone (Resistance Area)
📍 Zone Range: 100.049 – 100.601
🧱 Acts as a resistance block where sellers might step in.
📏 Confluent with EMA 70 at 100.178, strengthening its validity.
🔸 Trade Setup – Short Position
🟠 ENTRY POINT: 100.088
❌ STOP LOSS: 100.587 – 100.595 (Just above supply zone)
🎯 TARGET: 98.000 (With intermediate support levels)
📌 Support Levels
🔹 98.112 – First minor support
🔹 98.106 – Close-range confirmation
🔹 97.885 – Additional support zone
🟦 Main Target: 98.000
⚖️ Risk/Reward Ratio
🟧 Small risk above supply zone
🟩 Large reward to downside = Favorable R:R
📌 Summary
📈 Expecting a pullback into supply zone.
🧨 Look for bearish confirmation around 100.088.
🎯 Target the downside at 98.000 for profit.

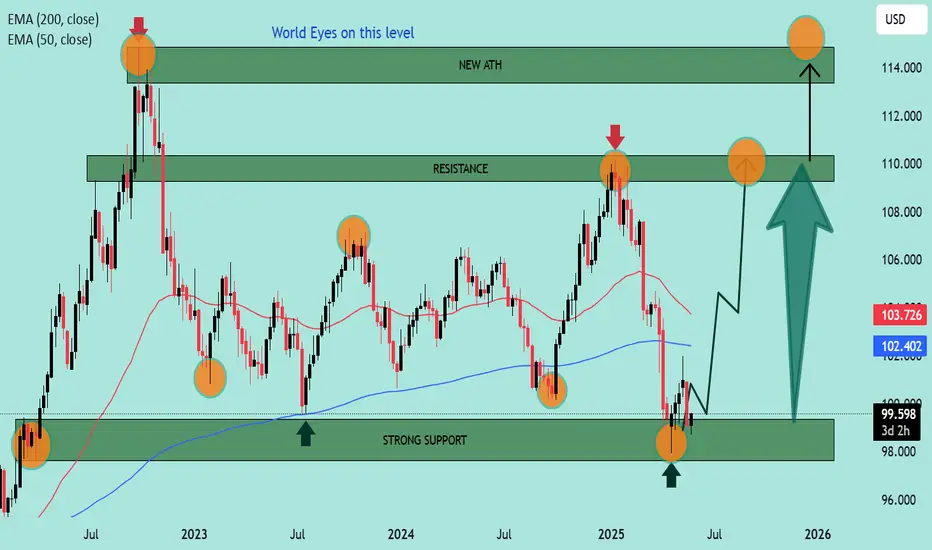
DXY Technical Outlook – Strong Support Test and Bullish Reversa Chart Summary
The DXY (U.S. Dollar Index) chart illustrates a significant technical structure between strong historical support and resistance zones, with potential for a bullish reversal after a key level retest.
🟢 Key Support Zone: 99.000 – 98.000
📍 Labeled as "STRONG SUPPORT", this zone has held multiple times:
Previous bounce: Early 2023 ✅
Mid-2024 rebound ✅
Current price action once again shows a reaction from this level with a bullish candle forming 🔥
📌 EMA Confluence:
The 200 EMA (blue) sits at 102.401
The 50 EMA (red) at 103.725
Price is currently below both EMAs but near the 200 EMA, suggesting potential for a mean reversion bounce 📈
🔴 Resistance Zones to Watch:
Resistance Zone: 109.000 – 110.000
⛔ Historically rejected in late 2023 and again in early 2025
🧱 Acting as a supply zone — watch for rejection or breakout
ATH Supply Zone: 113.000 – 114.000
🚨 This is a major psychological and technical barrier
🫡 Marked as “NEW ATH” – would need strong momentum and fundamentals for a breakout above this level
📈 Price Action Expectations:
With strong support respected again, a bullish reversal toward 109.000 – 110.000 appears likely (as illustrated by the arrow).
If momentum continues, a retest of ATH zone is on the cards 🔭
However, a failure to hold support could lead to breakdown below 98.000 – watch closely 🔍
🧭 Strategic Insight
Bullish Bias while above support (98.000 zone)
Reversal Confirmation needed above 102.401 (200 EMA) and 103.725 (50 EMA)
Watch for rejection near 110.000 resistance before ATH test
📌 Final Note:
🧊 World Eyes on this Level – As highlighted on the chart, the current support area is under global observation, reinforcing its importance.
🕵️♂️ Stay alert for breakout volume and fundamental catalysts (e.g., Fed decisions, CPI, jobs data).
DXY Weekly Free Analysis (25-05-25 to 31-05-25)This week, the US Dollar Index (DXY) may trade between 96.45 (support) and 98.80 (resistance). A break above 97.60 could push it toward 100, while a drop below 96.45 may test 95. Watch for Fed cues and economic data to drive momentum.

Technical Analysis of DXY (US Dollar Index) for the Week of May # Current Price Action and Market Context
Recent Price Movement: As of May 23, 2025, the DXY closed at approximately 99.11, down 0.85% from the previous session's close of 99.96. The index has been trending downward, testing two-week lows near 99.14 after failing to reclaim the 100.50 level.
Bearish Momentum: The break below 97.50 on the monthly chart signals a bearish structure with lower highs and lower lows, suggesting continued selling pressure. The next major downside target is around 96.00, with a potential longer-term target near 92.00.
Key Fundamental Drivers: Recent weakness in the DXY is attributed to President Trump’s proposed 50% tariffs on European imports, which have undermined bullish momentum in the dollar. Additionally, anticipation of Federal Reserve interest rate decisions, upcoming US inflation data, and employment reports (e.g., Non-Farm Payrolls) will play a significant role in the DXY’s direction.
-- Chart for your reference --
-- Disclaimer --
This analysis is based on recent technical data and market sentiment from web sources and X posts. It is for informational purposes only and not financial advice. Trading involves high risks, and past performance does not guarantee future results. Always conduct your own research or consult a SEBI-registered advisor before trading.
US Dollar to bounce? DXY Longs and EU shorts on the table.1. Based on the technical analysis, it seems that the US Dollar will have bounce after all. A quick liquidity purge near the SSL levels might be on the checklist. Nonethless, I'll be looking forward to EU shorts this week.
2. There is also a divergence between EU and GU on HTF. GU has shown liquidity purge on BSL which EU hasn't.
DXY will go to 88-89 in next 18-24 months before 2026 end , sellHow to take trades using Harmonic pattern projection Trade setup is explained below :-
Entry : 1st SL point : 0% is recent top or bottom.
Trailing D: 15.1% is work as trailing SL of buy or sell trade if hit then we have to book profit
.If price goes below 2nd D 22.5% to 24.5% range then early traders can make fresh reversals trade after breaking 1st D 15.1% safe traders can reversal trade after breaking Point D 22.5.4% to 24.5% range
Targets :
Target T1 : 36.1% to 38.3%
Target T3 : 49.1% to 52.5%
T3: 60.9% to 64.8% is our 3rd Target since this is reversal zone so must book profit if break then take fresh trade again
Target T4 : 76.4% to 79.7%
Next Targets are 100% , 127.2% ,141.4% and final Target 161.8%.
How to take reversal trade :
If price going upside/ downside then then buy or sell levels appear on Chart ( Automatically show when price reach any reversal zone of harmonic projection ).
Trailing SL:
After reach 1st Target trail SL to just above or below cost ( for example we are holding sell trade from 100 1st Target 110 hit then move trailing sl to 104-105 and move SL as price move upside or Downside)
Re- Entry :
For Re-entry in any pull back Point D ( 15.1% ) is used for re-entry then SL recent high or low Point SL ( 0% ) .
Blue Line is 1st support/ Resistance
Green line is 2nd support/ resistance
Red line is 3rd Support/ resistance

DXY Bearish Setup: Sell from Supply Zone to 99.100 TargetTrend: 📉 Bearish Bias
Key Zones & Strategy:
🔶 Supply Zone (Sell Area)
📍 100.584 – 100.906
⚠️ Price may face selling pressure here
🔵 Entry Point:
🎯 100.584 (bottom of supply zone)
🔴 Stop Loss:
❌ 100.906 (just above resistance)
🟢 Target Point:
✅ 99.100
📉 Aligned with lower support line
Technical Indicators:
📏 Descending Channel
🔽 Price moving within parallel downward trend lines
📊 EMA (70) – Orange Line
🔁 Acting as dynamic resistance
Trade Setup Summary:
📌 Sell in the Supply Zone
🛑 Stop Loss: 100.906
🎯 Target: 99.100
⚖️ Good Risk-Reward Ratio
Warnings & Tips:
⚡ Watch for Breakouts:
If price breaks above 100.906 ➡️ 📈 Bearish idea invalid
📰 Check News Events:
FOMC, CPI, or other USD events may cause volatility

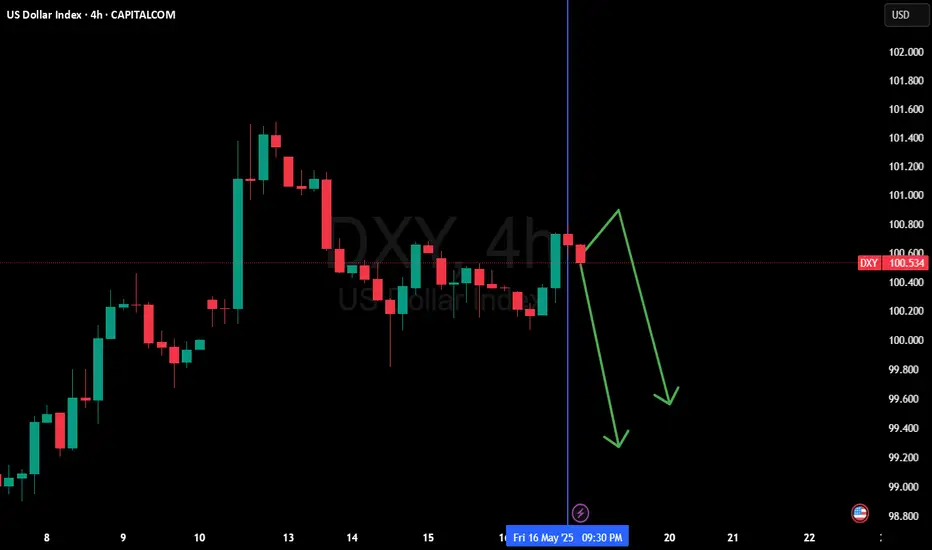
DXY Weekly analysis (18-05-25 to 24-05-25)📊 Technical Analysis (4H Chart – DXY)
Current Price: ~100.53
Price action shows a rejection from the 100.60–100.80 zone after a minor bullish push. The structure is starting to roll over, and two potential bearish paths are illustrated with arrows heading toward 99.80 and possibly 99.30.
🔍 Key Technical Observations:
Support Zones:
• 99.80 (minor)
• 99.00 – 99.30 (major, previous reversal zone)
Resistance Zones:
• 100.50 – 100.80 (recent rejection zone)
• 101.50 – 102.00 (larger timeframe resistance)
Price appears to be forming a lower high, indicating a possible shift in momentum.
The bearish projection paths suggest potential downside movement unless bulls reclaim control above 100.80.
🔴 Bias:
Bearish short-term unless price reclaims and sustains above 100.80
🌍 Fundamental Outlook for the Week (13–17 May 2025)
🏦 1. Fed Policy Stance
The Fed remains on hold with a data-dependent approach. Persistent inflation and strong jobs data have delayed market expectations for rate cuts—supportive of USD. However, upside may be limited if inflation cools.
📈 2. Key US Data to Watch
CPI (May 15, Wed): Already released. If the print was softer than expected, it may justify the pullback seen on the chart.
Retail Sales (May 16, Thu): Key driver. Weak data could accelerate the drop toward 99.80.
Jobless Claims: Still low, but any uptick may weaken the dollar further.
💹 3. Geopolitics & Risk Sentiment
No significant escalation in global risk events. Risk sentiment remains mixed. If risk appetite strengthens and yields cool off, USD may continue lower.
✅ Conclusion
DXY outlook is bearish near-term if price remains below 100.80.
Expect potential downside toward 99.80 or even 99.30 based on chart structure.
Only a strong shift in data or sentiment (e.g., hawkish Fed remarks or geopolitical tension) could reinstate bullish momentum.
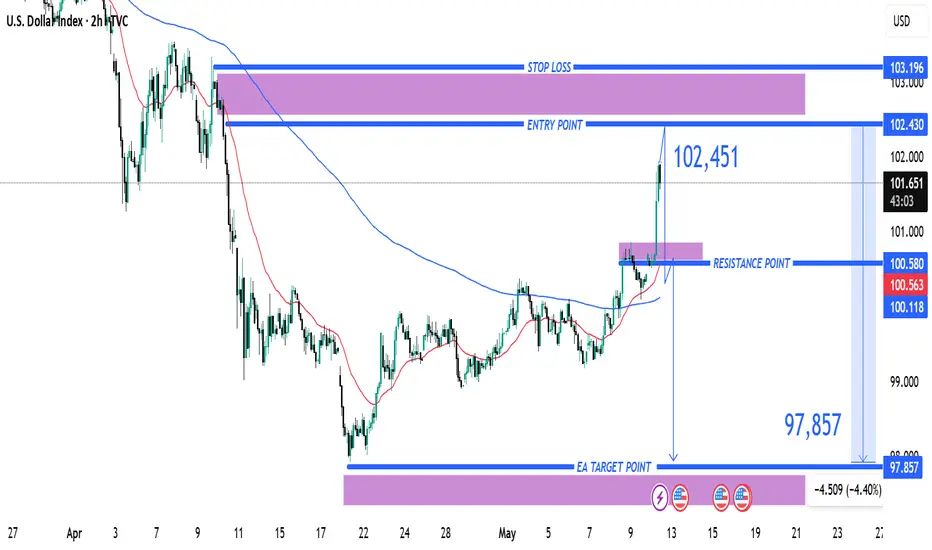
(DXY) Short Setup: Reversal Expected from Resistance Zone1. Entry Point: ~102.430
The price is currently below this level at 101.583, suggesting a potential short setup once the entry level is reached or confirmed.
2. Stop Loss: ~103.196
This is the price level where losses are limited if the trade moves against the intended direction. It's placed above a strong resistance zone.
3. Resistance Point: ~100.580
This was a previous resistance level which has now been broken, indicating a bullish push. The current price is above this, which may signal a breakout.
4. EA Target Point: ~97.857
The take-profit level, significantly lower, indicating a bearish target. This suggests a short position is intended from the entry point.
Indicators and Signals
The chart uses moving averages (likely 50 EMA and 200 EMA), and the price has surged above them, often a bullish signal.
However, the analysis seems to anticipate a reversal from the 102.430 level, expecting a drop back down toward 97.857.
The move from the current price to the target would be a 4.40% decline, a significant move for an index.
Trade Plan Summary
Trade Type: Likely a short/sell from the 102.430 level.
Risk: ~0.77 (103.196 - 102.430)
Reward: ~4.57 (102.430 - 97.857)
Risk-to-Reward Ratio: Approx. 1:6, which is favorable if the setup works out.