HDFC bankLook how slowly on weekly accumulation is happening.
Price has respected Gann angles since last 4 weeks
Price is abv 20 MA on Daily.
target for now is 1700-1720
H1DB34 trade ideas


HDFC - Perfect Reversal from 2:05 p.m. candle yesterday
Mentioned in my last so many discussions time of reversal of HDFC Bank and check the result exact reversal from this candle. Link provided.
Now watch this candle for further move 10-12-23 12:53 PM. On 12th October mark high and low of this candle and buy only above it.
Thank you.


HDFC BANK - DON'T BUY CURRENTLY#HDFCBANK #stockstowatch #nifty50
HDFC BANK - Currently broken the weekly up trend line and given reverse retracement also. Hence we can understand it may move to the next support Zone 1325 to 1280 levels in coming months.
Buying Only after the Down trendline breakout.

How to make Big Profit💸 With Small Account👑🤑💸By Big Bulls💸👑Royal Trend👑
Topic Trading Things
How to make Big Profit💸 With Small Account
In this video we try to Identify Trend and Entry By Big Bull👑🤑🤑💸💸
How market really work with number's
How important is option chain analysis?
The option chain analysis data provides a very comprehensive view for all the available options for any particular underlying asset. This helps in understanding and selecting the correct option for trading or investment purpose.
Difference between technical analysis and option trading
Technical analysis and options trading can go hand in hand. Many of the best practices for options trading come directly from technical analysis concepts. Technical analysis focuses on price. Fundamental analysis does not solely focus on price.
why we learn option chain?
Option chain is a chart that will give in-depth information related to all stock contracts available for Nifty stocks. The best thing about the option chain is that it provides valuable information about the current security value and how it will affect it in the long term.
What is the purpose of option chain?
It can be used in creating an option strategy at several strike prices. It can be used to analyse and draw noteworthy insights about the stock and its probable movements. It helps the traders in evaluating the liquidity and the depth of the option contract.
Technical trader
Technical trading is a broader style that is not necessarily limited to trading. Generally, a technician uses historical patterns of trading data to predict what might happen to stocks in the future. This is the same method practiced by economists and meteorologists: looking to the past for insight into the future.
NOTE
#We Are Not Promote Anything
#This channel Purpose to share market ideas.
Thanks for Watching🙏

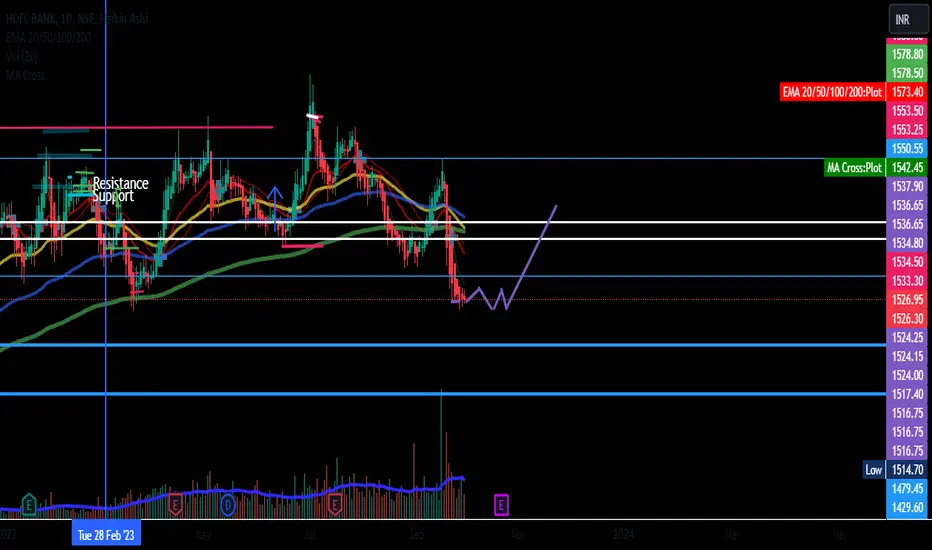
HDFC Bank - Very Bullish above 1526
Last Low and levels for 9th October have been marked on the chart itself. 1526 is a very crucial level for HDFC marked by sky blue horizontal line. Please mark 2:01 P.M. candle on 9th October and it is going to dictate the future. Sell below and further levels together with Buy above and further levels have been mentioned on the chart itself. Previous ideas on HDFC Bank are linked for your better understanding. Please adhere to proper price and time levels.
I am not a SEBI Registered Analyst. This is only for educational purposes. Please consult your financial advisor before making any decision.


HDFC Bank Update
Levels of HDFC Bank have been marked on 1H Chart. Please mark high and low of the candle of at the time mentioned in the chart itself. It was mentioned in my earlier discussion also. Buy only when that is broken upside. 1506 is yesterday's low by mistake mentioned as close in the chart.

HDFC Bank - Final supportHello Investors,
All these two years HDFC bank share had tough time for investors. Now I did a monthly time frame analysis with the trend line and horizontal price engagement area meeting the trend line.
Hope this could be the final swing to come low for HDFC bank.
What are the support levels ?
1505, 1500, 1498, 1480
From any of these price point it will bounce and will have a pleasant rally, why ? FII buying in HDFC Bank has increased from the june quarter and the DII as well showing interest.
Thanks

HDFC Bank at Demand ZoneHDFC Bank at demand zone watch this areas 1530 to1500 price action any positive price action zoom into lower time frame to get early entry here i have posted daily chart if held here can long this stock to 1550,1575 and 1600 evels again .
1500 Below price voilates long invalid .

