Aarti IndustriesStock is trading on a support and formed the inside bar on daily time frame also given the breakout will show some momentum upside SL will be below support trendline daily basis on closing
Trade ideas

Aarti Industries Limited (AARTIIND)Aarti Industries Limited:- Manufacturing and supplying specialty chemicals, intermediates, and pharmaceuticals, catering to diverse industries such as agrochemicals, pharmaceuticals, polymers, additives, and energy.
Integrated Manufacturing: The company leverages backward and forward integration across its value chain, producing key raw materials in-house to ensure cost efficiency and supply chain control.
Diversified Product Portfolio: It offers over 200 products, including benzene-based intermediates, specialty chemicals, and active pharmaceutical ingredients (APIs), reducing dependency on a single market.
Custom Synthesis: A significant portion of revenue comes from tailored solutions for global clients, particularly in the U.S. and Europe, through long-term contracts.
Export-Oriented: Approximately 60-70% of its revenue is generated from exports, targeting regulated markets with high-quality standards.
Innovation and R&D: The company invests in research and development to develop new molecules and improve processes, supported by multiple R&D centers.
Sustainability Focus: It emphasizes eco-friendly production processes and energy-efficient technologies to align with global environmental norms.
Key points:
The stock has risen 37% from its 52-week low of INR 344.20 (April 2025) but is 37.5% below its 52-week high of INR 765.50 (August 2024).
potential Bullish Megaphone pattern on the chart,with resistance near INR 500 and support at INR 450-460. A breakout above INR 500 could target INR 540-555.
** Recent news indicates a potential recovery in the chemical cycle, improved demand and profitability in key segments like energy.

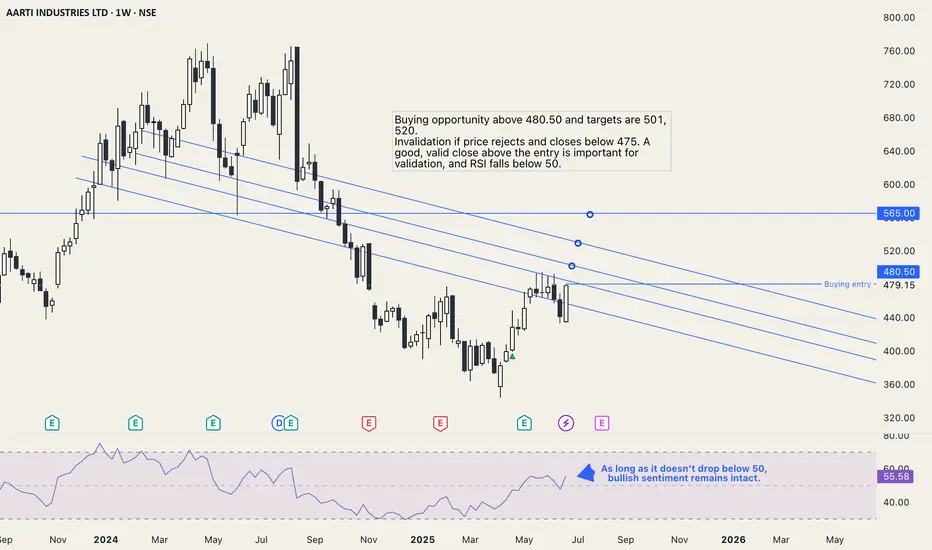
AARTIIND trading strategyBuying opportunity above 480.50 and targets are 501, 520.
Invalidation if price rejects and closes below 475. A good, valid close above the entry is important for validation, and RSI falls below 50.
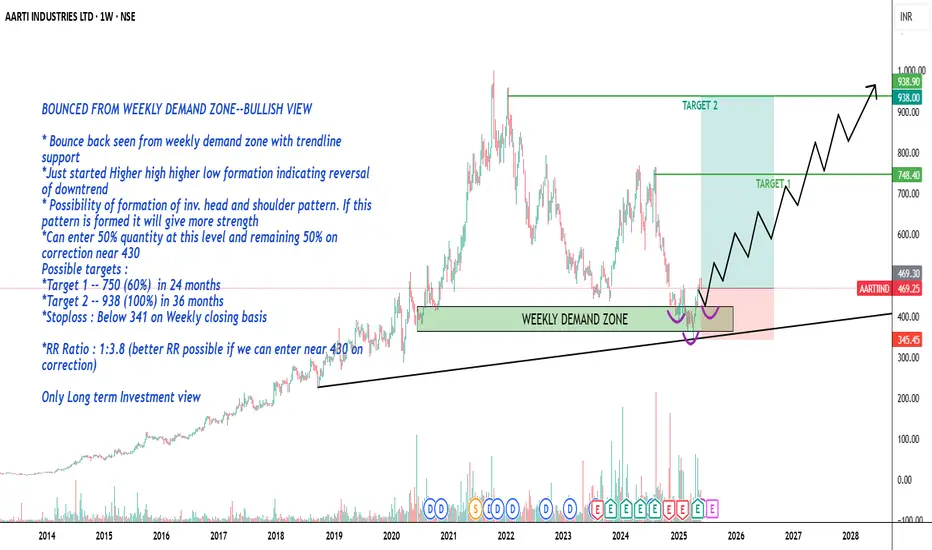
AARTI IND-- Bullish view-Educational PurposeAARTI IND--BOUNCED FROM WEEKLY DEMAND ZONE--BULLISH VIEW
* Bounce back seen from weekly demand zone with trendline support
*Just started Higher high higher low formation indicating reversal of downtrend
* Possibility of formation of inv. head and shoulder pattern. If this pattern is formed it will give more strength
*Can enter 50% quantity at this level and remaining 50% on correction near 430
Possible targets :
*Target 1 -- 750 (60%) in 24 months
*Target 2 -- 938 (100%) in 36 months
*Stop loss : Below 341 on Weekly closing basis
*RR Ratio : 1:3.8 (better RR possible if we can enter near 430 on correction)
Only Long term Investment view
AARTI INDUSTRIES LTD📊 Intraday Support & Resistance Levels (15-Minute Interval)
Based on recent technical data, the following are the key support and resistance levels for AARTIIND:
Support Levels:
S1: ₹466.67
S2: ₹464.97
S3: ₹462.22
Resistance Levels:
R1: ₹472.17
R2: ₹473.87
R3: ₹476.62
These levels are derived from Fibonacci pivot point calculations and are pertinent for intraday trading decisions.
📈 Technical Indicators Overview
Trend Analysis: The stock exhibits a bullish trend in the short to mid-term, with resistance noted around ₹486.90 and support near ₹420.40.
Moving Averages: AARTIIND is trading above its 50-day moving average, indicating upward momentum.
Relative Strength Index (RSI): The RSI is approaching overbought territory, suggesting caution for new long positions.
✅ Trading Strategy Suggestions
Long Positions: Consider entering if the price sustains above ₹472.17 (R1) with strong volume, targeting ₹476.62 (R3).
Short Positions: If the price falls below ₹466.67 (S1), it may test lower supports at ₹464.97 (S2) and ₹462.22 (S3).
Stop-Loss Recommendations:
For Long Trades: Place a stop-loss below ₹466.67.
For Short Trades: Place a stop-loss above ₹472.17.
Aarti industries after hitting YDZ There is simple and heavy YDZ as you price took support and now continuously going up 😔. Whenever stock came to this type of zone there is a investment opportunity. Try to learn and find these type of zones in every stock.

Right Chemistry for a Brighter TomorrowAarti Industries Ltd, the flagship company of the Aarti group, manufacturing organic and inorganic chemicals at its major facilities in Vapi, Jhagadia, Dahej and Kutch, in Gujarat and in Tarapur in Maharashtra. The company has a strong market position in the NCB-based specialty chemicals segment.
Aarti Ind CMP - 464.
This is just to boost my confidence. No Suggestions for buying.
Disclosure: I am not SEBI registered. The information provided here is for educational purposes only. I will not be responsible for any of your profit/loss with these suggestions. Consult your financial advisor before making any decisions.

AARTI IND BUY ZONEPrices are jumbled up here check kite for better understanding.
Entry and stoploss are marked.
Risk reward= 1:2
If stoploss hits and you get a chance to re-enter the trade then don't take risk more than 3%.

Aarti Industries - In supply zoneStock currently in weekly, daily, 125 mins supply zone
Zone ranges from 460 to 470
Currently at 467
Looks a good area to sell with strict SL above 475
Downside targets at least 430

Aarti Industries.This stocks likely to be finishing double correction and may rise in counter trend for B or X
Rsi and price action suggesting some reversal at this levels. lets see
# disclaimer : this chart is only for educational purpose of Elliott wave practitioners.
Do not take this as a recommendations as Elliott wave is always a subjective concept.

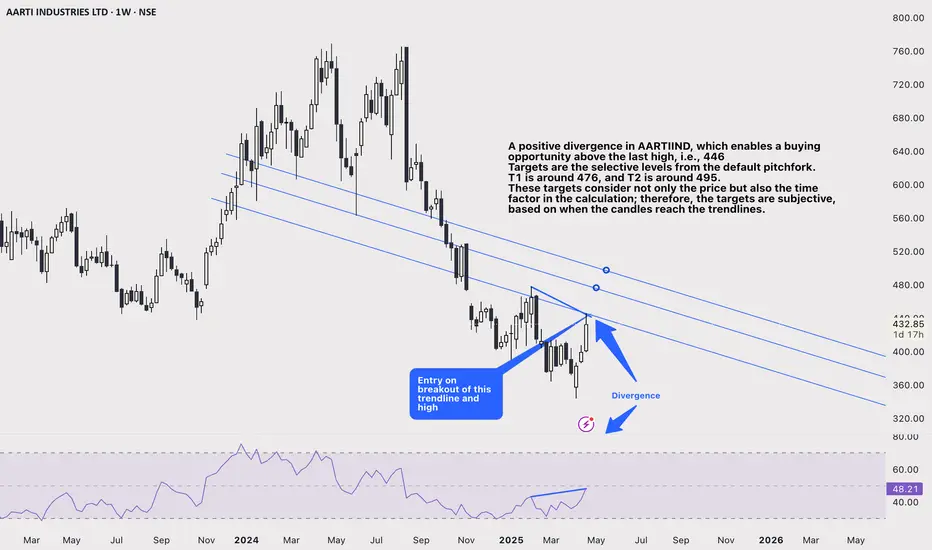
Bullish divergence in AARTIINDA positive divergence in AARTIIND, which enables a buying opportunity above the last high, i.e., 446
Targets are the selective levels from the default pitchfork.
T1 is around 476, and T2 is around 495.
These targets consider not only the price but also the time factor in the calculation; therefore, the targets are subjective, based on when the candles reach the trendlines.
Entry is active only on breakout of high 446, and if waited for retest of this level will validate it more. An entry on lower time not less than 4h is suggested.
Alternatively, I will also be looking for 1 hour for early entry.
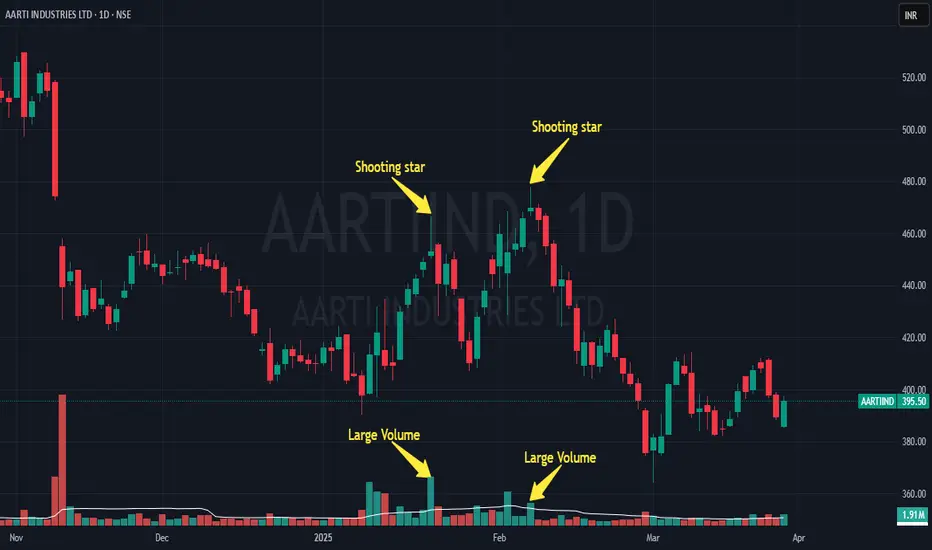
Shooting Star Candlestick Pattern The Shooting Star is a key candlestick pattern that signals the end of an uptrend. It looks like a small body with a long upper shadow, and very little or no lower shadow. This pattern often appears at the peak of an uptrend and can indicate a potential reversal.
How to Identify the Shooting Star:
1) Long upper shadow: The upper shadow should be at least twice as long as the body.
2) Gap up: Price opens higher than the previous day’s close.
3) Small body near the bottom: The body of the candle is small and near the bottom of the price range for the day.
4) No lower shadow: The lower shadow is very short or nonexistent.
What It Means:
The market opens strong and pushes higher during the day, but by the end, the price falls back down, showing that sellers are starting to take control. This could indicate that the uptrend is losing momentum and a reversal might be near.
Confirmation:
Look for a bearish candle or a gap down the next day to confirm the Shooting Star pattern.
Key Insights:
1) The longer the upper shadow, the stronger the potential for a reversal.
2) A gap up followed by a Shooting Star can signal an even stronger reversal.
3) High volume on the Shooting Star day can increase the chances of a significant price change.
Example with AARTIIND (Daily Chart) 📊:
This is a daily time frame chart of AARTIIND, where a Shooting Star pattern is forming at the top of an uptrend. This visual example will help you better understand how the pattern works in real market conditions.
Trendline breakout after consolidation can give good move upsideWith good R:R upside target looks achievable as it is looking trendline breakout
also stock has been seen a lot of selling pressure and it may give good bounce

AARTIIND - DAILY CHARTAARTIIND is taping in Order Block, seems in the buying zone. Probability of an upside move.
Must use SL.
If you like my analysis, please follow me as a token of appreciation :)
in.tradingview.com/u/SatpalS/
For learning and educational purposes only, not trading advice. Please consult your financial advisor before investing.

Aarti Industries Breakout Long Call Technical Alert: Aarti Industries (AARTIIND)
Breakout Confirmation
Aarti Industries has successfully breached the crucial resistance level of ₹460, closing above it. This breakout is significant, as the stock has resisted this level three times in the past.
Trade Setup: Long Call
- Target: ₹515
- Stop Loss (SL): ₹450
- Risk-Reward Ratio: Favorable
Technical Analysis:
1. Moving Averages: AARTIIND is trading above its 44-day moving average, indicating a strong uptrend.
2. Candle Pattern: The breakout is supported by a bullish candle pattern, suggesting further upside.
3. Resistance Levels: As per the chart, there is no significant resistance above ₹472, paving the way for the stock to reach its target.
Trade Rationale:
The target of ₹515 is calculated based on the support-to-resistance breakout level. With a favorable risk-reward ratio, this trade setup offers an attractive opportunity for investors.
Disclaimer: This is a technical analysis-based trade setup. Investors are advised to conduct their own research and consult with their financial advisors before making any investment decisions.

AARTIIND (Aarti Industries Ltd)- AnalysisBullish Levels -day closing above 457 (early entry risky) then 493 to 501 then 528 to 546 (safe entry if day closing above this) first target can be around 629 if sustain above this for a week or two then we can expect targets targets around 806 then 940 above this more bullish
Bearish levels :- Day closing below 409 to 401 then 374 then 338 good support best for averaging with SL of 329 to 325 strict SL for Long term Investor below this more bearish.
**Consider some Points buffer in above levels
**Disclaimer -
I am not a SEBI registered analyst or advisor. I does not represent or endorse the accuracy or reliability of any information, conversation, or content. Stock trading is inherently risky and the users agree to assume complete and full responsibility for the outcomes of all trading decisions that they make, including but not limited to loss of capital. None of these communications should be construed as an offer to buy or sell securities, nor advice to do so. The users understands and acknowledges that there is a very high risk involved in trading securities. By using this information, the user agrees that use of this information is entirely at their own risk.
Thank you.

Aarti Ind - Low Risk OpportunityIn the last 6 months, the stock price has come down around 40%. This time has been consolidating in a small range in recent days.
MACD is showing a possible reversal on a weekly basis.
If it gives a reversal, it may go into a bullish phase again.
Possible targets are 485/570/620++.
If it sustains below 370, the setup goes weak.
One has to keep the position size in accordance with risk management.
This illustration is my own view. It is only for learning and sharing purposes. It is not a buying recommendation.
All the best.

AARTIINDAs per Hekin candle we may see a upside once breaking of Resistance Trendline and levels are maked just a view not a reco...

Aarti IndustriesSL 1Hr candle close only, Target Trigger Price
All detail for chat. good entry at mark price only. and must stoploss minimum risk and good profit. risk ratio 1:1 to manage modified SL. This is not call, Just my idea. Please understand your risk and take full responsibility of your actions

AARTIINDafter falling from the high of 1000
it has been inside the parallel channel since past 2 years
now after mild retracement it may try to break the channel towards up
but 680 is crucial level which it may not be able to break and has to consolidate further

Parallel channel breakout in Aarti IndustriesNSE:AARTIIND A parallel channel breakout is happening at 415 levels. So for a swing trade buy at 425 levels & with fib retracement 1st target is 515 & 550.
The SL would be at 390 or a swing low.

Positional Long : Aarti Industries
Aarti Industry has given a good correction of ~64% from its top due to weakness in its energy business, drop in Mono Methyl Aniline (MMA) margins ,and is trading near a important support area i.e 400 level.
Currently its following a descending channel pattern and has formed a double bottom pattern.
Earlier price has formed a Head & Shoulder pattern, & price descended ~25% which was due as per the H&S Pattern.
Given the headwinds looks like a good positional buy with a staggered accumulation approach in major dips.
⚡Note: This is just for analysis purpose, please do your own research before punching any orders.
🔍 For more technical analysis and trade setups, make sure to follow me on trading view.
🔗 Trading View: in.tradingview.com/u/DebasisT/
