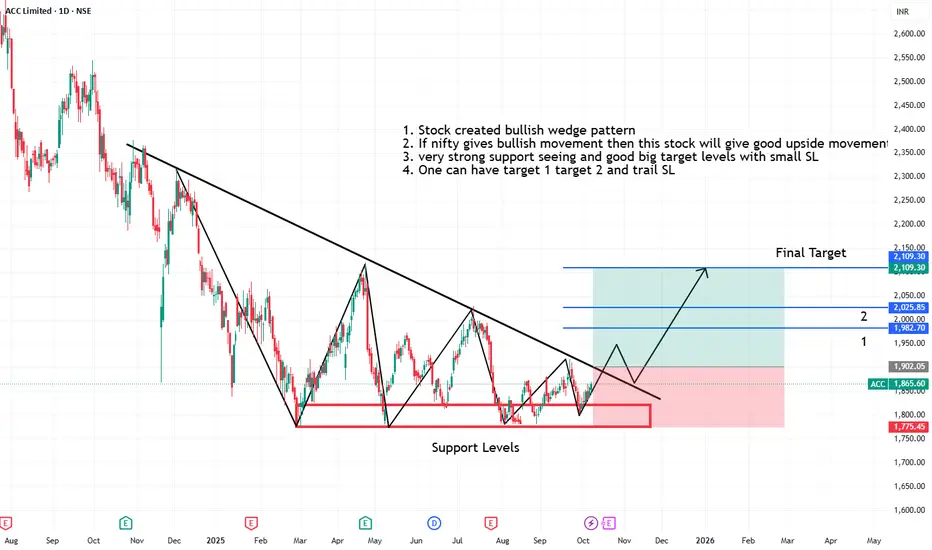
Acc creating bullish wedge pattern on strong support levels1. Stock created bullish wedge pattern
2. If nifty gives bullish movement then this stock will give good upside movements
3. very strong support seeing and good big target levels with small SL
4. One can have target 1 target 2 and trail SL
Next report date
—
Report period
—
EPS estimate
—
Revenue estimate
—
128.75 INR
24.02 B INR
207.89 B INR
81.33 M
About ACC Limited
Sector
Industry
CEO
Vinod Mohanlal Bahety
Website
Headquarters
Ahmedabad
Founded
1936
ISIN
INE012A01025
FIGI
BBG000CNM7Y8
ACC Ltd. engages in the manufacture and sale of various kinds of cements. It operates through the following segments: Cement and Ready Mix Concrete. The Cement segment is a clinker resulting from mixing at suitable rates, grinding and firing raw material such as limestone, clay, iron ore, fly ash, bauxite and certain amount of setting regulator are ground together and set after mixing with water and gains strength. The Ready Mix Concrete segment is concrete that is manufactured in a batch plant, according to a set engineered mix design. The company was founded on August 1, 1936 and is headquartered in Ahmedabad, India.
Related stocks
ACC LongAs Crude Oil price getting reduced globally. It will make the cement factory more favourable for the EPS TO grow.
Long term target of RS: 3000 is on. If trend line on the bottom is not broken.

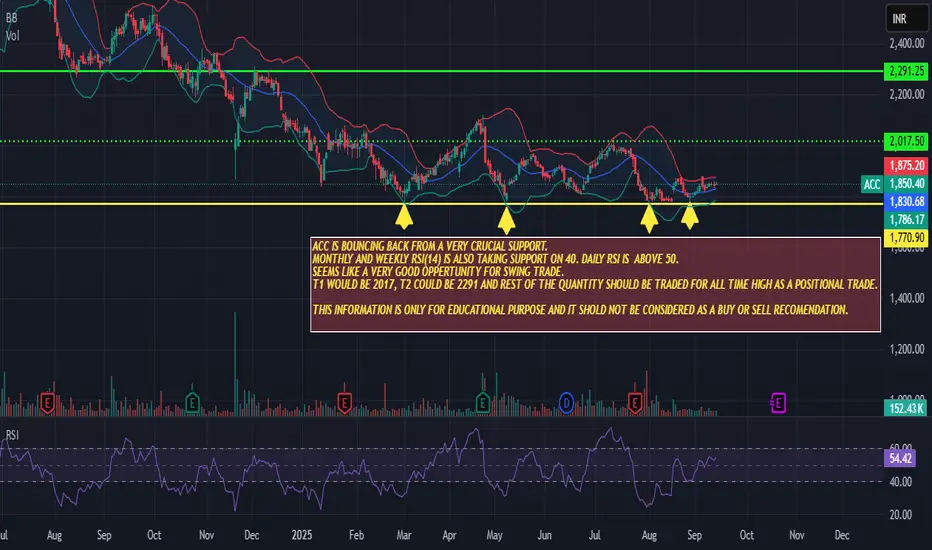
ACC for swing and positional tradeACC is bouncing back from a very crucial support.
Monthly and weekly RSI(14) is also taking support on 40. Daily RSI is above 50.
Seems like a very good opportunity for a swing trade.
T1 would be 2017, T2 could be 2291 and rest of the quantity should be traded for all time high as a positional trad
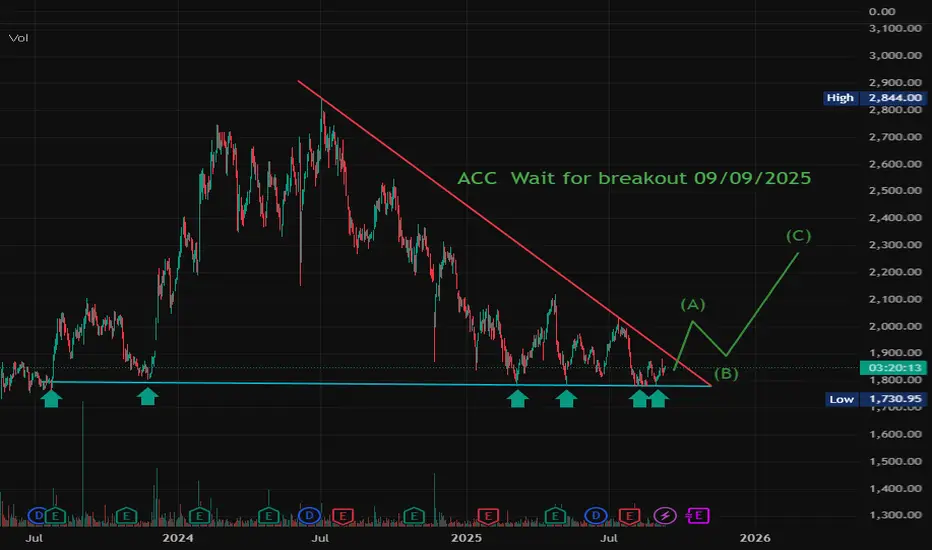
ACC Wait for breakout 09/09/2025ACC Cement : Exchange –NSE India Timeframe –Daily . Acc on daily timeframe 20/07/2023 first time support the level 1780 next time 21/11/2023 same point respect level. I am draw this two point support line. Next 4 times Acc Respect the support line. 2/07/2024 top and 11/07/2025 lower high of lo
ACC good profits growth but no price growth - very low pe ratiohigh probable for a bounce - since every-time stock touches the long-term trendline it bounces at least 40-50% + stock pe at a very low point.
2025 Company pe at 15
2020 covid crash pe was 17
2008 crash pe was 8
Company is almost debt free.
Stock P/E 15.0
Sector PE at 50
Market Cap ₹ 34,958 Cr.
R

ACC looks GoodSee that ACC has formed a base .It can move from here.
** Not a buy sell recommendation

ACCACC cement is currently trading at very good level; we have seen that it became bullish from this level (1800). with Strick sl we can plan this for long.

ACCACC INDIA PVT LTD Again taking support from marked level, this can reward us with at least 10% in next two weeks or else except marked Stop-loss.

ACC at the Bottom Currently ACC is @ 1798 and the bottom of the rising parallel channel.
If it breaks below and shows strength downwards, then
T1: 1570
T2: 1200
If the price doesn't break below the channel and shows strength upwards, then around 1800 could be a good buy.
ACC is currently at 1.82 CMP / BV.

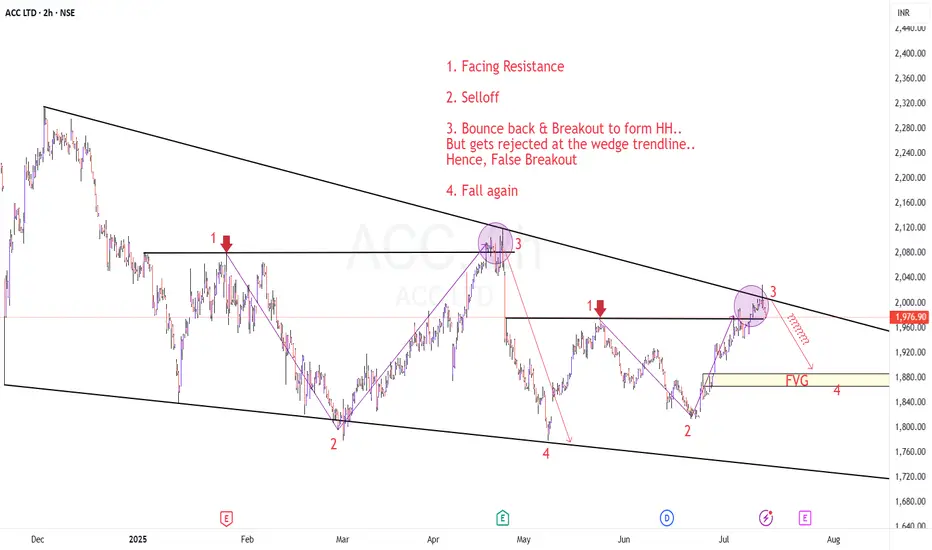
ACC - Rinse and RepeatTF: 2 hours
The pattern is explained in the chart itself.
As per DOW theory, price is making HH by breaking previous Swing Highs.. But, it faces rejection at the falling trendline (Wedge)..
Price tried to breakout from the wedge too, but failed as of now..
A retest of FVG is due at around 1880
See all ideas
Summarizing what the indicators are suggesting.
Neutral
SellBuy
Strong sellStrong buy
Strong sellSellNeutralBuyStrong buy
Neutral
SellBuy
Strong sellStrong buy
Strong sellSellNeutralBuyStrong buy
Neutral
SellBuy
Strong sellStrong buy
Strong sellSellNeutralBuyStrong buy
An aggregate view of professional's ratings.
Neutral
SellBuy
Strong sellStrong buy
Strong sellSellNeutralBuyStrong buy
Neutral
SellBuy
Strong sellStrong buy
Strong sellSellNeutralBuyStrong buy
Neutral
SellBuy
Strong sellStrong buy
Strong sellSellNeutralBuyStrong buy
Displays a symbol's price movements over previous years to identify recurring trends.
Frequently Asked Questions
The current price of ACC is 1,832.70 INR — it has increased by 0.09% in the past 24 hours. Watch ACC Limited stock price performance more closely on the chart.
Depending on the exchange, the stock ticker may vary. For instance, on BSE exchange ACC Limited stocks are traded under the ticker ACC.
ACC stock has fallen by −0.30% compared to the previous week, the month change is a −0.52% fall, over the last year ACC Limited has showed a −20.35% decrease.
We've gathered analysts' opinions on ACC Limited future price: according to them, ACC price has a max estimate of 2,550.00 INR and a min estimate of 1,670.00 INR. Watch ACC chart and read a more detailed ACC Limited stock forecast: see what analysts think of ACC Limited and suggest that you do with its stocks.
ACC stock is 1.95% volatile and has beta coefficient of 0.98. Track ACC Limited stock price on the chart and check out the list of the most volatile stocks — is ACC Limited there?
Today ACC Limited has the market capitalization of 349.15 B, it has increased by 0.61% over the last week.
Yes, you can track ACC Limited financials in yearly and quarterly reports right on TradingView.
ACC Limited is going to release the next earnings report on Oct 31, 2025. Keep track of upcoming events with our Earnings Calendar.
ACC earnings for the last quarter are 20.00 INR per share, whereas the estimation was 30.86 INR resulting in a −35.18% surprise. The estimated earnings for the next quarter are 17.75 INR per share. See more details about ACC Limited earnings.
ACC Limited revenue for the last quarter amounts to 60.70 B INR, despite the estimated figure of 57.48 B INR. In the next quarter, revenue is expected to reach 52.86 B INR.
ACC net income for the last quarter is 3.75 B INR, while the quarter before that showed 7.51 B INR of net income which accounts for −50.02% change. Track more ACC Limited financial stats to get the full picture.
Yes, ACC dividends are paid annually. The last dividend per share was 7.50 INR. As of today, Dividend Yield (TTM)% is 0.40%. Tracking ACC Limited dividends might help you take more informed decisions.
ACC Limited dividend yield was 0.39% in 2024, and payout ratio reached 5.86%. The year before the numbers were 0.30% and 6.03% correspondingly. See high-dividend stocks and find more opportunities for your portfolio.
As of Oct 17, 2025, the company has 3.17 K employees. See our rating of the largest employees — is ACC Limited on this list?
EBITDA measures a company's operating performance, its growth signifies an improvement in the efficiency of a company. ACC Limited EBITDA is 23.14 B INR, and current EBITDA margin is 10.25%. See more stats in ACC Limited financial statements.
Like other stocks, ACC shares are traded on stock exchanges, e.g. Nasdaq, Nyse, Euronext, and the easiest way to buy them is through an online stock broker. To do this, you need to open an account and follow a broker's procedures, then start trading. You can trade ACC Limited stock right from TradingView charts — choose your broker and connect to your account.
Investing in stocks requires a comprehensive research: you should carefully study all the available data, e.g. company's financials, related news, and its technical analysis. So ACC Limited technincal analysis shows the strong sell today, and its 1 week rating is strong sell. Since market conditions are prone to changes, it's worth looking a bit further into the future — according to the 1 month rating ACC Limited stock shows the sell signal. See more of ACC Limited technicals for a more comprehensive analysis.
If you're still not sure, try looking for inspiration in our curated watchlists.
If you're still not sure, try looking for inspiration in our curated watchlists.