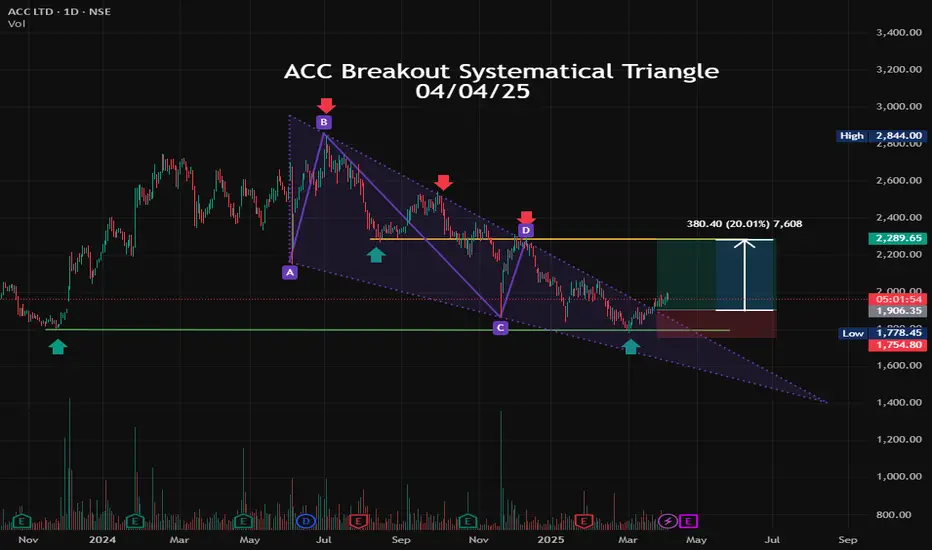
ACC Breakout Systematical Triangle 04/04/25NSE INDIA, Symbol : ACC Timeframe : Daily. ACC systematical triangle start point A) 03/06/2024 first bottom B) Point b is life time high top 2855. C) Next lower low point D) Next higher high point I was drag this point to create systematical triangle. 25/3/2025 Acc breakout the triangle line and Acc last 1 week trade above the line. ACC return pull back in good support level. systematical triangle line breakout . It will be move up side 20% no any strong resistance then recommended target is 2290
Trade ideas
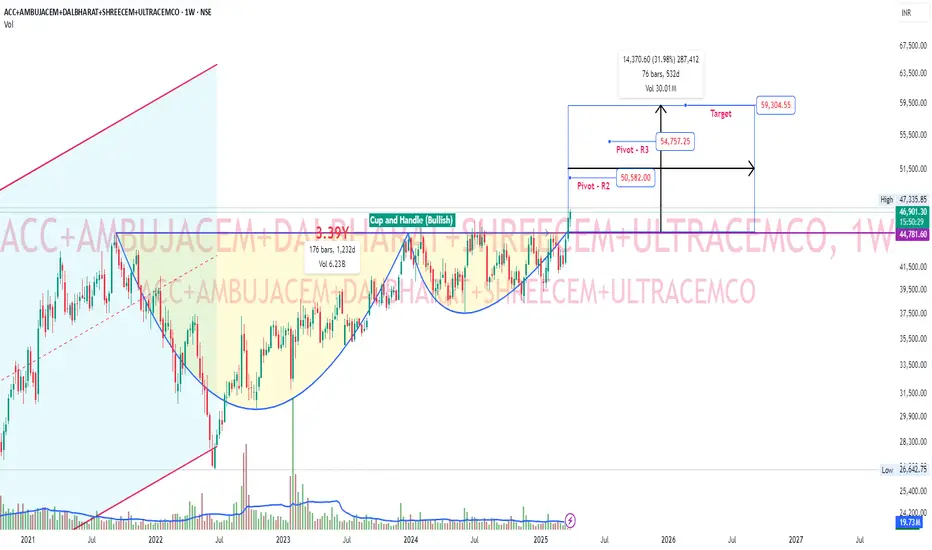
Cement - Custom Index - Cup and Handle BreakoutCreated custom index on ACC, AMBUJACEM, DALBHARAT, SHREECEM, ULTRACEMCO. Cup & handle breakout. Long buildup could also be seen on Ambuja and Shree cements. Pivot R2, R3 and target of cup is shown on chart.
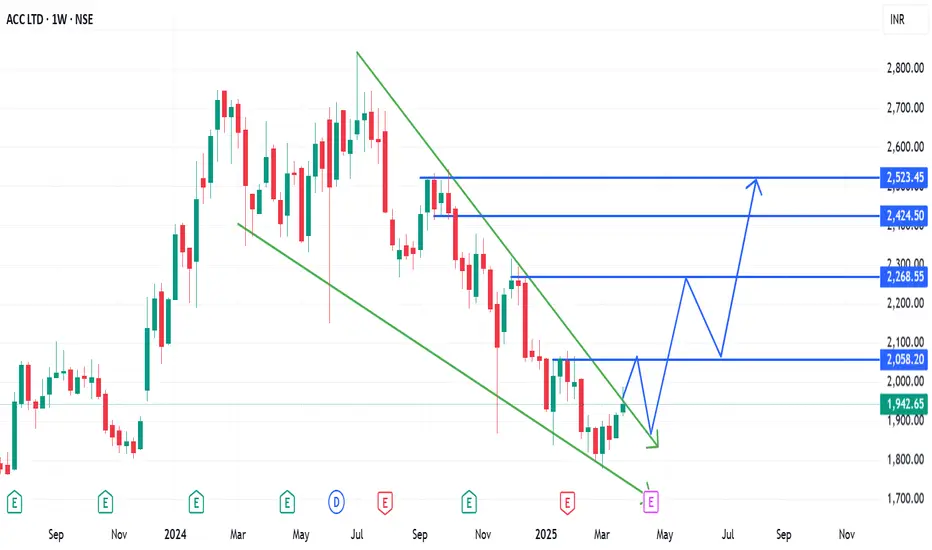
A possible trend reversal in ACC. (01/04/2025)ACC Ltd is trading in a narrow range and is in a downtrend. There are chance of a trend reversal as the indicators are predicting and the price action too seems to follow with them.
The channel break out in the stock can confirm the trend reversal. If the stock give a break out and retest, stock can be bought in cash or in F&O segment too.
Good targets can be captured in the stock as the break out after a year will be there.
Stop loss and Targets should be as per the risk to reward appetite.
Wait for the price action and trade accordingly. Patience will help in capturing the most profitable trades, otherwise losses will be eating away the capital.
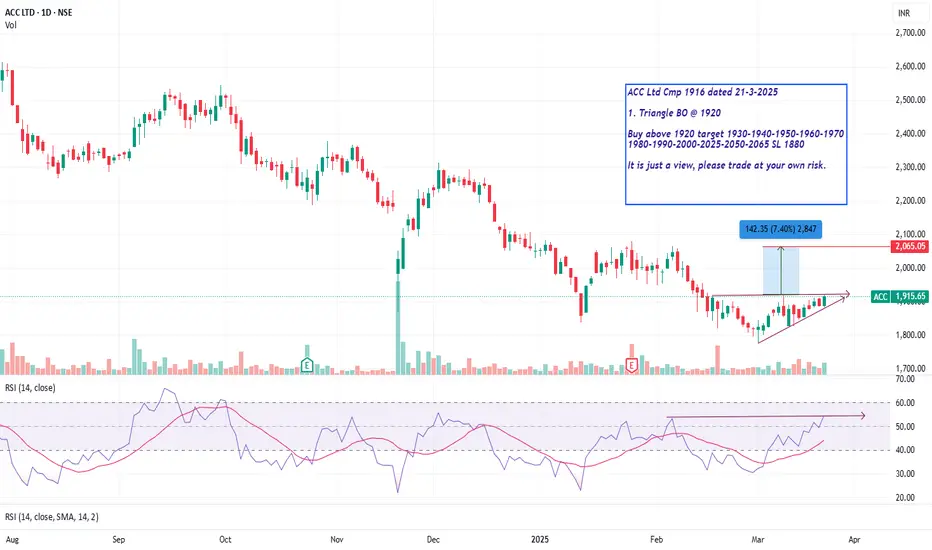
Triangle BO @ 1920 Triangle BOACC Ltd Cmp 1916 dated 21-3-2025
1. Triangle BO @ 1920
Buy above 1920 target 1930-1940-1950-1960-1970
1980-1990-2000-2025-2050-2065 SL 1880
It is just a view, please trade at your own risk.
ACC can take Long entry?ACC stock has been crossed 50 & 200 EMA levels on the hourly charts. A very high probability that stock is able to breakout from the area . A good risk to reward trade setup has been shared for learning purpose. Happy trading.

The Falling Wedge Pattern: A Guide to Catching Bullish BreakoutsFalling Wedge Pattern: A Continuation Chart Pattern
Hello Traders!
In today's post, we’ll explore the Falling Wedge Pattern , one of the most reliable continuation patterns that traders look for during uptrends. It’s an important tool for identifying potential breakout points in trending markets. If you want to learn how to trade these breakouts effectively, mastering the Falling Wedge is essential.
The Falling Wedge pattern typically forms during an uptrend and consists of converging trendlines, where the price makes lower highs and lower lows. However, despite the price being pushed lower, the momentum starts weakening, and eventually, the price breaks above the upper trendline, signaling a continuation of the prevailing uptrend .
What is the Falling Wedge Pattern?
The Falling Wedge Pattern is characterized by two converging trendlines, where the upper trendline slopes downward more steeply than the lower trendline. This pattern shows a decreasing range between highs and lows, and when the price breaks above the upper trendline, it indicates a continuation of the uptrend .
Key Characteristics of the Falling Wedge Pattern
Uptrend Prior to the Pattern: The Falling Wedge pattern forms during a strong uptrend , signaling that the market is taking a brief pause before resuming the previous momentum.
Converging Trendlines: The pattern consists of two downward-sloping trendlines that converge, with the upper trendline steeper than the lower one. This shows that the selling pressure is weakening.
Breakout Confirmation: A bullish breakout occurs when the price breaks above the upper trendline, signaling the continuation of the uptrend .
Volume Increase on Breakout: The breakout is confirmed when there is an increase in volume, indicating strong momentum behind the move.
How to Trade the Falling Wedge Pattern?
Entry Point: The ideal entry point is when the price breaks above the upper trendline, confirming the bullish breakout .
Stop Loss: Place your stop loss just below the lower trendline or the most recent swing low to protect your trade from sudden market reversals.
Profit Target: Measure the height of the wedge and project that distance upward from the breakout point to determine the price target .
Risk Management Considerations
Position Sizing: Adjust your position size based on your risk tolerance and the distance between the entry point and the stop loss.
Stop Loss Placement: Make sure to place your stop loss in a way that minimizes risk but still gives enough room for the trade to move in your favor.
Wait for Confirmation: Always wait for the breakout confirmation, and make sure that the price action is supported by an increase in volume.
What This Means for Traders
The Falling Wedge pattern is an excellent tool for traders who are looking for reliable continuation trades in strong uptrends. It can help identify breakout points and offer favorable risk-to-reward setups when combined with other technical indicators.
Look for the Falling Wedge pattern during uptrends to identify high-probability continuation trades.
Confirm with volume to ensure the breakout is backed by strong momentum.
Use stop loss placement to manage risk effectively while targeting favorable risk-to-reward ratios.
Conclusion
The Falling Wedge pattern is a reliable continuation pattern that can help traders identify breakout opportunities in trending markets. By mastering its formation, waiting for the breakout confirmation, and managing risk effectively, you can increase the chances of a successful trade in the uptrend .
Have you traded the Falling Wedge pattern before?
Share your experiences and thoughts in the comments below! Let’s continue learning and growing as traders!

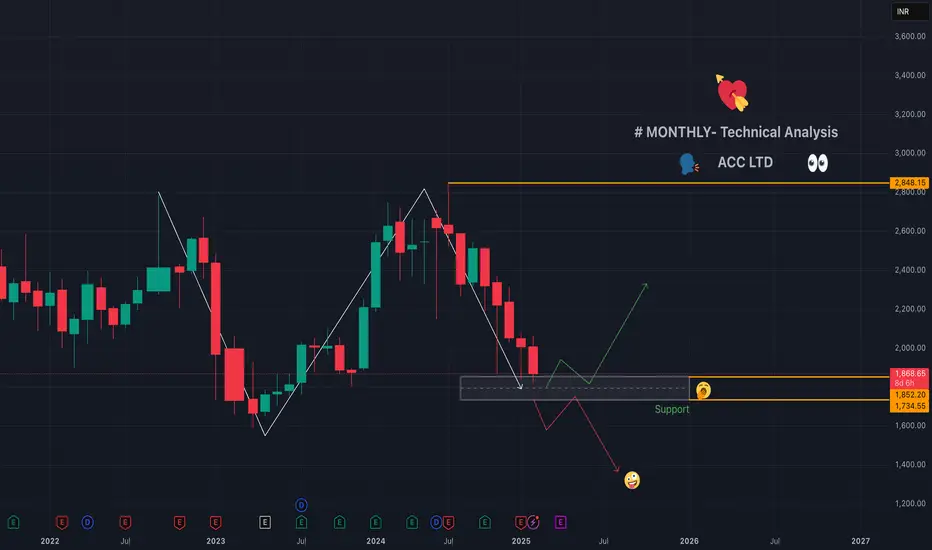
ACC LTD - Technical - Monthly Chart😍❣️#ACC Limited, founded in 1936 as Associated Cement Companies Limited, is one of India’s oldest and most prominent cement manufacturers. Headquartered in Mumbai, it became a subsidiary of the #AdaniGroup in September 2022 💕😍
📉Chart for your reference
ACC superb RR for BULLSThese are not to miss spots #ACC
Range break shown and Stop losses taken of any one bullish earlier.
These undercuts are zones where smart money enters. UPSIDE OPEN, with max 3% risk from here

ACC Ltd | Bullish Reversal Setup with Strong ConfluenceOverview:
This idea highlights a potential bullish reversal setup for ACC Ltd (NSE) based on technical confluences observed in the daily time frame. The stock is currently approaching a key Demand Zone and is showing signs of a potential breakout.
Key Observations:
Demand Zone / Order Block:
The green zone (₹1,900–₹2,050) marks a significant demand area where price is expected to find strong buying support. This is aligned with the previous consolidation period and order block theory.
Price Retest:
The price is retesting this demand zone, creating a potential low-risk entry point for buyers.
Change of Character (CoCh):
A structural shift is evident, with a "W" pattern forming. This pattern indicates accumulation and potential reversal from bearish to bullish momentum.
RSI Divergence (1H Time Frame):
Bullish RSI divergence is visible in lower time frames, confirming weakening bearish momentum and possible price reversal.
Price Imbalance Filled:
The imbalance area has been fully resolved, reducing downward pressure. This increases the likelihood of a bounce from the demand zone.
Descending Channel:
The stock is currently trading within a descending channel. A breakout above the upper boundary of the channel could signal a continuation of the bullish move.
Projected Scenarios:
Bullish Scenario:
If the price holds the demand zone and breaks out above the descending channel, potential targets are:
Target 1 : ₹2,400 (near-term resistance).
Target 2 : ₹2,800 (upper trendline resistance).
Target 3 : ₹3,000+ (long-term resistance zone).
Bearish Scenario:
If the price fails to hold the demand zone, it could revisit the lower levels near ₹1,800 or ₹1,700 for another accumulation phase.
Trade Setup:
Entry : ₹1,950–₹2,050 (Demand Zone).
Stop-Loss : ₹1,890 (below the demand zone).
Targets:
T1: ₹2,400
T2: ₹2,800
T3: ₹3,000
Risk-Reward Ratio : 1:3 or better.
Confluence Factors:
Strong support at the demand zone.
Bullish RSI divergence in lower time frames.
Structural breakout potential (CoCh and "W" pattern).
Full price imbalance resolved, reducing selling pressure.

ACC expecting wave E up for triangle formation ACC expecting wave E up for triangle formation
moving inside the channel and if breaks and gives a strong closing above
middle line of the channel than expecting to move p.
it has support zone 2220-2150
and today it bounced from the support zone and done wave D
and now expecting it to move for wave E formation
towards 2340--2375 in short term.
Disclaimer : I am not SEBI registered.

ACCSL 1Hr candle close only, Target Trigger Price
All detail for chat. good entry at mark price only. and must stoploss minimum risk and good profit. risk ratio 1:1 to manage modified SL. This is not call, Just my idea. Please understand your risk and take full responsibility of your actions

ACC for Mid TermAs per Liquidation & Demand supply i have marked those zones , we can use price action bars at these areas for confirmation. Just a View not a Reco...

FNO Trading People who trade Equity Derivatives, can take advantage of Small Patterns unfolding Methods
these patterns unfold on regular basis which behave in repeating manner as per diagram shown
so one has to wait for proper set up to form below the inclined trend line before taking
a trade in Derivatives
This is educational content
if you have any Questions please feel free to ask me
Thanks

Cement in focusACC CMP 2511
I am pretty bullish on the cement sector as a whole. If ur interested in large caps, then this stock is still a good buy. Fib analysis is indicating tremendous strength. The trendlines are clearly showing, that the stock will attain new heights post breakout.

ACC Cement Swing Long Setup - ACC Cement is currently trading at 2506
- ACC has moved up fair from my call out and now looks all set to move higher
- But before turning extremely bullish make sure to factor in a conservative entry
- We can see ACC approaching or retracing back to 2400-2420
- Timing and Location is everything when it comes to swings
- Manage risk properly and just make sure that your location is conservative

ACC Support & Resistance levelsSupport and resistance levels: Key price points
where the stock tends to bounce or face selling
pressure.
Trend lines: To identify the overall direction of the
stock over the medium term.
Moving averages: Such as 50-period and 200-
period moving averages on the 4h timeframe.
Technical indicators: RSI, MACD, or other
indicators that traders use for analysis.
Chart patterns: Any recognizable patterns forming
over multiple 4-hour

ACC Swing Long Setup - ACC is currently Trading at 2429
- Acc is setting up quite nicely to purge higher
- ACC can be added around 2381-2407 that's where my interest lies in order to look for swing longs in it
- Acc has a decent setup overall the invalidation of this trade would be under the Bullish Orderblock


Acc Bullish viewstrong support at 2300
Rsi divergence
and Macd cross
1st Target- 2400
T2 - 2450
T3 - 2500

ACC is ready for upmove as per daily&hrly chartACC is ready for upmove as per daily and hrly charts. Also at strong support zone..@2350.

#ACCACC Bullish Bat harmonic pattern will be active at D point
Sharing this idea for educational purpose only
Reversal prediction is easy in Harmonics technical analysis

ACCDate 14.08.2024
ACC
Timeframe : day chart
Remarks:
If breaks the trendline then further downside, already broke 200 ema & major support zone of 2371
Regards,
Ankur

ACCACC is in downtrend
Please consult with your financial advisor before investing
Sharing only for educational purpose
According to BAT Bullish pattern D point is the reversal predicated according to harmonics patterns
