Long action constrctionACTION CONSTRUCTION
BUY
TGT 248/255/260
KEEP
SL 226 intraday basis.
only for paper trading!
ACE trade ideas


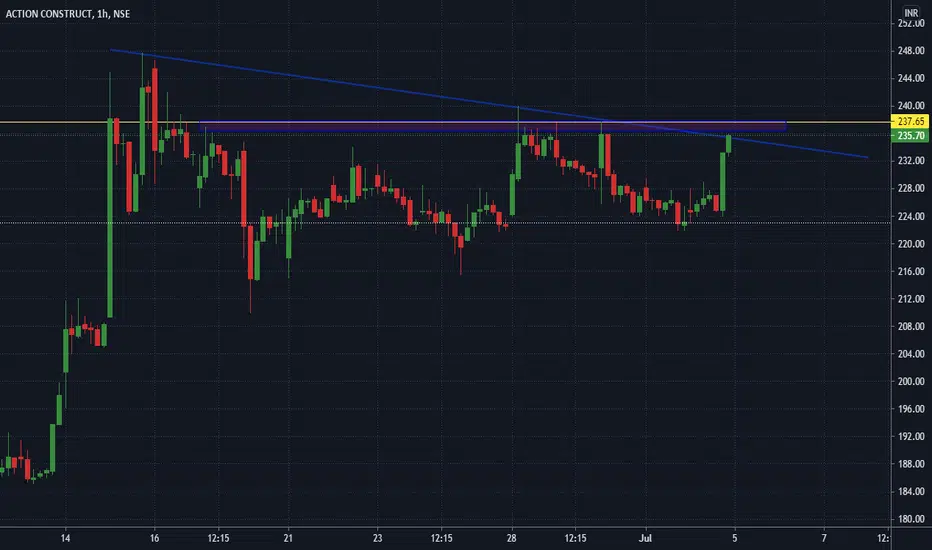
Watchout for Resistance breakoutThe stock looks good above 240 (closing basis) for 5-7% further upmove positionally.

ACE
The stock itself take support on the predefined support line and started to go up big green candle, so we can take long position there.
Profit Target and Stoploss is mentioned above the pic

Education Action const. equip Ltd. On Dailly candle this may form double bottom at the same time having RSI bullish Diversions too. According to my anylysis AT CMP 217.95 this is good for short term target 275


ACE - Next MiltibaggerACE is consolidating and now ready for next big breakout. I have one lot at 192 and now, it is time to add next lot. Take your own decision.

Action in Full on ActionACE CMP - 258
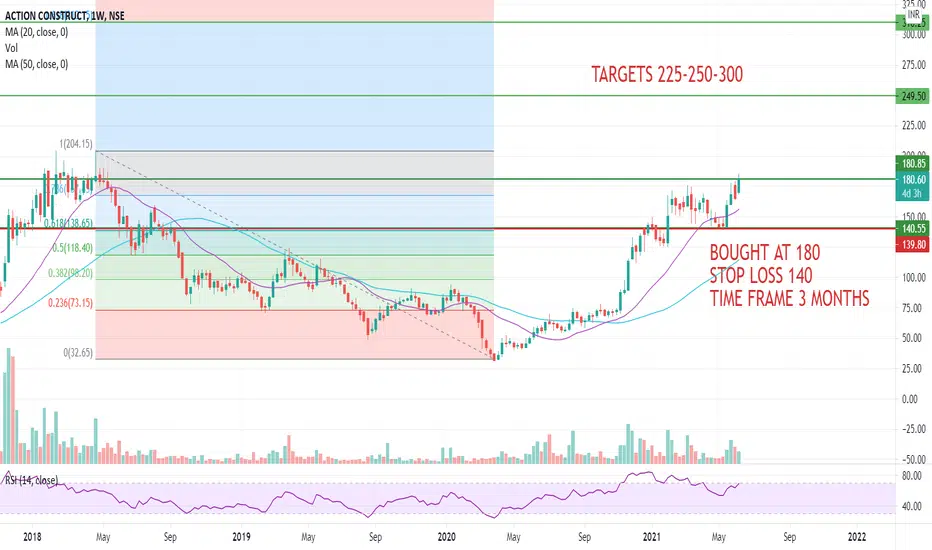
Short term Target - 280-300 (1M-6M)
Long term target - 400-450 (1Y+)


ACE #StockMarket #StockIdeas #StocktoWatch #StockToBuyACE- ACTION CONSTRUCTION EQUIPMENT
TOO GOOD COMPANY FOR LONG TERM HOLDING
MY FAV PORTFOLIO STOCK
------------------------------------------------------
COMPANY INVOLVES IN MANUFACTURING OF CRANES AND OTHER HANDLING EQUIPMENT
WITH INDIA ECONOMY GROWTH THIS COMPANY ALSO GROW
-----------------------------------------------------
NOW BULLISH FLAG BREAKOUT ON DAILY CHART
ALSO SUPPORT FROM 20MA
ONE CAN ENTER AT CMP OR AFTER SLIGHT RETRACEMENT
FOR A MINIMUM FIRST TARGET OF 310
SL WILL BE AROUND 230 OR 20MA ON DAILY BASIS FOR SHORT TERM SWING TRADE
---------------------------------------------------
THIS IS A FUNDAMENTALLY STRONG COMPANY
CAN HOLD FOR LONG TERM ALSO
--------------------------------------------------
STRICT SL TO BE FOLLOWED IN EVERY TRADE


I booked 10% Profit on it ✌✌✌This scrip was posted I this platform last week and so far it made high of 10% returns. I hope our followers had benefited from this post. Kindly like and share it to your friends and needy people. Thanks to all.


ACE (swing trade) day time frameSymmetrical triangle forming in the chart , bullish variant . Can enter now with target of 250.


Triangle Pattern - Expecting Breakout ✌This scrip is expected to give breakout in the coming days as it has formed triangle pattern. So traders keep on your radar to catch the momentum. Kindly like and share it to all your friends and needy people. Thanks to all.


ACE: Nearing Breakout NSE:ACE
Levels mentioned in Chart.
Note: Not a SEBI Registered analyst.
Trade at your own discretion.

ACE - Soon will Break the TriangleKeep an Eye, Soon it will Break the Triangle, My Short Trem Target is 250 and 01 Year Target is 325-350.

Multi Year Breakout - Cup & Handle Base FormationPositional & Investment Pick.
Keep Accumulating for suggested targets. Good quarterly numbers. Excellent Future Prospects. Huge Potential Upside
