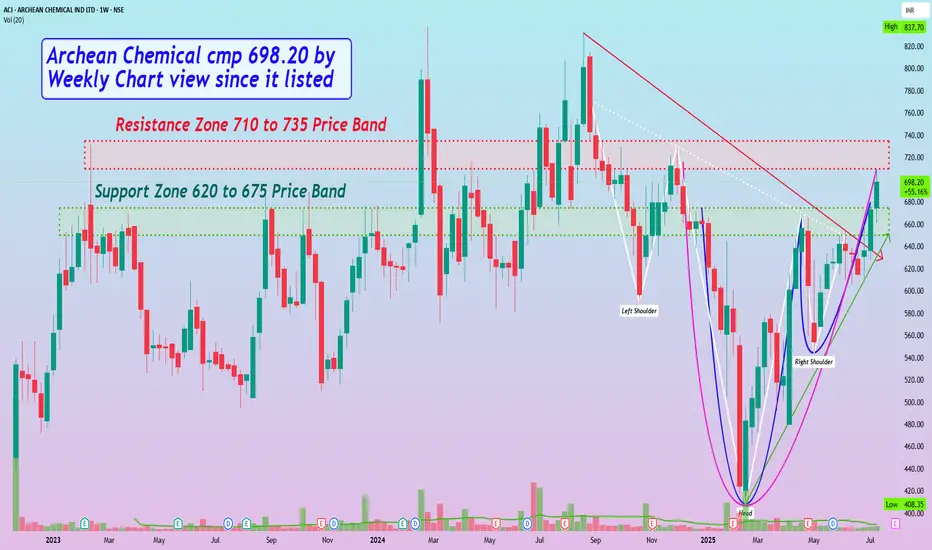
Archean Chemical cmp 698.20 by Weekly Chart view since it listedArchean Chemical cmp 698.20 by Weekly Chart view since it listed
- Support Zone 620 to 675 Price Band
- Resistance Zone 710 to 735 Price Band
- Volumes flattish, need to increase for Resistance Zone Breakout
- Bullish Rounding Bottom inclusive of Cup & Handle pattern completed
- A logically consid
ARCHEAN CHEMICAL INDUSTRIES LI
673.45INRD
−8.05−1.18%
At close at Jul 25, 11:09 GMT
INR
No trades
Next report date
Today
Report period
Q1 2025
EPS estimate
5.90 INR
Revenue estimate
3.43 B INR
13.15 INR
1.62 B INR
10.40 B INR
42.58 M
About ARCHEAN CHEMICAL IND LTD
Sector
Industry
CEO
Ranjit Pendurthi
Website
Headquarters
Chennai
Founded
2009
ISIN
INE128X01021
FIGI
BBG01BD78XR4
Archean Chemical Industries Ltd. produces sulphate of potash, gypsum, bromine, and several industrial chemicals through conversion of naturally available marine mineral deposits. Its products includes Bromine, Sulphate of Potash and Industrial Salt The company was founded on July 14, 2009 and is headquartered in Chennai, India.
6.5%
10.5%
14.5%
18.5%
22.5%
Q4 '23
Q1 '24
Q2 '24
Q3 '24
Q4 '24
0.00
900.00 M
1.80 B
2.70 B
3.60 B
Revenue
Net income
Net margin %
Revenue
COGS
Gross profit
Op expenses
Op income
Non-Op income/ expenses
Taxes & Other
Net income
0.00
900.00 M
1.80 B
2.70 B
3.60 B
Revenue
COGS
Gross profit
Expenses & adjustments
Net income
0.00
900.00 M
1.80 B
2.70 B
3.60 B
Q4 '23
Q1 '24
Q2 '24
Q3 '24
Q4 '24
0.00
600.00 M
1.20 B
1.80 B
2.40 B
Debt
Free cash flow
Cash & equivalents
No news here
Looks like there's nothing to report right now
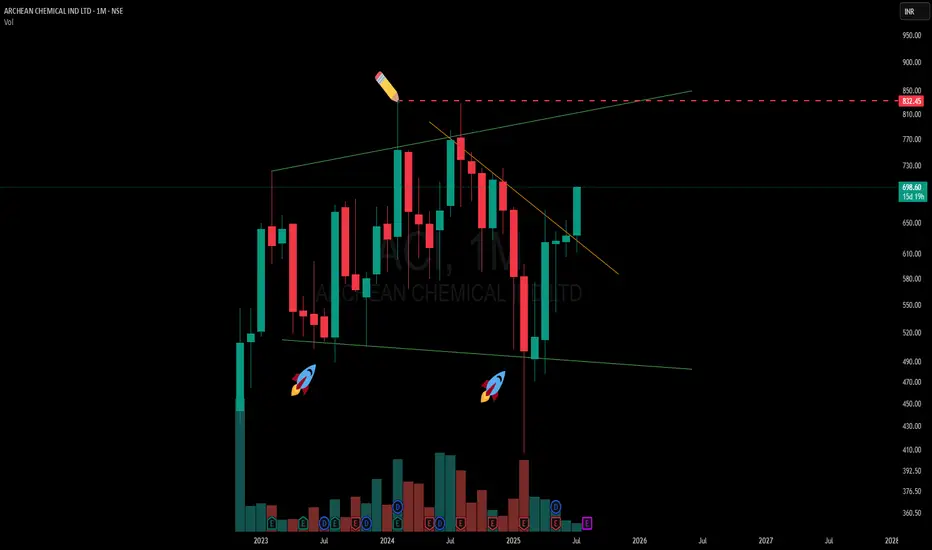
Archean Chemical – Broadening pattern and the CT ? 🟢A classic case of a broadening formation playing out on the higher timeframe (MTF). The green lines represent the broadening range, with price recently respecting the lower boundary — evident from the two support touches marked with 🚀 icons, each forming slightly lower lows before rebounding.
🟢 Th
ACI - Bullish with Inverted head and Shoulder patternACI - Bullish with Inverted head and Shoulder pattern
Fundamental Outlook
Almost debt free D/E ratio is 0.02, High ICR
PE of 36.59, IND PE is 30.44, Slightly expensive.
PEG of 0.83, attractive and hence high PE
ROE = 19.45%
ROCE = 25.75% , ROCE 5yrs = 29.26%
Sales growth = -31.72%, Sales Growt
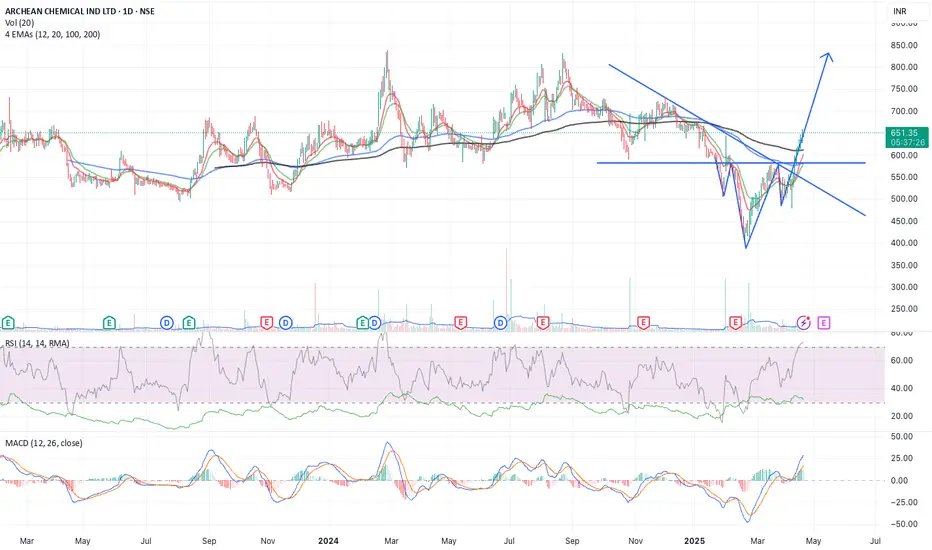
Archean Chemical - Chart of the WeekNSE:ACI has a beautiful structure in the Weekly Timeframe that qualifies for my Chart of the Week idea. It saw Decent Volumes this week and closed above its recent swing high, with RSI and MACD Trending Upwards and Closing Above all Major Short moving Averages, breaking the Trendline.
About:
NS

ACI - Double Bottom (Bullish)Archean chemical industries is a leading specialty marine chemical manufacturer in India focused on producing and exporting bromine, industrial salt, and sulphate of potash across the world. Archean is the largest exporter of bromine and industrial salt in India and has amongst the lowest cost of pr

[Mixed Signals] Archean Chemical Industries - What's your view? Archean Chemical Industries Ltd. What's your view?
Fundamentals
MCAP- 7400 Cr
PE - 27.86 < Industry PE of 32.2, Moderately priced
PEG Ratio is 0.64, excellent
Debt to Equity is 0.02 and ICR is 42
ROE is 19.45%, ROCE is 25.75% ( 5yr ROCE is 29.26%)
Sales growth is -17%, 5yr Sales growth is 18%


See all ideas
Summarizing what the indicators are suggesting.
Neutral
SellBuy
Strong sellStrong buy
Strong sellSellNeutralBuyStrong buy
Neutral
SellBuy
Strong sellStrong buy
Strong sellSellNeutralBuyStrong buy
Neutral
SellBuy
Strong sellStrong buy
Strong sellSellNeutralBuyStrong buy
An aggregate view of professional's ratings.
Neutral
SellBuy
Strong sellStrong buy
Strong sellSellNeutralBuyStrong buy
Neutral
SellBuy
Strong sellStrong buy
Strong sellSellNeutralBuyStrong buy
Neutral
SellBuy
Strong sellStrong buy
Strong sellSellNeutralBuyStrong buy
Displays a symbol's price movements over previous years to identify recurring trends.
Frequently Asked Questions
The current price of ACI is 673.45 INR — it has decreased by −1.18% in the past 24 hours. Watch ARCHEAN CHEMICAL INDUSTRIES LI stock price performance more closely on the chart.
Depending on the exchange, the stock ticker may vary. For instance, on BSE exchange ARCHEAN CHEMICAL INDUSTRIES LI stocks are traded under the ticker ACI.
ACI stock has fallen by −2.50% compared to the previous week, the month change is a 9.38% rise, over the last year ARCHEAN CHEMICAL INDUSTRIES LI has showed a −8.22% decrease.
We've gathered analysts' opinions on ARCHEAN CHEMICAL INDUSTRIES LI future price: according to them, ACI price has a max estimate of 750.00 INR and a min estimate of 585.00 INR. Watch ACI chart and read a more detailed ARCHEAN CHEMICAL INDUSTRIES LI stock forecast: see what analysts think of ARCHEAN CHEMICAL INDUSTRIES LI and suggest that you do with its stocks.
ACI stock is 4.52% volatile and has beta coefficient of 0.69. Track ARCHEAN CHEMICAL INDUSTRIES LI stock price on the chart and check out the list of the most volatile stocks — is ARCHEAN CHEMICAL INDUSTRIES LI there?
Today ARCHEAN CHEMICAL INDUSTRIES LI has the market capitalization of 83.12 B, it has increased by 3.95% over the last week.
Yes, you can track ARCHEAN CHEMICAL INDUSTRIES LI financials in yearly and quarterly reports right on TradingView.
ARCHEAN CHEMICAL INDUSTRIES LI is going to release the next earnings report on Jul 28, 2025. Keep track of upcoming events with our Earnings Calendar.
ACI earnings for the last quarter are 4.35 INR per share, whereas the estimation was 7.10 INR resulting in a −38.73% surprise. The estimated earnings for the next quarter are 5.90 INR per share. See more details about ARCHEAN CHEMICAL INDUSTRIES LI earnings.
ARCHEAN CHEMICAL INDUSTRIES LI revenue for the last quarter amounts to 3.46 B INR, despite the estimated figure of 3.28 B INR. In the next quarter, revenue is expected to reach 3.43 B INR.
ACI net income for the last quarter is 535.39 M INR, while the quarter before that showed 479.71 M INR of net income which accounts for 11.61% change. Track more ARCHEAN CHEMICAL INDUSTRIES LI financial stats to get the full picture.
Yes, ACI dividends are paid annually. The last dividend per share was 3.00 INR. As of today, Dividend Yield (TTM)% is 0.45%. Tracking ARCHEAN CHEMICAL INDUSTRIES LI dividends might help you take more informed decisions.
ARCHEAN CHEMICAL INDUSTRIES LI dividend yield was 0.58% in 2024, and payout ratio reached 22.83%. The year before the numbers were 0.45% and 11.58% correspondingly. See high-dividend stocks and find more opportunities for your portfolio.
As of Jul 28, 2025, the company has 707 employees. See our rating of the largest employees — is ARCHEAN CHEMICAL INDUSTRIES LI on this list?
EBITDA measures a company's operating performance, its growth signifies an improvement in the efficiency of a company. ARCHEAN CHEMICAL INDUSTRIES LI EBITDA is 3.14 B INR, and current EBITDA margin is 31.69%. See more stats in ARCHEAN CHEMICAL INDUSTRIES LI financial statements.
Like other stocks, ACI shares are traded on stock exchanges, e.g. Nasdaq, Nyse, Euronext, and the easiest way to buy them is through an online stock broker. To do this, you need to open an account and follow a broker's procedures, then start trading. You can trade ARCHEAN CHEMICAL INDUSTRIES LI stock right from TradingView charts — choose your broker and connect to your account.
Investing in stocks requires a comprehensive research: you should carefully study all the available data, e.g. company's financials, related news, and its technical analysis. So ARCHEAN CHEMICAL INDUSTRIES LI technincal analysis shows the buy rating today, and its 1 week rating is buy. Since market conditions are prone to changes, it's worth looking a bit further into the future — according to the 1 month rating ARCHEAN CHEMICAL INDUSTRIES LI stock shows the strong buy signal. See more of ARCHEAN CHEMICAL INDUSTRIES LI technicals for a more comprehensive analysis.
If you're still not sure, try looking for inspiration in our curated watchlists.
If you're still not sure, try looking for inspiration in our curated watchlists.