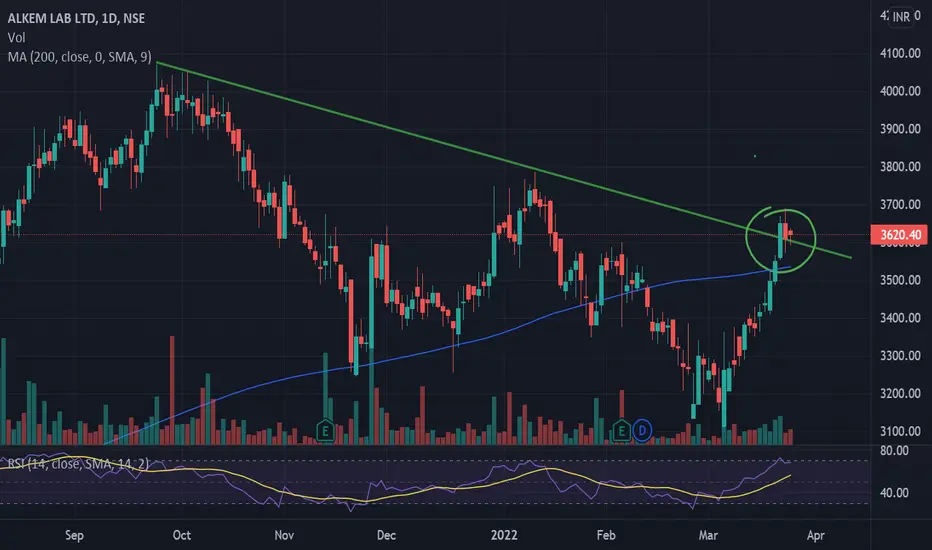
Alkem for swing trade (Read description properly)Alkem swing trade:-
1.As you can see rounding bottom has formed and it is about to give trendline breakout (wait for proper breakout) but on 09 sep you will notice selling came from upper level and it is little streched if you see past days back to back green candles.
2.So plan to buy either on pullback or retracement from 3265 or if it gives bounce from trendline after retesting it.
3.Keep your 1st target-3600 then between 3680 -3700.
Hope you liked this. And do give me suggestion or feedback if u liked this or not.
#keep it simple.
disclaimer: this is not buying selling recommendation its only for educational purpose.
ALKEM trade ideas

Alkem Pharma Buy for a target of 3327Sentiment: Bullish
From these levels the stock can show the targets of 3327
Analysis:
1. Bollinger Bands are squeezed and the breakout of the upper band.
2. Rsi is above 60.
3. Macd is bullish crossover.

Shorting Opportunity This scrip is expected to give break down in the coming days. So traders keep on your radar to catch the momentum. Thanks to all 🙏🙏🙏

Falling wedge pattern in ALKEM.Discription:
Stock Name: ALKEM
Chart Pattern: Falling wedge pattern
Time Frame: 1 Hour
Breakout Entry : above 2930+
Breakout target : 3056+

Alkem (charts always gives advance notice)Crucial support 2943. June Qtr OPM is lowest in many years, fell from 22% last year same time to 8%.They may be facing big competition in the product category/higher operating cost. Just for information no reco.

ALKEM Short SellALKEM gave a Weekly Breakdown @ Rs. 3000 with good volumes, Retesting can be seen again around Rs.3000, which gives an opportunity to short between Rs.3000-3040. ALKEM might give immediate Target of Rs 2800 either by Gap Down or as per setup.
Disclaimer: I am not a SEBI Registered Analyst, the views declared are of my own and for educational purposes only. Kindly consult your financial advisor before investing.

[POSITIONAL] ALKEM LONG BET risk: Reward ratio is 1: 2
Rest as per Charts
********
Note -
One of the best forms of Price Action is to not try to predict at all. Instead of that, ACT on the price. So, this chart tells “where” to act in “what direction. Unless it triggers, like, let’s say the candle doesn’t break the level which says “Buy/Sell if it breaks”, You should not buy/sell at all.
=======
I use shorthands for my trades.
“Positional” - means You can carry these positions and I do not see sharp volatility ahead.
“Intraday” -means You must close this position at any cost by the end of the day.
=======
Always follow a stop loss.
In the case of Intraday trades, it is mostly the “Low/High of the Candle”.
In the case of Positional trades, it is mostly the previous swings
********

ALKEM: Go LongALKEM: Gearing for Jump. Ascending Triangle pattern visible.
Buy above 3205
T1: 3272 & T2 3302
Intraday: Trailing SL
Note: Consult your financial advisor before taking any Traders.
Follow Risk Management

Sell Alkem LabWeekly Inverted Candle with Trend Line Broken so its confirm for sell
Weekly MACD down from this candle
Daily Stochestic Down from this candle
Big Bearish Candle form on Daily Time frame
Daily time frame volume is ok
EMA combination also confirom
0.038 retracement


alkem lab shortwedge breakdown short till the next swing low
indian pharma companies facing pricing pressure
despite great quarterly results from the CDMO business Alkem Labs showing bearish price
the reason for the trade the recent breakdown had tremendous strength in it

Breakdown in Alkem Laboratories...Chart is self explanatory. Entry, Targets and Stop Loss are mentioned on the chart.
Disclaimer: This is for demonstration and educational purpose only. This is not buying or selling recommendations. I am not SEBI registered. Please consult your financial advisor before taking any trade.

Alkem Chart Analysis !! 📈 Alkem Lab Ltd. 📉
Today broke out from a Resistance Zone after testing two times and also broke out from a downtrending Trendline Zone on closing basis.
On Buy Side I am looking for Targets of 3750-3800 zone followed by 4000-4050 zone.
StopLoss should be kept in 3375-3425 zone.
It offers 1:4 Risk To Reward.
All Important Supports and Resistances are drawn in chart. All levels are on closing basis.
Please have a look and revert back if you need some more study on it.
Disclaimer : Consult Your Financial Advisor Before Taking Any Decision On This Analysis.

Perfect Breakout on daily chartA clear breakout
Supported by high volume.
A minor correction after a breakout
good time to buy.
Rounding bottom Pattern ALKEM in 1 hour ChartRounding Bottom pattern Alkem and target mentioned in the chart. purely technical call. Please do your research before investing.

ALKEM LAB BULLISH BREAKOUTALKEM LAB LTD
Bullish Breakout
Bullish Divergence
Crossed 200 EMA after Long period of Time.
One can go long at 3500 level.
SL 3350 Or 200 EMA.

ALKEM - Retest & Reversal + Bullish Engulfing @Crucial level The analysis is done on weekly TF hence price may take few weeks to few months in order to reach the targets.
Trade setup is explained in image itself.
The above analysis is purely for educational purpose. Traders must do their own study & follow risk management before entering into any trade
Checkout my other ideas to understand how one can earn from stock markets with simple trade setups. Feel Free to comment below this or connect with me for any query or suggestion regarding this stock or Price Action Analysis.

Positional or Longterm Opportunity in Alkem LabGo Long above 3389.9 for Targets of 3671.95, and 3954 with SL 3107.85
Reasons to go Long :
1. On a Weekly timeframe if we draw the Fibonacci retracement tool from recent swing low (point A) to recent swing high (point B) then we see stock took support from 0.382 Fibonacci level.
2. In addition to this a bullish candlestick pattern Bullish Engulfing (marked with orange color) is formed around 0.382 Fibonacci level.
3. In addition to this there is a strong demand zone (marked with purple color), from which the stock initially faced resistance but now is taking support and moving up.

#ALKEM#ALKEM
CMP - 3176
Harmonic Pattern
Disclaimer : We are not Sebi registered analyst or Authorized analyst
The charts / Levels / Price projections are only for educational purpose.
This is our personal view, Pls consult your financial advisor before taking decision - Buy / Sell
We will be not responsible for your profit and Loss

ALKEM Trade Setup For TomorrowALKEM Formed Descending Triangle Pattern wait for proper breakout and retest and based on that, one can look for entries.
Please HIT the like button, this motivates us to make more such analysis.
For more such trading content follow us on ( @tradechefofficial )


ALKEM LAB MAY MOVE either wayAlkem Lab
Following beautiful Descending Channel Pattern
In between Symmetrical triangle Pattern is also emerging.
Can Go both Way after B/O or B/D
keep close watch
good for learning purpose
mcpricaction
