Stock Analysis: Asm technologies ASM Technologies Ltd.- technical chart and fundamentals for student learnings.
Technical & Chart Pattern Analysis (Weekly Chart)
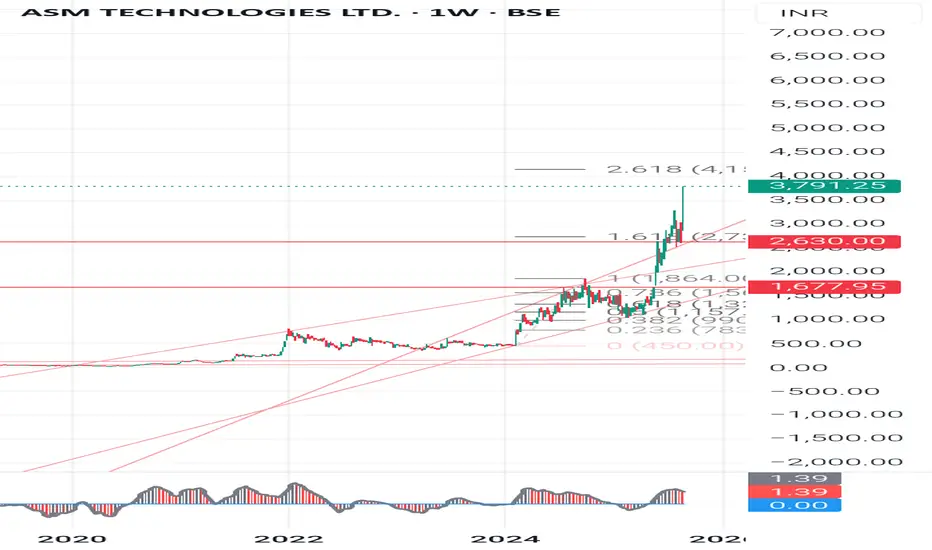
Current Price (CMP): 1,520
Recent Move: Sharp rally from -500 in mid-2024 to a peak of -3,800 (multi-bagger move within months).
Chart Pattern Observations
1. Paraboli
ASM Technologies Ltd
No trades
45.10 INR
262.25 M INR
2.89 B INR
3.67 M
About ASM Technologies Ltd
Sector
Industry
CEO
Rabindra Srikantan
Website
Headquarters
Bangalore
Founded
1992
IPO date
Jan 24, 1995
Identifiers
2
ISIN INE867C01010
ASM Technologies Ltd. engages in the provision of services in business systems, engineering services, information technology infrastructure services, and technology solutions. Its services include product life cycle, Internet of things, virtual reality applications, Open edX, organic light emitting diodes, and sustenance engineering. The firm operates through the Export Sales and Domestic Sales segments. The company was founded by Rabindra Srikantan on August 10, 1992 and is headquartered in Bangalore, India.
Related stocks
ASMTEC LongDate : 24-02-2024
Buy ASMTEC above 1113
Target of 1508
SL 800
Strategy : SBO + RSI > 60 + EMA above 20 & 50
Duration few weeks
Please consult your financial advisor before investing
All research for educational purposes only.

ASM TECH | TARGET OF 25%+About ASM Tech:
1. ASM Tech is a global technology company with expertise in semiconductor manufacturing and packaging solutions.
2. The company specializes in advanced packaging, assembly, and test services for semiconductor devices.
3. ASM Tech plays a significant role in the semiconductor indu

ASMTEC's Chart: Breakout, RetestIn this analysis, we will explore the chart of ASMTEC, focusing on the recent breakout of the falling trendline, the subsequent retest, and the stock's current positioning above horizontal support. Additionally, we will examine key fundamental data of the company. By considering these technical and

ASMTEC Breakout or Break Down ???BSE:ASMTEC
Cmp : 705
Consolidation
Stock will give a breakout or breakdown... Take an entry after confirmation.
#Study

ASM TECH SWINGASM Tech forming channel break out.
Entry after retest at given level.
Target 7-10 percent short term


Buy on Deeps or at current price i am expecting good upside Many stock with such chart have given good upside

See all ideas
Summarizing what the indicators are suggesting.
Oscillators
Neutral
SellBuy
Strong sellStrong buy
Strong sellSellNeutralBuyStrong buy
Oscillators
Neutral
SellBuy
Strong sellStrong buy
Strong sellSellNeutralBuyStrong buy
Summary
Neutral
SellBuy
Strong sellStrong buy
Strong sellSellNeutralBuyStrong buy
Summary
Neutral
SellBuy
Strong sellStrong buy
Strong sellSellNeutralBuyStrong buy
Summary
Neutral
SellBuy
Strong sellStrong buy
Strong sellSellNeutralBuyStrong buy
Moving Averages
Neutral
SellBuy
Strong sellStrong buy
Strong sellSellNeutralBuyStrong buy
Moving Averages
Neutral
SellBuy
Strong sellStrong buy
Strong sellSellNeutralBuyStrong buy
Displays a symbol's price movements over previous years to identify recurring trends.
Frequently Asked Questions
The current price of ASMTEC is 2,539.10 INR — it has increased by 0.53% in the past 24 hours. Watch ASM Technologies Ltd stock price performance more closely on the chart.
Depending on the exchange, the stock ticker may vary. For instance, on BSE exchange ASM Technologies Ltd stocks are traded under the ticker ASMTEC.
ASMTEC stock has fallen by −13.87% compared to the previous week, the month change is a −19.17% fall, over the last year ASM Technologies Ltd has showed a 104.77% increase.
ASMTEC reached its all-time high on Sep 23, 2025 with the price of 4,595.55 INR, and its all-time low was 1.60 INR and was reached on Dec 2, 2003. View more price dynamics on ASMTEC chart.
See other stocks reaching their highest and lowest prices.
See other stocks reaching their highest and lowest prices.
ASMTEC stock is 3.83% volatile and has beta coefficient of 0.27. Track ASM Technologies Ltd stock price on the chart and check out the list of the most volatile stocks — is ASM Technologies Ltd there?
Today ASM Technologies Ltd has the market capitalization of 36.97 B, it has increased by 8.23% over the last week.
Yes, you can track ASM Technologies Ltd financials in yearly and quarterly reports right on TradingView.
ASMTEC net income for the last quarter is 93.11 M INR, while the quarter before that showed 191.17 M INR of net income which accounts for −51.29% change. Track more ASM Technologies Ltd financial stats to get the full picture.
As of Feb 6, 2026, the company has 1.82 K employees. See our rating of the largest employees — is ASM Technologies Ltd on this list?
EBITDA measures a company's operating performance, its growth signifies an improvement in the efficiency of a company. ASM Technologies Ltd EBITDA is 1.01 B INR, and current EBITDA margin is 17.22%. See more stats in ASM Technologies Ltd financial statements.
Like other stocks, ASMTEC shares are traded on stock exchanges, e.g. Nasdaq, Nyse, Euronext, and the easiest way to buy them is through an online stock broker. To do this, you need to open an account and follow a broker's procedures, then start trading. You can trade ASM Technologies Ltd stock right from TradingView charts — choose your broker and connect to your account.
Investing in stocks requires a comprehensive research: you should carefully study all the available data, e.g. company's financials, related news, and its technical analysis. So ASM Technologies Ltd technincal analysis shows the sell today, and its 1 week rating is sell. Since market conditions are prone to changes, it's worth looking a bit further into the future — according to the 1 month rating ASM Technologies Ltd stock shows the buy signal. See more of ASM Technologies Ltd technicals for a more comprehensive analysis.
If you're still not sure, try looking for inspiration in our curated watchlists.
If you're still not sure, try looking for inspiration in our curated watchlists.