move pending??? most of adani stocks gave a run up
personally entered today @375
sl 20-25% depending on market condition
if this is a proper breakout, can touch 800+ soon
AWL trade ideas

ADANI WILAMR by KRS Charts5th Nov 2024 / 9:22 AM
Why AWL ❓❓
1. Decent Fundamental and Corrected Stock Technically.
2. Even its Correcting since long time, it made HL in monthly Timeframe. Which is good sign.✅
3. Clearly 5 Wave Correction Structure is finished, One Bounce is expected till 4th Wave height from current price.
4. Upside Movement can be Sluggish it's a swing Entry so. 📈
With a Good R/R more than 1:3 Target will be 509 Rs.
with SL of 285 Rs Daily Closing Basis.

ADANI WILMAR ON SUPPORT When WILMAR falls from high and start accumulating in the bottom zone , when price go up volume also goes up but price goes down volume doesn’t. It’s shows that there is opportunity to invest in this support area . Charts price shows rectangular channel bottom price . Now if we pick up from here then we have low risk.

Awl price movement ! So that was expected as I says before the price is looking good below around 315 the smooth buy side liquidity grab today that liquidity pools are highly magnetic price will always respect that levels!

315 is highly energetic area price are looking goodawl share is an a good area below 315 is a huge liquidity not any recommendation but it’s a great opportunity I look for quick displacement probably next week!

Monthly Chart Looking GoodKey Highlights : 🔰
🔷 Script Name : Adani Wilmar
🔷 Script Symbol : NSE:AWL
🔶 Stock In Demand Zone 🔥
🔶 Stock Support Level Near ₹ 300/- 🔥
🔶 Narrow Monthly Bollinger Bands 🔥
🔶 Volume Supported Price Move 💚
🔷 Stop Loss : Below ₹300/- Weekly Close 👀
🔷 Target : 🤔😊
Disclaimer: This is NOT investment advice. This post is meant for learning purposes only. Invest your capital at your own risk.
Happy learning. Cheers!!
Shyorawat Arun Singh ❤️
(@Shyorawat_ArunSingh)
Founder : Shyorawat Investing School


AWL - Breaking out of its weekly consolidation ?Adani Wilmar Ltd. breaking out of its consolidation zone on weekly chart and forming a bottom. Still week to close, lets see if it sustains or enters in consolidation zone again
An interesting chart to keep on radar
Lets See How it Evolves.
Disclaimer: NOT A BUY / SELL RECOMMENDATION I am not an expert I just share interesting charts here for educational purpose and not to be taken as buy/sell recommendation. Please seek expert opinion before investing and trading as trading/ investing in market is subject to market risks. I do not hold any position in the stock as on date but I may look to buy on dips with my own Risk Reward matrix.

ADANI WILMAR (DAILY)- IS THE SURGE IMMINENT?The stock seems to be consolidating in a tight range facing multiple rejections and support. The stock made a strong move of around 9% today while taking support from 50 and 200 ema, indicating buyers' interest. Entry above 410 can be initiated upon breaking out from the zone.
Considering the financial perspective with technical analysis, the stock seems ready for action.

Adani Wilmar crossing the Fibonacci resistanceAdani Wilmar has been in down trend since long and since then it is moving in a channel.
In addition, based on Fibonacci levels it is crossing the first resistance level at 23.6% and will change it trend if it sustains above the levels of 414. The fourth attempt in breaking the resistance level.
If we get good volume then expecting 2-3 Target levels on the Fibonacci level of 38.2% and 50% of the next resistance levels at 414-474-557 and more if market sustains.
No recommendations, just my view based on chart pattern.

Long-term InvestmentIt's weekly time frame strategy for long term ... Entry when price bullish cross super trend level.. 1st target 40% share book @ 40% gain, 2nd target 30% share book @ 40% gain from 1st target... congratulation your investment is back with profit.... and also you have 30% share which is free of cost, so can hold it for life time If you want

Stock near Biuying Zone: Adani WilmarWilmar has been in downtrend.
It is trading near the the key support zone of 355.
It has strong support at 330 levels.
Resistance zone are around 380 - 420

A simple guide to coming up with an investment OpportunityHello,
1. Understand the Business
Before committing your money to any investment, the first and most crucial step is to thoroughly understand the company you’re considering. Below are some of the things you carefully need to look at.
Business Model: Start by breaking down the company’s business model. How does the company generate revenue? What are its primary products or services? In our case here;
Adani Wilmar Ltd. provides edible oil, vanaspati and specialty fats. The firm offers vanaspati, packed basmati rice, pulses, soya chunks, besan and specialty fats, lauric range products, castor oils, oleo chemicals and non-GMO soya products.
More analysis on the revenues & expenses of the company is also very key. All this data can be found on the Tradingview website under financials.
Once you have understood the companies moat, now its time to move to technical analysis.
Technical analysis is a method used to evaluate and predict the future price movements of financial assets, like stocks, by analyzing past market data, primarily price and volume.
Technical analysis is very important since all market information has been priced in the stock market price. Below is a past chart for the company adani Wilnar.
The chart shows that the company has moved from the bottom to the top and back to the bottom. From our Tradingview chart it's possible to identify the trend as well as the time used for each move. This will be very key as we build our trading bias. From our chart, its easy to see the time taken for each move and the highest/lowest prices.
Our chart easily communicates that the stock has been on a sideways move for over 500 days. Very key to note is that the stock is also trading at the bottom. This makes it at a great buy point.
Next is to identify the patterns forming on the chart. In our chart the stock is forming a corrective wave for a buy to the upside. My buy areas would be around 320 with my first target at IRN 500. I shall relook at the stock once we hit those areas.
Recommendation
Based on the analysis, consider buying Adani Wilmar Ltd. stock at around IRN 320, with a target to sell at IRN 500. Monitor the stock closely, especially as it approaches the target, to reassess your position.
Good luck!

SELL ADANI WILMAR @ 385 - 410Adani Wilmar is trading in a range which is 410 on upside and 325 to 315 is on downside. The stock is currently trading at upper range and we expect stock to heading towards lower range again. Sell @ 385 and add more if it goes upside until 411 is intact.
To motivate us, Please like the idea If you agree with the analysis.
Happy Trading!
InvestPro India

AWL - Readying for breakoutAlmost a year of accumulation
Last 2 weeks showing HIgh Delivery
Ready for Breakout
Target seems 4 figures in coming
Sl approx 20% so Trade accordingly

AWL : CYPER PATTERN - CLUSTER SUPPORTS -EIFFEL TOWER VOLUMEAdani Wilmar Ltd. is an interesting chart with following
1. RSI on daily and weekly above 60
2. Price Consolidating between 285- 390 for almost last 8-9 months
3. Price trading above 14, 50, 64, 100, Day SMA and Above 20,50 Week SMA
4. Cluster of Averages support at 340-342-346-350 zones
5. Super Trend turned bullish on weekly chart
6. Cyper pattern under formation on Weekly chart.
7. Price gain with huge Eiffel Tower like Volume Bars.
Can be a good risk reward with buy on dips and dips near cluster of support and / or above 400 levels once price breaks out of consolidation channel and retests the same as per one's own risk reward setup
Lets See How it Evolves.
Disclaimer: NOT A BUY / SELL RECOMMENDATION I am not an expert I just share interesting charts here for educational purpose and not to be taken as buy/sell recommendation. Please seek expert opinion before investing and trading as trading/ investing in market is subject to market risks. I do not hold any position in the stock as on date but I may look to buy on dips with my own Risk Reward matrix.

Adani Wilmar to catch up soon (Study Purpose)It is on the verge of breakout, SL is the BO Candle Rs348. Long overdue run up pending alongside other Adani group companies.
Q3 results are descent.
May move quickly towards Rs411, Rs510 and upon sustaining then upto Fib ext 1.618 levels.
Rsi above falling trendline, soon cmp will catch up with the move.
Adx showing strength.
Price at 200sma.
Disclaimer : Above scenario just for educational purpose and study of graphical movements as per available technical parameters derived by professionals. Be careful before investing and consult your advisor before making such decisions. I am not responsible for any mishaps or losses or gains. Not a registered sebi member.
Not invested yet.

AWL for 27% in 1 year. Momentum started on AWL, Company posted highest ever profit this quarter.
AWL is having potential to give 27% upside soon.

Buy Awl for a target of 440Buy Awl for a target of 440 in 1 month
Target of 500 in 3 months
Stock has reversed from long term support, can be added to portfolio

AWL FIRST TRAGET 500+ FINAL TRAGET 800+The AWL Adam Wilmer Stocks are clearly show the volume projection is very high so I have decided the short term bat one to three months short term target are 370 to 500 plus and medium to long term prospective targets are meet 800 plus but these target are achieved only for dependent in company sales growth company profit growth and companies margin growth this all criteria fulfill for the company so very easily achieve this all type of targets this stocks are my personal portfolio already so keep please discuss your financial advisor for this type of investment this contain are only for allocational purpose not for stock recommendation I have the shear for the technical perspective technical chart note for the any financial advice so please this type of investment please advise your financial advisor then after that you have invest this is stocks thank you

Adani Wilmar - Rangebound StartegyA range-bound trading strategy refers to a method in which traders buy at the support zone and sell at the resistance zone for a given stock. If price has bounced back multiple times from support and corrected multiple times from a particular resistance zone, this creates a good range to trade.
Typically, traders use range-bound trading in conjunction with other indicators, such as RSI or MACD

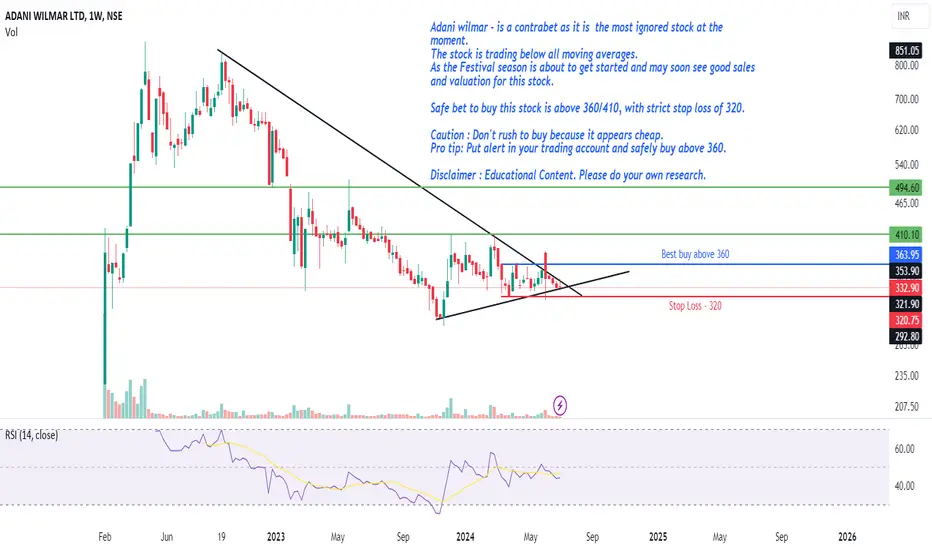
AWL - Best buy above 360Adani wilmar - is a contrabet as it is the most ignored stock at the moment.
The stock is trading below all moving averages.
As the Festival season is about to get started and may soon see good sales and valuation for this stock.
Safe bet to buy this stock is above 360/410, with strict stop loss of 320.
Caution : Don't rush to buy because it appears cheap.
Pro tip: Put alert in your trading account and safely buy above 360.
Disclaimer : Educational Content. Please do your own research.
AWL (Daily)AWL (Daily)
Adani Wilmar LTD
CMP 337
Stock is consolidating in a range from long time
can be good to buy above 350 close with volume
